. 2012 Oct;12(10):2663-74.
doi: 10.1111/j.1600-6143.2012.04191.x. Epub 2012 Jul 23.

T regulatory cells play a significant role in modulating MHC class I antibody-induced obliterative airway disease

Affiliations

T regulatory cells play a significant role in modulating MHC class I antibody-induced obliterative airway disease

V Tiriveedhi et al. Am J Transplant. 2012 Oct.

Abstract

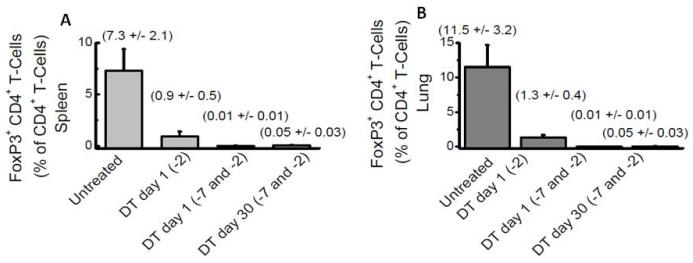
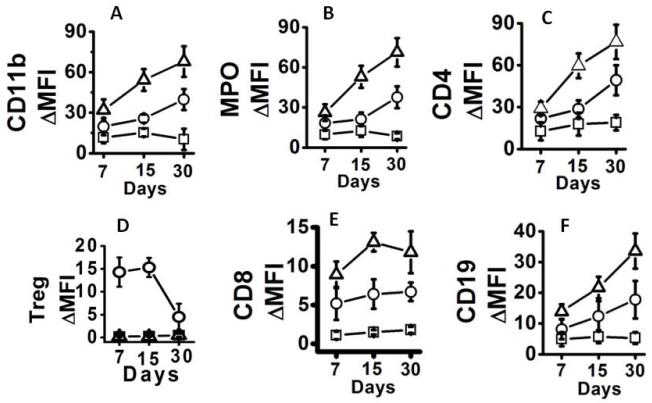
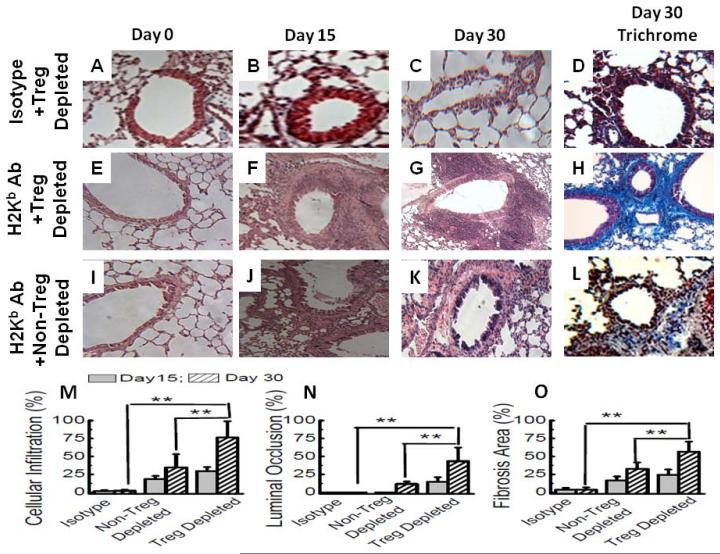
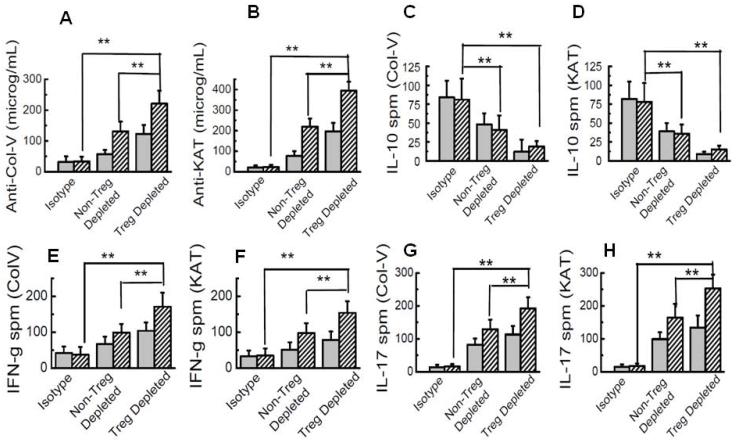
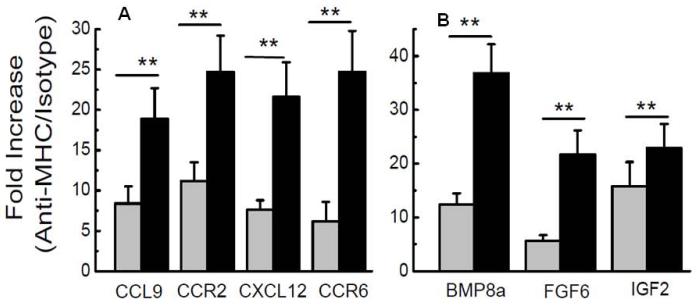
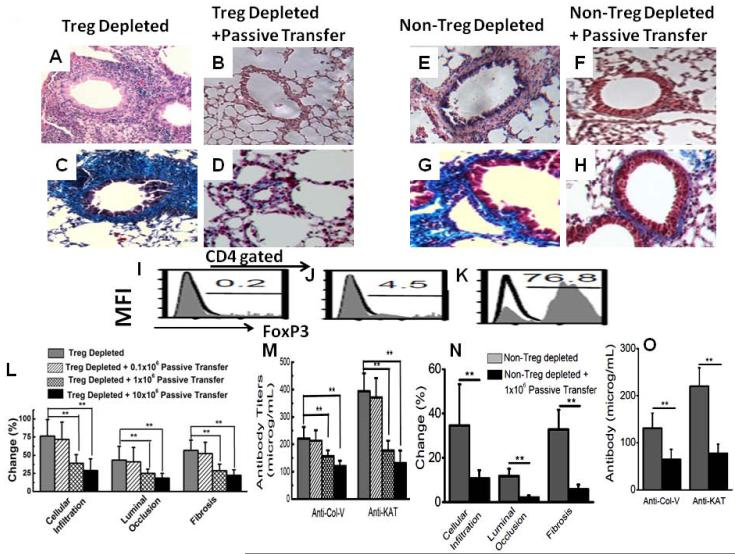
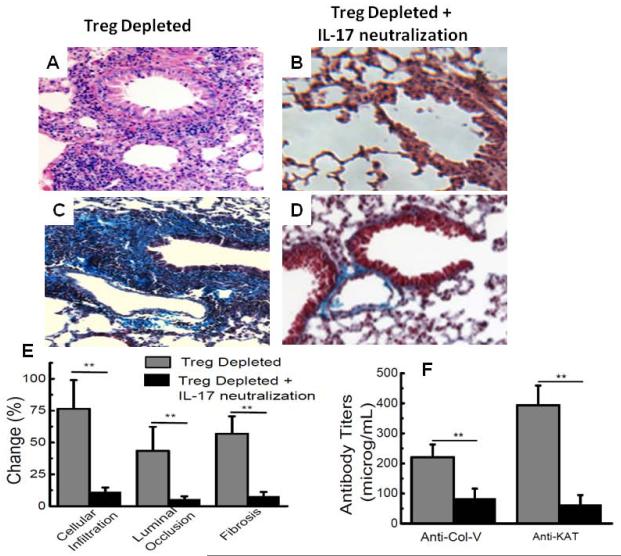
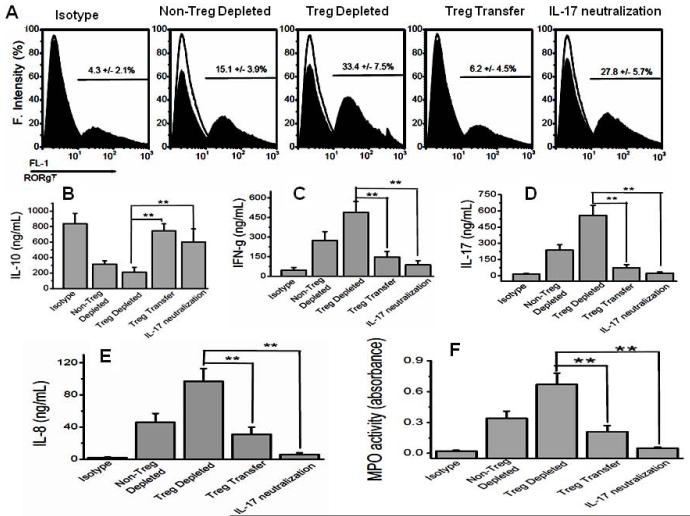
The molecular mechanisms leading to the development of chronic lung allograft dysfunction following de novo development of antibodies to mismatched donor MHC remain undefined. We demonstrated that intrabronchial administration of antibodies to MHC class I resulted in induction of both innate and adaptive cellular immune responses characterized by a predominance of Th17 specific to lung associated self-antigens Kα1-tubulin and Collagen-V leading to the development of obliterative airway lesions (OAD), correlate of chronic rejection following human lung transplantation. To determine the role of regulatory T cells (Treg) in the pathogenesis of OAD, we administered anti-MHC class I to mice, in which Treg were depleted by conditional ablation of FoxP3+cells. Under this condition, we observed a threefold increase in pulmonary cellular infiltration, luminal occlusion and fibrous deposition when compared anti-MHC class I Ab administered mice maintaining FoxP3. OAD lesions were accompanied with enhanced accumulation of neutrophils along with self-antigen-specific Th17 and humoral responses. However, IL-17-blockade or adoptive transfer of Treg abrogated OAD. We conclude that Treg exerts a suppressive effect on anti-MHC induced IL-8-mediated neutrophil infiltration and innate immune responses that leads to inhibition of Th17 immune responses to lung associated self-antigens which is critical for development of OAD.


Figures

Figure 1
Figure 1
Depletion of FoxP3+ Tregs following administration of DT. FACS analysis done on splenocytes (A) and lungs (B) collected from FoxP3-DTR C57BL/6 mice 24 hrs and 30 days following the administration of DT.
Figure 2
Figure 2
Kinetic analysis of the cellular infiltration following Treg depletion in the alloimmune murine OAD model. The infiltration with neutrophils and monocytes by CD11b (A), myeloperoxidase (MPO) enzyme expression as a specific marker of neutrophils (B), CD4+T cells (C), FoxP3+ cells of CD4 sorted T cells as a marker of Treg (D), CD8+T cells (E), and B cells quantitated by CD19 (F). Temporal analysis was performed on day 7, 15, and 30 on isotype Ab treated, anti-MHC class I treated wild type and Treg depleted animals. The data is represented as mean fluorescence shift (Δ MFI) in arbitrary units. The data is represented as a mean ± SEM over a 5 different measurements. (squares) represent isotype administered Treg depleted group, (circles) represent non-Treg depleted MHC class I Ab treated group, and (triangles) represent Treg-depleted MHC class I Ab treated group.
Figure 3
Figure 3
Histology from lungs harvested on day 15 and 30 following intrabronchial administration of H2Kb Abs to FoxP3-DTR C57BL/6 mice on day 1,2,3,6 and weekly.(A-D) represent isotype treated Treg-depleted FoxP3-DTR C57BL/6 with two doses of DT on day -7 and -2, (E-H) represent Treg depleted FoxP3-DTR C57BL/6 with two doses of DT on day -7 and -2; (I-L) represent non-Treg depleted FoxP3-DTR C57BL/6 without DT treatment; ( A,E,I) represent H&E staining on lungs harvested on day 0; (B,F,J) represent H&E staining on lungs harvested on day 15; (C,G,K) represent H&E staining on lungs harvested on day 30; (D,H,L) represent trichrome staining on lungs harvested on day 30(I-K); (M-O) represents morphometric analysis performed using NIS-Elements BR software of the cellular infiltration (M), luminal occlusion (N) and fibrosis (O); The histological analysis by H&E staining of the lungs harvested on day 30 following administration of H2Kb Ab demonstrated a significant increase in cellular infiltration around bronchioles (Isotype= 2.1± 1.8%; non-Treg depleted/ H2Kb Ab = 34.1± 18.6% ; and Treg depleted/ H2Kb Ab = 76.4± 22.6%) resulting in luminal occlusion (Isotype= 0%; non-Treg depleted/ H2Kb Ab = 11.8± 3.3% ; and Treg depleted/ H2Kb Ab = 43.4± 18.9%). Trichrome staining to quantitate the fibrosis also demonstrated significant increase in fibrosis (Isotype= 3.9± 2.9%; non-Treg depleted/ H2Kb Ab = 32.8± 8.9%; and Treg depleted/ H2Kb Ab = 56.7± 13.8%) in Treg depleted animals. The data is represented as a mean ± SEM over a 5 different measurements, (**) p-value <0.01.
Figure 4
Figure 4
Analysis of the humoral and cellular responses on day 15 and 30 following administration of MHC class I Abs to Treg depleted and non-Treg depleted animals. (A,B) represent the serum concentration of Abs to self-Ags ColV (A) and Kα1T (B) analyzed by ELISA. The Abs to ColV (Isotype= 34± 15 μ g/mL; non-Treg depleted/ H2Kb Ab = 161± 32 μ g/mL; and Treg depleted/ H2Kb Ab = 221± 41 μ g/mL; p-value<0.05 for each group) and Kα1T (Isotype= 23± 11 μ g/mL; non-Treg depleted/ H2Kb Ab = 219± 39 μ g/mL; and Treg depleted/ H2Kb Ab = 394± 44 μ g/mL; p-value<0.05 for each group). (C-H) ELISpot analysis to quantitate the cellular responses determined from splenocytes; (C,D) represent the IL-10 cellular responses to self-Ags ColV (C) and Kα1T (D), IL-10 specific T-cellular response to ColV (Isotype= 81± 28 spm; non-Treg depleted/ H2Kb Ab = 41± 19 spm; and Treg depleted/ H2Kb Ab = 19± 7 spm; p-value<0.05) and Kα1T (Isotype= 78± 25 spm; non-Treg depleted/ H2Kb Ab = 36± 12 spm; and Treg depleted/ H2Kb Ab = 15± 5 spm; p-value<0.05 for each group); (E,F) represent the IFN-γ cellular responses to self-Ags ColV (E) and Kα1T (F), IFN-γ response to ColV (Isotype= 38± 21 spm; non-Treg depleted/ H2Kb Ab = 104± 23 spm; and Treg depleted/ H2Kb Ab = 171± 39 spm; p-value<0.05 for each group) and Kα1T (Isotype= 35± 20 spm; non-Treg depleted/ H2Kb Ab = 98± 21 spm; and Treg depleted/ H2Kb Ab = 154± 28 spm; p-value<0.05 for each group with respect to Isotype); (G,H) represent the IL-17 cellular responses to self-Ags ColV (G) and Kα1T (H), IL-17 responses (figure G-H) to ColV (Isotype= 16± 7 spm; non-Treg depleted/ H2Kb Ab = 113± 26 spm; and Treg depleted/ H2Kb Ab = 192± 34 spm; p-value<0.05 for each group with respect to Isotype) and Kα1T (Isotype= 17± 8 spm; non-Treg depleted/ H2Kb Ab = 134± 37 spm; and Treg depleted/ H2Kb Ab = 253± 42 spm; p-value<0.05 for each group with respect to Isotype). The bars in grey shade represent day 15 and bars with crossed lines shade represent day 30. The data is represented as a mean ± SEM over 5 different measurements.
Figure 5
Figure 5
Gene expression analysis of chemokines, their receptors and growth factors on the mRNA collected from the lungs harvested on day 7. Bars in grey shade represent non-Treg depleted animals and bars in dark shade represent Treg depleted animals. Increased expression of CCL9 (2.2 fold, p<0.05), CCR2 (2.6 fold, p<0.05), CXCL12 (3.1 fold, p<0.05) and CCR6 (4 fold, p<0.05), in Treg depleted over non-Treg depleted groups (individually quantitated over Isotype group) was observed. Expression of the growth factors (Figure 4B), BMP8a (3.8 fold, p<0.05), FGF6 (4.5 fold, p<0.05) and IGF2 (1.4 fold, p<0.05) were also significantly increased in Treg depleted vs. non-Treg depleted group (individually quantitated over Isotype group). Other CXC and CC chemokines (CXCL13, CCL2,7,8, MIP-2 etc) showed marginal or no increase at all and did not achieve statistical significance. The data is represented as a mean ± SEM over 5 different measurements. Bars in grey shade represent non-Treg depleted group and those in dark shade represent Treg depleted group.
Figure 6
Figure 6
Histology from lungs harvested on day 30 following adoptive transfer of 0.1, 1 and 10×106 Tregs peritoneally, and intrabronchial administration of H2Kb Abs to FoxP3-DTR C57BL/6 mice on day 1,2,3,6 and weekly. (A,C) H&E and trichrome staining of the lungs collected from Treg depleted FoxP3-DTR C57BL/6 mice without adoptive transfer of Tregs; (B,D) H&E and trichrome staining of the lungs collected from Treg depleted FoxP3-DTR C57BL/6 mice with adoptive transfer of 10 x106Tregs; (E,G) H&E and trichrome staining of the lungs collected from non-Treg depleted FoxP3-DTR C57BL/6 mice without adoptive transfer of Tregs; (F,H) H&E and trichrome staining of the lungs collected from non-Treg depleted FoxP3-DTR C57BL/6 mice with adoptive transfer of 10 x106Tregs; (I) frequency of FoxP3+ cells in CD4+ gated lung infiltrating cells in Treg depleted FoxP3-DTR C57BL/6 mice harvested from lungs on day 30; (J) frequency of FoxP3+ cells in CD4+ gated lung infiltrating cells in non-Treg depleted FoxP3-DTR C57BL/6 mice harvested from lungs on day 30; (K) frequency of FoxP3+ cells in CD4+ gated lung infiltrating cells in Treg depleted FoxP3-DTR C57BL/6 mice adoptively transferred with 10× 106 Treg and harvested from lungs on day 30; (L) morphometric analysis to quantitate the cellular infiltration, luminal occlusion and fibrosis following adoptive transfer to Treg depleted group at various serial titration of 0.1, 1 and 10×106 Tregs; (M) serum concentration of Abs to self-Ags ColV and Kα1T in adoptive transfer to Treg depleted group ; (N) morphometric analysis to quantitate the cellular infiltration, luminal occlusion and fibrosis following adoptive transfer (1×10⁶ Treg) to non-Treg depleted group; (O) serum concentration of Abs to self-Ags ColV and Kα1T in adoptive transfer (1×10⁶ Treg) to non-Treg depleted group; Cellular infiltration around bronchioles (Treg depleted/ H2Kb Ab = 76.4± 22.6% vs. adoptively transferred Treg depleted/ H2Kb Ab = 29.3± 16%; p-value<0.05), luminal occlusion (Treg depleted/ H2Kb Ab = 43.4± 18.9% vs. adoptively transferred Treg depleted/ H2Kb Ab = 18.4± 6.7%; p-value<0.05) and fibrosis (Treg depleted/ H2Kb Ab = 56.8± 13.8% vs. adoptively transferred Treg depleted/ H2Kb Ab = 22.4± 7.6%; p-value<0.05) was decreased. Similarly, Abs to self-Ags, ColV (Treg depleted/ H2Kb Ab = 221± 42 μ g/mL vs. adoptively transferred Treg depleted/ H2Kb Ab = 121± 19 μ g/mL; p-value<0.05) and Kα1T (Treg depleted/ H2Kb Ab = 394± 65 μ g/mL vs. adoptively transferred Treg depleted/ H2Kb Ab = 132± 45 μ g/mL; p-value<0.05) were also decreased. The data is represented as a mean ± SEM over 5 different measurements.
Figure 7
Figure 7
Histology from lungs harvested on day 30 following IL-17 neutralization peritoneally, and intrabronchial administration of H2Kb Abs to FoxP3-DTR C57BL/6 mice on day 1,2,3,6 and weekly. (A,C) H&E and trichrome staining of the lungs collected from Treg depleted FoxP3-DTR C57BL/6 mice without IL-17 neutralization ; (B,D) H&E and trichrome staining of the lungs collected from Treg depleted FoxP3-DTR C57BL/6 mice with IL-17 neutralization; (E) morphometric analysis to quantitate the cellular infiltration, luminal occlusion and fibrosis following IL-17 neutralization; (F) serum concentration of Abs to self-Ags, ColV and Kα1T. The cellular infiltration around bronchioles (Treg depleted/ H2Kb Ab = 76.4± 22.6% vs. IL-17 neutralized Treg depleted/ H2Kb Ab = 11.3± 3.4% ; p-value<0.05), luminal occlusion (Treg depleted/ H2Kb Ab = 43.4± 18.9% vs. IL-17 neutralized Treg depleted/ H2Kb Ab = 5.6± 2.1% ; p-value<0.05) and fibrosis (Treg depleted/ H2Kb Ab = 56.8± 13.8% vs. IL-17 neutralized Treg depleted/ H2Kb Ab = 7.8± 3.4% ; p-value<0.05). The Abs to self-Ags, ColV (Treg depleted/ H2Kb Ab = 221± 42 μ g/mL vs. IL-17 neutralized Treg depleted/ H2Kb Ab = 84± 32 μ g/mL; p-value<0.05) and Kα1T (Treg depleted/ H2Kb Ab = 394± 65 μ g/mL vs. IL-17 neutralized Treg depleted/ H2Kb Ab = 64± 31 μ g/mL; p-value<0.05). The data is represented as a mean ± SEM over 5 different measurements.
Figure 8
Figure 8
(A) RORγ T expression on CD4+ lung infiltrating lymphocytes in lungs harvested on day 15 from isotype treated, MHC class I Abs treated non-Treg depleted, MHC class I Abs +Treg depleted , MHC class I Abs +Treg depleted +Adoptive transfer of Treg, and MHC class I Abs +Treg depleted +IL-17 neutralization groups. (B-E) serum concentration of cytokines IL-10 (B), IFN-γ (C), IL-17 (D), and IL-8 (E) from all five cohorts on day 30. (F) Myeloperoxidase (MPO) activity from the lungs harvested on day 30. The data is represented as a mean ± SEM over 5 different measurements.

Similar articles

Cited by

References

    1. Boehler A, Estenne M. Post-transplant bronchiolitis obliterans. Eur Respir J. 2003;22:1007–1018. - PubMed
    1. Boehler A, Kesten S, Weder W, Speich R. Bronchiolitis obliterans after lung transplantation: a review. Chest. 1998;114:1411–1426. - PubMed
    1. Hachem RR, Trulock EP. Bronchiolitis obliterans syndrome: pathogenesis and management. Semin Thorac Cardiovasc Surg. 2004;16:350–355. - PubMed
    1. Trulock EP, Edwards LB, Taylor DO, Boucek MM, Mohacsi PJ, Keck BM, Hertz MI. The Registry of the International Society for Heart and Lung Transplantation: Twentieth Official adult lung and heart-lung transplant report--2003. J Heart Lung Transplant. 2003;22:625–635. - PubMed
    1. Smith MA, Sundaresan S, Mohanakumar T, Trulock EP, Lynch JP, Phelan DL, Cooper JD, Patterson GA. Effect of development of antibodies to HLA and cytomegalovirus mismatch on lung transplantation survival and development of bronchiolitis obliterans syndrome. J Thorac Cardiovasc Surg. 1998;116:812–820. - PubMed

Publication types