. 2012 Aug 1;134(30):12637-47.
doi: 10.1021/ja303739g. Epub 2012 Jul 23.

Modeling the signatures of hydrides in metalloenzymes: ENDOR analysis of a Di-iron Fe(μ-NH)(μ-H)Fe core

Affiliations

Modeling the signatures of hydrides in metalloenzymes: ENDOR analysis of a Di-iron Fe(μ-NH)(μ-H)Fe core

R Adam Kinney et al. J Am Chem Soc. .

Abstract

The application of 35 GHz pulsed EPR and ENDOR spectroscopies has established that the biomimetic model complex L(3)Fe(μ-NH)(μ-H)FeL(3) (L(3) = [PhB(CH(2)PPh(2))(3)](-)) complex, 3, is a novel S = (1)/(2) type-III mixed-valence di-iron II/III species, in which the unpaired electron is shared equally between the two iron centers. (1,2)H and (14,15)N ENDOR measurements of the bridging imide are consistent with an allyl radical molecular orbital model for the two bridging ligands. Both the (μ-H) and the proton of the (μ-NH) of the crystallographically characterized 3 show the proposed signature of a 'bridging' hydride that is essentially equidistant between two 'anchor' metal ions: a rhombic dipolar interaction tensor, T ≈ [T, -T, 0]. The point-dipole model for describing the anisotropic interaction of a bridging H as the sum of the point-dipole couplings to the 'anchor' metal ions reproduces this signature with high accuracy, as well as the axial tensor of a terminal hydride, T ≈ [-T, -T, 2T], thus validating both the model and the signatures. This validation in turn lends strong support to the assignment, based on such a point-dipole analysis, that the molybdenum-iron cofactor of nitrogenase contains two [Fe-H(-)-Fe] bridging-hydride fragments in the catalytic intermediate that has accumulated four reducing equivalents (E(4)). Analysis further reveals a complementary similarity between the isotropic hyperfine couplings for the bridging hydrides in 3 and E(4). This study provides a foundation for spectroscopic study of hydrides in a variety of reducing metalloenzymes in addition to nitrogenase.


Figures

Figure 1
Figure 1
Thermal ellipsoid (50 %) representation of the core atoms of mixed-valence 3.
Figure 2
Figure 2
35 GHz EPR spectrum of 3. Main: Numerical derivative of the CW absorption-display spectrum. Inset The small rhombic splitting (Δ(g2-g3) = 0.016 (101 G)) of the perpendicular region of the spectrum (inset). Experimental conditions: T = 2 K; modulation amplitude, 0.33 G; microwave power, 0.01 mW; microwave frequency, 35.300 GHz. Inset: Davies pulse sequence, π = 80 ns; τ = 600 ns; repetition time, 20 ms; scan time, 200 s; microwave frequency, 34.714 GHz.
Figure 3
Figure 3
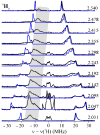
1H ENDOR spectra measured at g2 = 2.047 for the complexes (top to bottom): [Fe]2(H)(NH), [Fe]2(D)(NH), [Fe]2(H)(ND), [Fe]2(D)(ND). All compounds are 2 mM in 1:9 2-methyl THF:THF. Spectral intensities are normalized to the intensity of the 31P ENDOR response at -12 MHz. The ENDOR response from the hydride ligand and the imido ligand proton are marked in blue and red, respectively. The 31P ENDOR response is marked by the gray box. Experimental conditions: microwave frequency, 34.984 to 35.342 GHz; modulation amplitude, 1.33 G; RF power, 10 W; microwave power, 100 mW; stochastic CW timings: sample, 1 ms; delay, 1 ms; RF, 0.75 ms; and the bandwidth of RF excitation was broadened to 100 kHz.
Figure 4
Figure 4
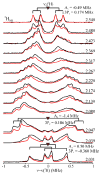
Stochastic-field modulation-detected 1H ENDOR field-frequency pattern of 3. Spectra (black) and simulations (blue) are centered at the proton larmor frequency. Spectral intensity is adjusted arbitrarily for clarity. Simulation intensity is normalized to high frequency edge of individual spectra. Experimental conditions: microwave power, 10 mW; modulation amplitude, 1.3 G; stochastic sequence timings: sample time, 1 ms; delay time, 1 ms; and RF length, 0.75 ms; time constant, 0 ms; RF power, 10 W; temperature, 2K; and the bandwidth of RF excitation was broadened to 100 kHz. Simulations: g = [2.54, 2.047, 2.031]; A = [19.5, 56.3, 41.0] MHz; (α, β, γ) = (0, 5, 0); EPR linewidth 150 MHz; ENDOR linewidth 0.5 MHz; microwave frequency 35.342 GHz.
Figure 5
Figure 5
Schematic representation of the orientation of the g-tensor frame and the hydride dipolar (T) frame within the molecular coordinate system. (lxN,lyN,lzN) (N = 1, 2) are the directional cosines projecting the external magnetic field vector onto the Fe-H bond vectors. Fitting of the experimentally determined principle values of the dipolar tensor yields θ = 38° (the crystal structure value is 40°).
Figure 6
Figure 6
Field-frequency patterns for 11B (left) and 31P (right) ENDOR of 3. Simulations of the 11B pattern (blue) employ the hyperfine and quadrupole tensors given in the text. Experimental Conditions (11B): Mims pulse sequence, π = 50 ns; stochastic data acquisition; τ = 500 ns; repetition time, 20 ms; tRF, 15 ms; and the RF amplifier output filtered with 20 MHz low pass filter. Experimental conditions (31P): microwave power, 10 mW; modulation amplitude, 1.3 G p-p; stochastic sequence timings: sample time, 1 ms; delay time, 1 ms; and RF length, 0.75 ms; time constant, 0 ms; RF power, 10 W; temperature, 2K; and the bandwidth of RF excitation was broadened to 100 kHz.
Figure 7
Figure 7
2H Mims field-frequency ENDOR pattern from fully-deuterated 3. The center (δν = 0 MHz) of the simulated ENDOR pattern was adjusted by +16 G to accommodate an offset in the center field. The simulation intensity was matched to the individual ENDOR spectra for clarity. Experimental conditions. Microwave frequency, 34.718 GHz; π/2 = 50 ns; τ = 500 ns; tRF= 30 μs; repetition rate, 20 ms; RF randomly hopped. Simulations. g = [2.54, 2.047, 2.031]; A = [-0.49, -1.4, 0.5] MHz, (α, β, γ) = (90, 6, 100); P = [0.058, 0.062, -0.12] MHz (coaxial) (g1= z); EPR/ENDOR linewidth = 200/0.05 MHz; τ = 500 ns.
Figure 8
Figure 8
35 GHz pulse 14,15N Davies ENDOR of 3(14,15N) measured at the principal g values. The ENDOR responses for the 14N nucleus (blue, solid) and 15N nucleus (red, solid) are noted, with simulations for both (dotted). The inset shows the 35 GHz field-swept 14N ν+ CW ENDOR response from 3. Experimental conditions: microwave frequency, 34.934 GHz; π = 200 ns; τ = 600 ns; trf = 30 μs, repetition rate, 20 ms; and the RF was hopped randomly. Inset: microwave frequency, 35.326 GHz, microwave power, 0.01 mW; modulation amplitude, 0.33 G; temperature, 2K. Simulations: g = [2.54, 2.047, 2.031]; 14N: A = -[3, 5.7, 2.5] MHz, P = [0.19, -0.31, 0.12] MHz; 15N: A = +[4.1, 8, 3.5] MHz; A and g (and P for 14N) are coaxial.
Figure 9
Figure 9
Variable mixing time 14N Davies ENDOR of 3 at g3= 2.031. The spectra shown have been displayed as a direct overlay (top) and as normalized at ν-(14N; *) (bottom). Experimental conditions. Microwave frequency, 34.986 GHz; repetition rate, 20-23 ms; τ = 600 ns; RF randomly hopped.
Scheme 1
Scheme 1

Similar articles

Cited by

References

    1. Igarashi RY, Laryukhin M, Santos PCD, Lee H-I, Dean DR, Seefeldt LC, Hoffman BM. J Am Chem Soc. 2005;127:6231. - PubMed
    1. Fan C, Teixeira M, Moura J, Moura I, Huynh B-H, le Gall J, Peck HD, Jr, Hoffman BM. J Am Chem Soc. 1991;113:20.
    1. Stein M, Lubitz W. Phys Chem Chem Phys. 2001;3:5115.
    1. Lubitz W, Reijerse E, van Gastel M. Chem Rev (Washington, DC, U S) 2007;107:4331. - PubMed
    1. Amara P, Mouesca J-M, Volbeda A, Fontecilla-Camps JC. Inorg Chem (Washington, DC, U S) 2011;50:1868. - PubMed

Publication types

MeSH terms