

Agonist dynamics and conformational selection during microsecond simulations of the A(2A) adenosine receptor
- PMID: 22824275
- PMCID: PMC3341534
- DOI: 10.1016/j.bpj.2012.03.061
Agonist dynamics and conformational selection during microsecond simulations of the A(2A) adenosine receptor
Abstract
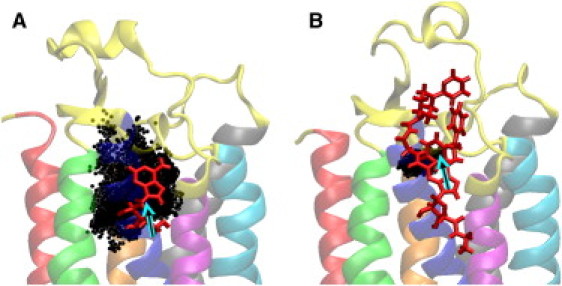
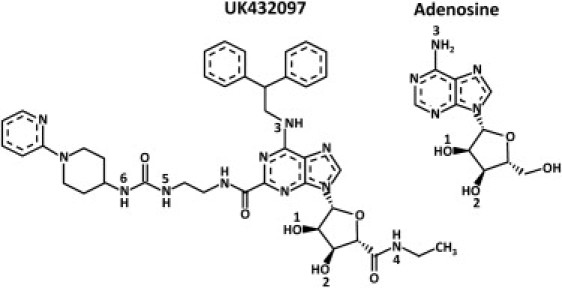
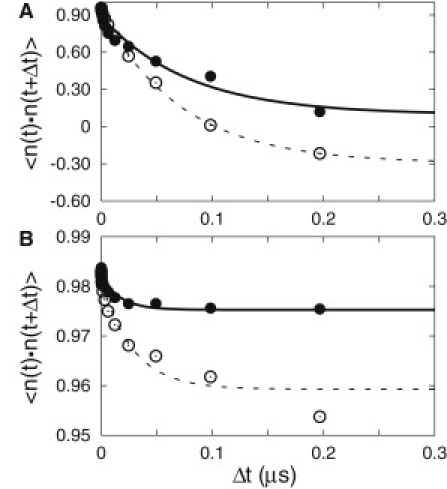
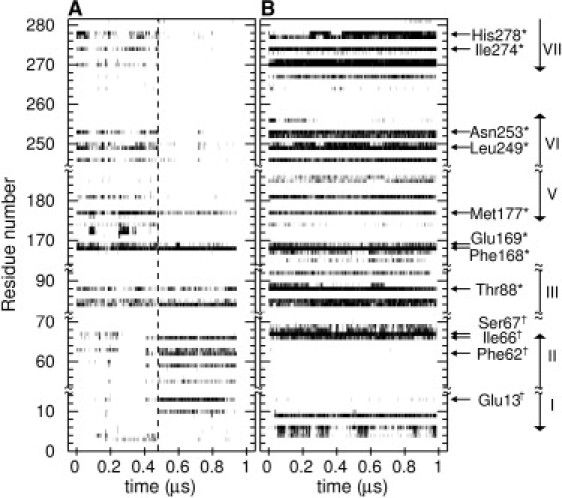
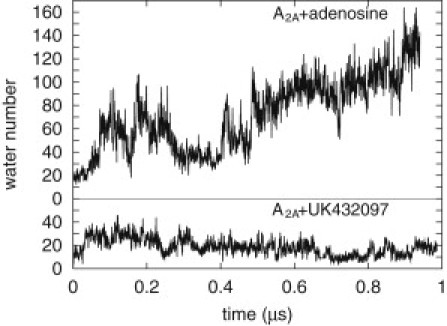
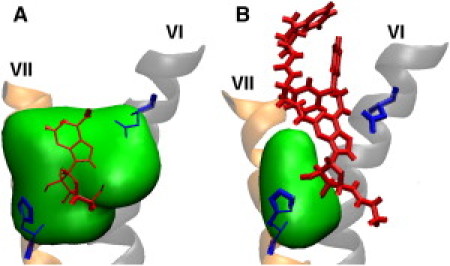
The G-protein-coupled receptors (GPCRs) are a ubiquitous family of signaling proteins of exceptional pharmacological importance. The recent publication of structures of several GPCRs cocrystallized with ligands of differing activity offers a unique opportunity to gain insight into their function. To that end, we performed microsecond-timescale simulations of the A(2A) adenosine receptor bound to either of two agonists, adenosine or UK432097. Our data suggest that adenosine is highly dynamic when bound to A(2A), in stark contrast to the case with UK432097. Remarkably, adenosine finds an alternate binding pose in which the ligand is inverted relative to the crystal structure, forming relatively stable interactions with helices I and II. Our observations suggest new experimental tests to validate our predictions and deepen our understanding of GPCR signaling. Overall, our data suggest an intriguing hypothesis: that the 100- to 1000-fold greater efficacy of UK432097 relative to adenosine arises because UK432097 stabilizes a much tighter neighborhood of active conformations, which manifests as a greater likelihood of G-protein activation per unit time.
Copyright © 2012 Biophysical Society. Published by Elsevier Inc. All rights reserved.
Figures
Similar articles
-
Agonist-bound adenosine A2A receptor structures reveal common features of GPCR activation.Nature. 2011 May 18;474(7352):521-5. doi: 10.1038/nature10136. Nature. 2011. PMID: 21593763 Free PMC article.
-
Insights into adenosine A2A receptor activation through cooperative modulation of agonist and allosteric lipid interactions.PLoS Comput Biol. 2020 Apr 16;16(4):e1007818. doi: 10.1371/journal.pcbi.1007818. eCollection 2020 Apr. PLoS Comput Biol. 2020. PMID: 32298258 Free PMC article.
-
Dynamic Role of the G Protein in Stabilizing the Active State of the Adenosine A2A Receptor.Structure. 2019 Apr 2;27(4):703-712.e3. doi: 10.1016/j.str.2018.12.007. Epub 2019 Jan 31. Structure. 2019. PMID: 30713025 Free PMC article.
-
Agonist-bound structures of G protein-coupled receptors.Curr Opin Struct Biol. 2012 Aug;22(4):482-90. doi: 10.1016/j.sbi.2012.03.007. Epub 2012 Apr 3. Curr Opin Struct Biol. 2012. PMID: 22480933 Review.
-
Recent Advances in the In-silico Structure-based and Ligand-based Approaches for the Design and Discovery of Agonists and Antagonists of A2A Adenosine Receptor.Curr Pharm Des. 2019;25(7):774-782. doi: 10.2174/1381612825666190306162006. Curr Pharm Des. 2019. PMID: 30848185 Review.
Cited by
-
Ligand-dependent activation and deactivation of the human adenosine A(2A) receptor.J Am Chem Soc. 2013 Jun 12;135(23):8749-59. doi: 10.1021/ja404391q. Epub 2013 May 29. J Am Chem Soc. 2013. PMID: 23678995 Free PMC article.
-
Concerted dynamic motions of an FABP4 model and its ligands revealed by microsecond molecular dynamics simulations.Biochemistry. 2014 Oct 14;53(40):6409-17. doi: 10.1021/bi500374t. Epub 2014 Oct 2. Biochemistry. 2014. PMID: 25231537 Free PMC article.
-
Retinal Conformation Changes Rhodopsin's Dynamic Ensemble.Biophys J. 2015 Aug 4;109(3):608-17. doi: 10.1016/j.bpj.2015.06.046. Biophys J. 2015. PMID: 26244742 Free PMC article.
-
Role of Extracellular Loops and Membrane Lipids for Ligand Recognition in the Neuronal Adenosine Receptor Type 2A: An Enhanced Sampling Simulation Study.Molecules. 2018 Oct 12;23(10):2616. doi: 10.3390/molecules23102616. Molecules. 2018. PMID: 30322034 Free PMC article.
-
Binding of the Antagonist Caffeine to the Human Adenosine Receptor hA2AR in Nearly Physiological Conditions.PLoS One. 2015 May 20;10(5):e0126833. doi: 10.1371/journal.pone.0126833. eCollection 2015. PLoS One. 2015. PMID: 25992797 Free PMC article.
References
-
- Gilchrist A. John Wiley & Sons; Hoboken, NJ: 2010. GPCR Molecular Pharmacology and Drug Targeting.
-
- Jaakola V.-P., Ijzerman A.P. The crystallographic structure of the human adenosine A2A receptor in a high-affinity antagonist-bound state: implications for GPCR drug screening and design. Curr. Opin. Struct. Biol. 2010;20:401–414. - PubMed
Publication types
MeSH terms
Substances
Grants and funding
LinkOut - more resources
Full Text Sources
