

Glutathione (GSH) and the GSH synthesis gene Gclm modulate vascular reactivity in mice
- PMID: 22824862
- PMCID: PMC3625031
- DOI: 10.1016/j.freeradbiomed.2012.07.006
Glutathione (GSH) and the GSH synthesis gene Gclm modulate vascular reactivity in mice
Abstract
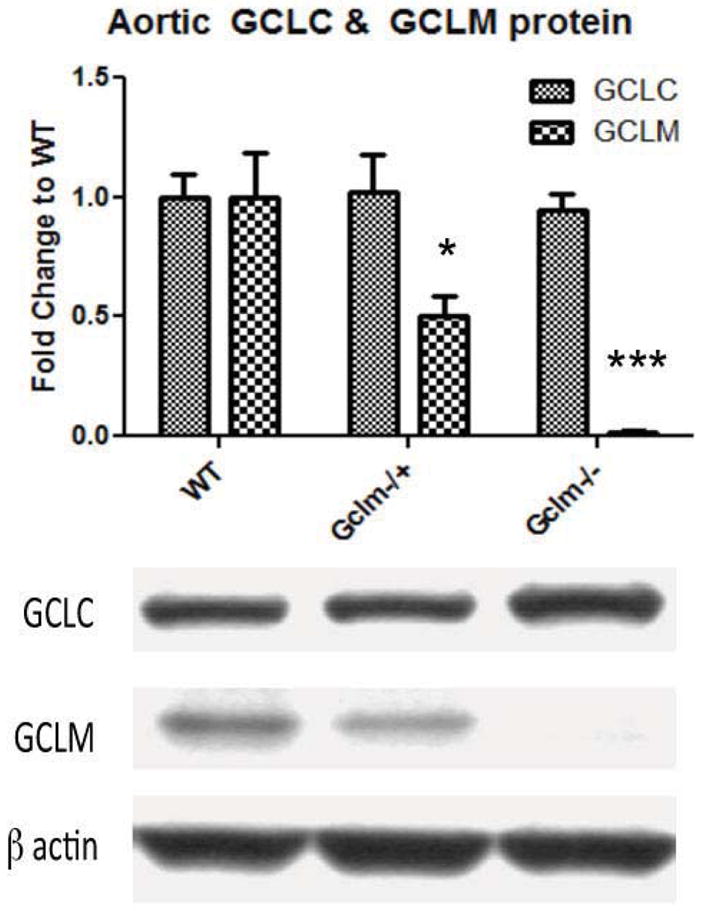
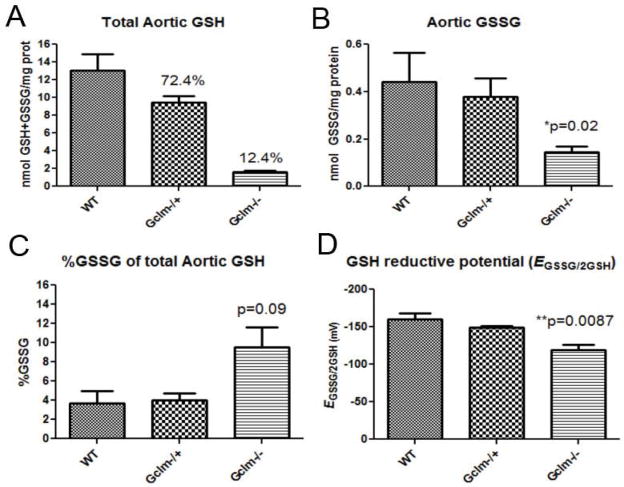
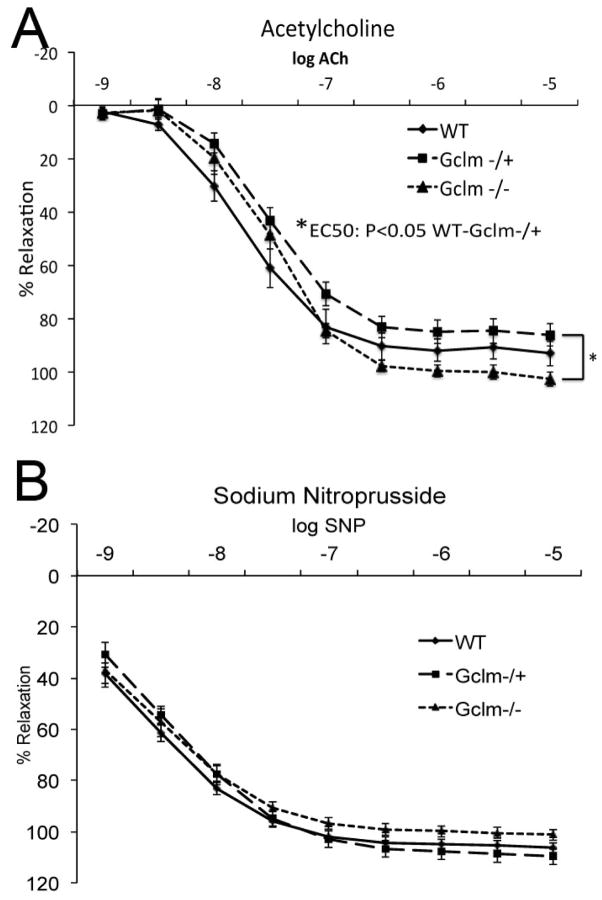
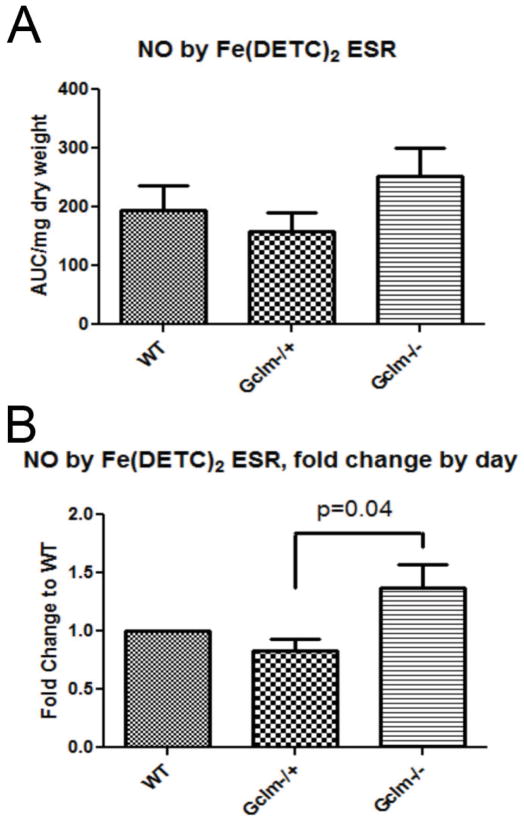
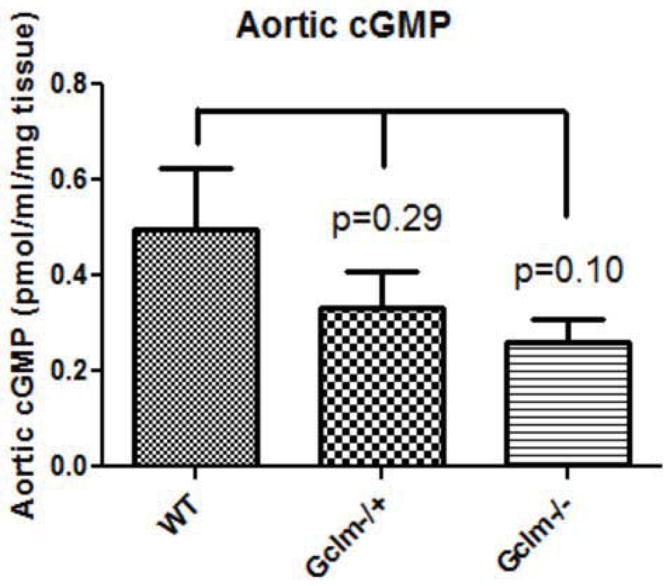
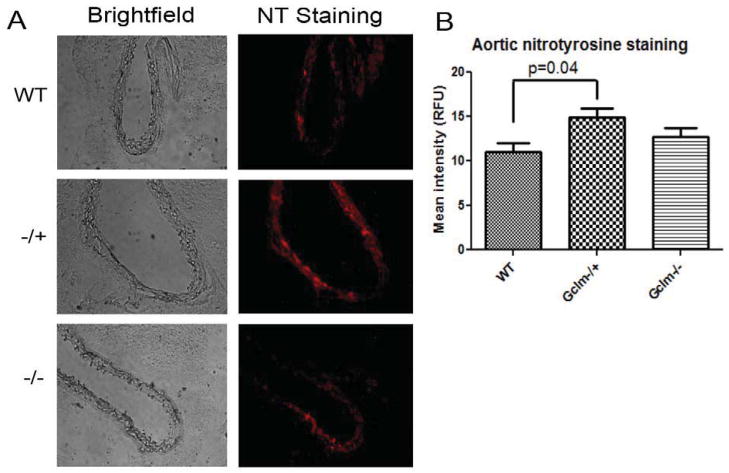
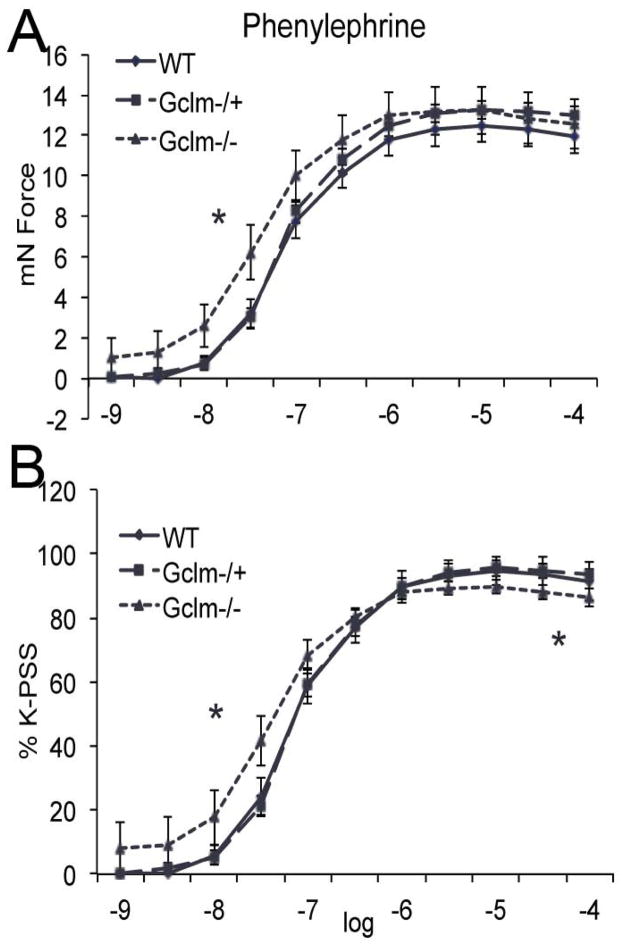
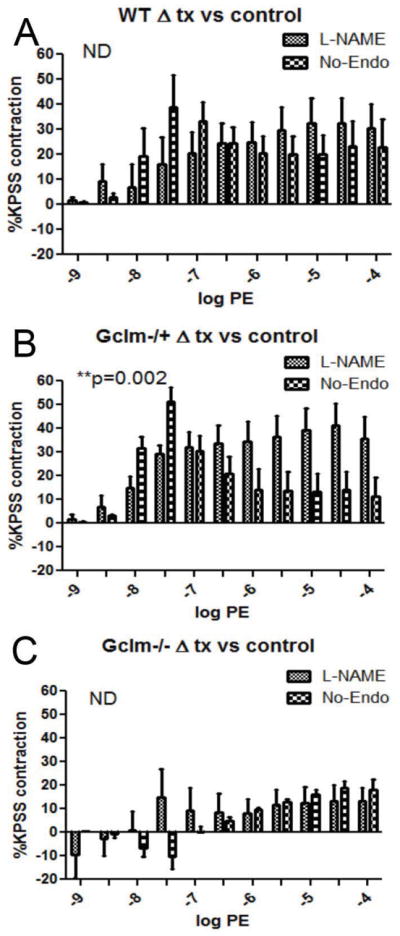
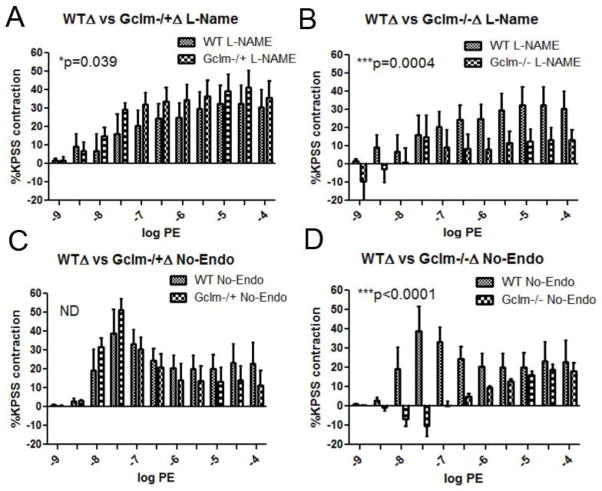
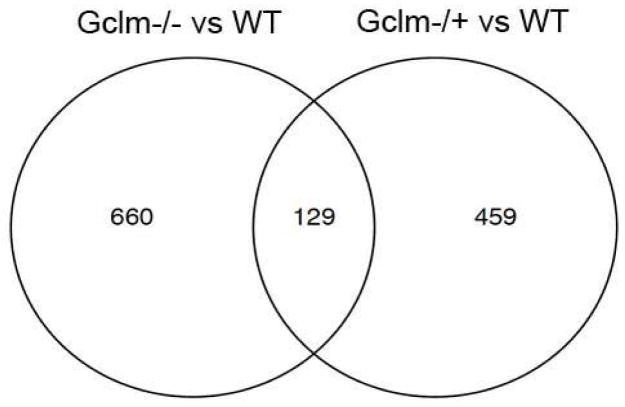
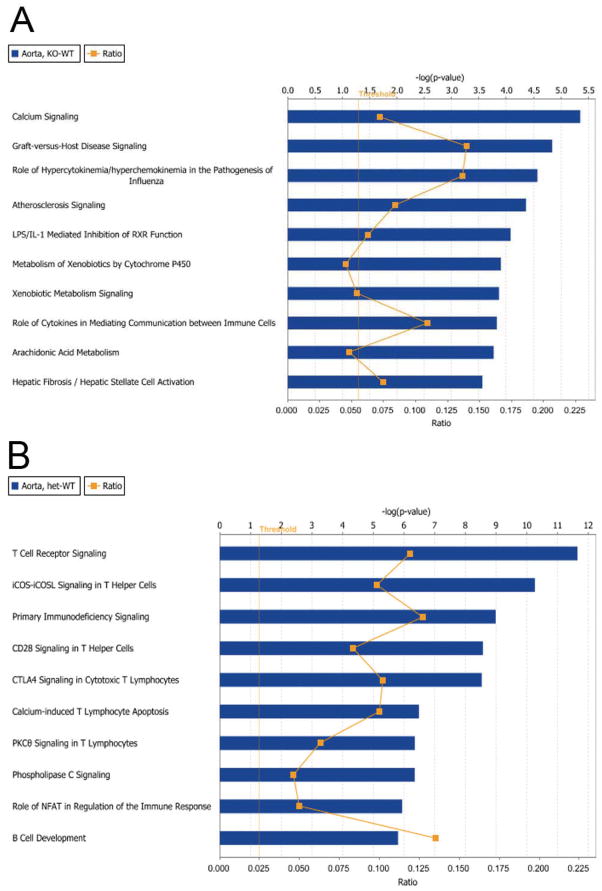
Oxidative stress has been implicated in the development of vascular disease and in the promotion of endothelial dysfunction via the reduction in bioavailable nitric oxide (NO()). Glutathione (GSH) is a tripeptide thiol antioxidant that is utilized by glutathione peroxidase (GPx) to scavenge reactive oxygen species such as hydrogen peroxide and phospholipid hydroperoxides. Relatively frequent single-nucleotide polymorphisms (SNPs) within the 5' promoters of the GSH synthesis genes GCLC and GCLM are associated with impaired vasomotor function, as measured by decreased acetylcholine-stimulated coronary artery dilation, and with increased risk of myocardial infarction. Although the influence of genetic knockdown of GPx on vascular function has been investigated in mice, no work to date has been published on the role of genetic knockdown of GSH synthesis genes on vascular reactivity. We therefore investigated the effects of targeted disruption of Gclm in mice and the subsequent depletion of GSH on vascular reactivity, NO() production, aortic nitrotyrosine protein modification, and whole-genome transcriptional responses as measured by DNA microarray. Gclm(-/+) and Gclm(-/-) mice had 72 and 12%, respectively, of wild-type (WT) aortic GSH content. Gclm(-/+) mice had a significant impairment in acetylcholine (ACh)-induced relaxation in aortic rings as well as increased aortic nitrotyrosine protein modification. Surprisingly, Gclm(-/-) aortas showed enhanced relaxation compared to Gclm(-/+) aortas, as well as increased NO() production. Although aortic rings from Gclm(-/-) mice had enhanced ACh relaxation, they had a significantly increased sensitivity to phenylephrine (PE)-induced contraction. Alternatively, the PE response of Gclm(-/+) aortas was nearly identical to that of their WT littermates. To examine the role of NO() or other potential endothelium-derived factors in differentially regulating vasomotor activity, we incubated aortic rings with the NO() synthase inhibitor L-NAME or physically removed the endothelium before PE treatment. L-NAME treatment and endothelium removal enhanced PE-induced contraction in WT and Gclm(-/+) mice, but this effect was severely diminished in Gclm(-/-) mice, indicating a potentially unique role for GSH in mediating vessel contraction. Whole-genome assessment of aortic mRNA in Gclm(-/-) and WT mice revealed altered expression of genes within the canonical Ca(2+) signaling pathway, which may have a role in mediating these observed functional effects. These findings provide additional evidence that the de novo synthesis of GSH can influence vascular reactivity and provide insights regarding possible mechanisms by which SNPs within GCLM and GCLC influence the risk of developing vascular diseases in humans.
Copyright © 2012 Elsevier Inc. All rights reserved.
Figures
References
-
- Adachi T, Weisbrod RM, Pimentel DR, Ying J, Sharov VS, Schöneich C, Cohen RA. S-Glutathiolation by peroxynitrite activates SERCA during arterial relaxation by nitric oxide. Nat Med. 2004;10:1200–7. - PubMed
-
- Allison DB, Cui X, Page GP, Sabripour M. Microarray data analysis: from disarray to consolidation and consensus. Nat Rev Genet. 2006;7:55–65. - PubMed
-
- Botta D, White CC, Vliet-Gregg P, Mohar I, Shi S, Mcgrath MB, Mcconnachie LA, Kavanagh TJ. Modulating GSH synthesis using glutamate cysteine ligase transgenic and gene-targeted mice. Drug Metab Rev. 2008;40:465–77. - PubMed
-
- Brocq ML, Leslie SJ, Miliken P, Megson IL. Endothelial Dysfunction: From Molecular Mechanisms to Measurement, Clinical Implications, and Therapeutic Opportunities. Antioxidants and Redox Signaling. 2008;10:1631–1673. - PubMed
Publication types
MeSH terms
Substances
Grants and funding
- 5R01DK073878/DK/NIDDK NIH HHS/United States
- 5U24DK076126/DK/NIDDK NIH HHS/United States
- P50 ES015915/ES/NIEHS NIH HHS/United States
- T32 ES007032/ES/NIEHS NIH HHS/United States
- P30 ES007033/ES/NIEHS NIH HHS/United States
- R01 DK073878/DK/NIDDK NIH HHS/United States
- 5P30ES007033/ES/NIEHS NIH HHS/United States
- 5T32ES007032/ES/NIEHS NIH HHS/United States
- 5P50ES015915/ES/NIEHS NIH HHS/United States
- P30 DK017047/DK/NIDDK NIH HHS/United States
- R01 HL055362/HL/NHLBI NIH HHS/United States
- U24 DK076126/DK/NIDDK NIH HHS/United States
LinkOut - more resources
Full Text Sources
Molecular Biology Databases
Research Materials
Miscellaneous
