. 2012 Jul 19;3(7):e351.
doi: 10.1038/cddis.2012.92.

Copy number aberrations of BCL2 and CDKN2A/B identified by array-CGH in thymic epithelial tumors

Affiliations

Copy number aberrations of BCL2 and CDKN2A/B identified by array-CGH in thymic epithelial tumors

I Petrini et al. Cell Death Dis. .

Abstract

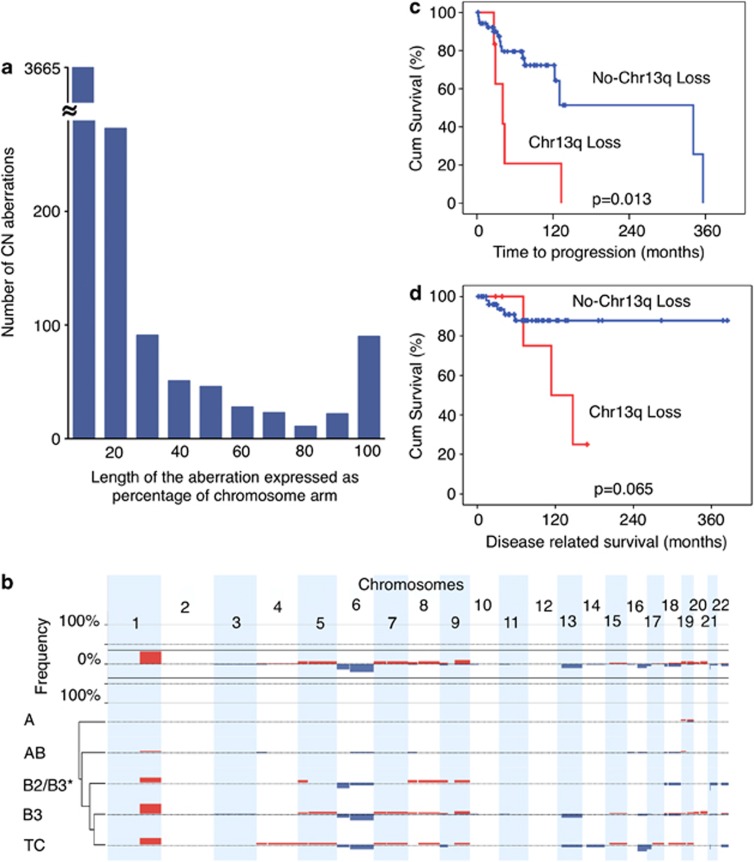
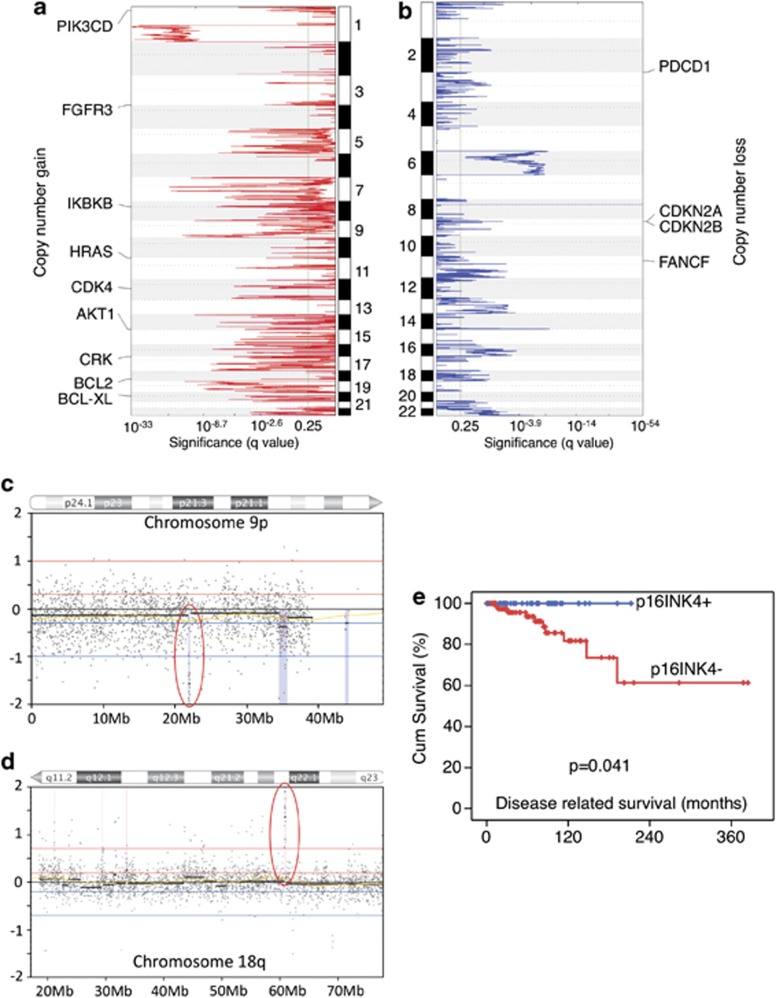
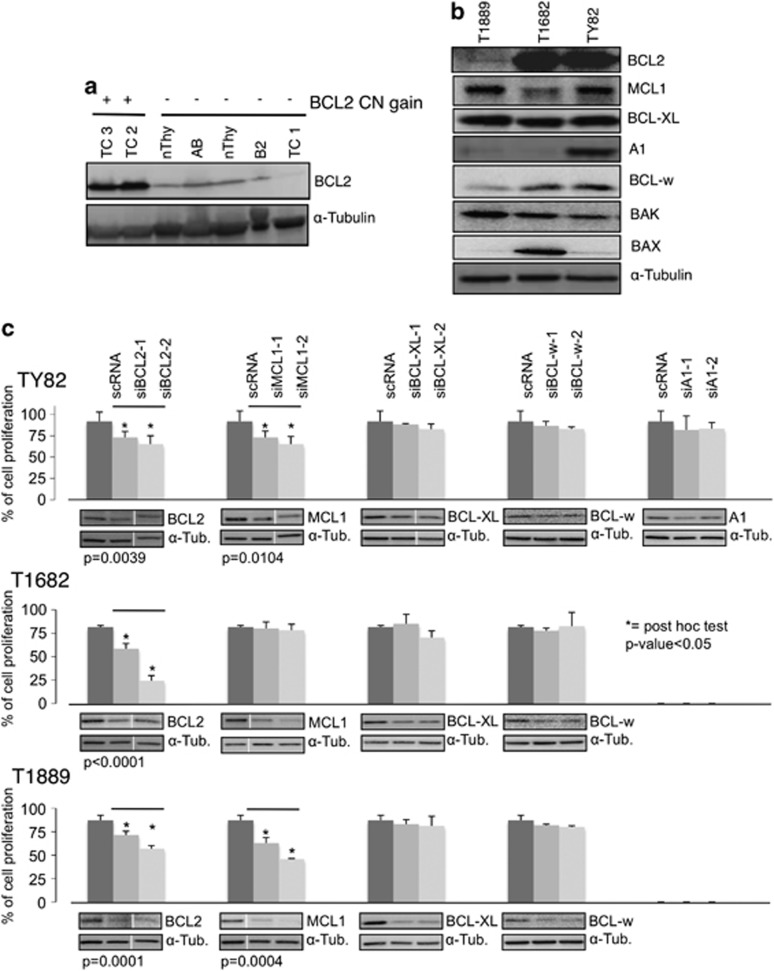
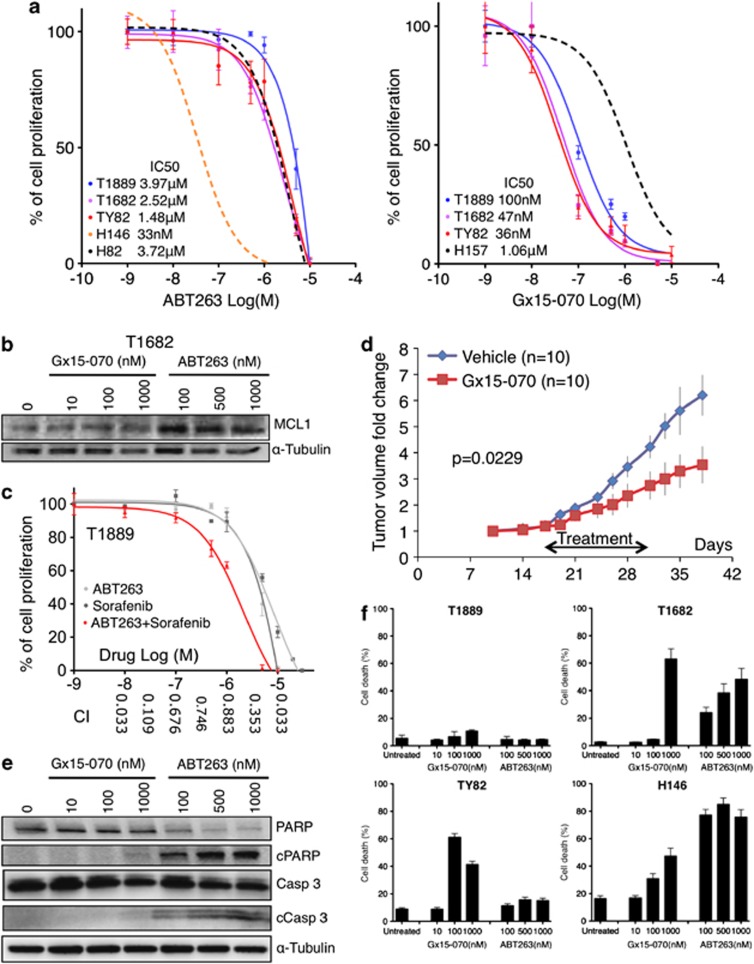
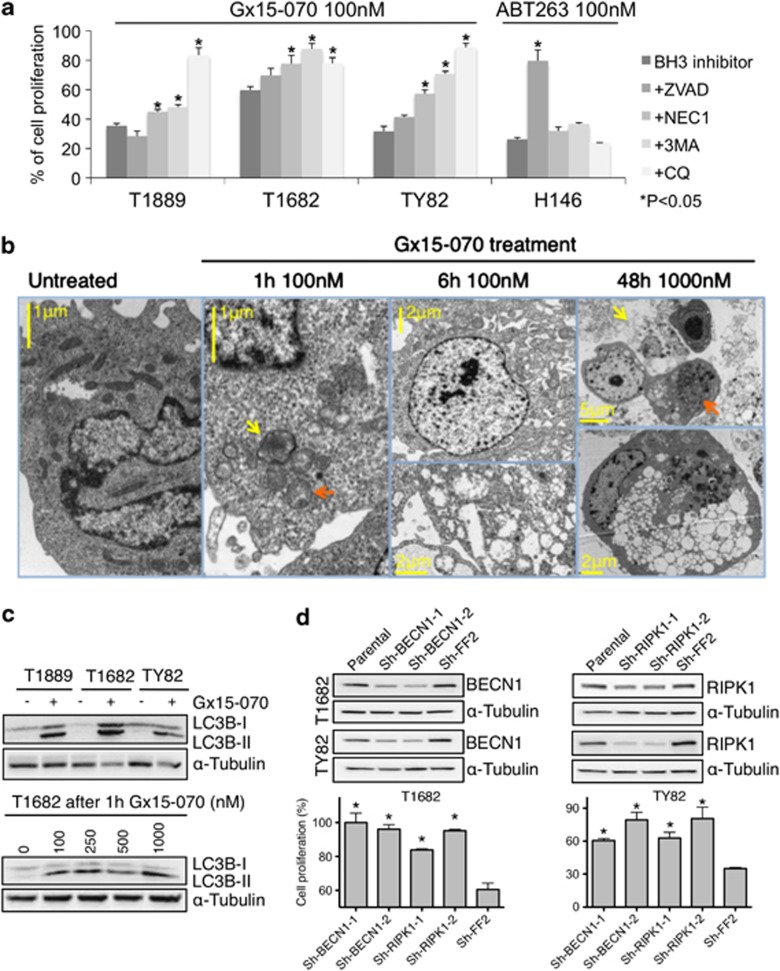
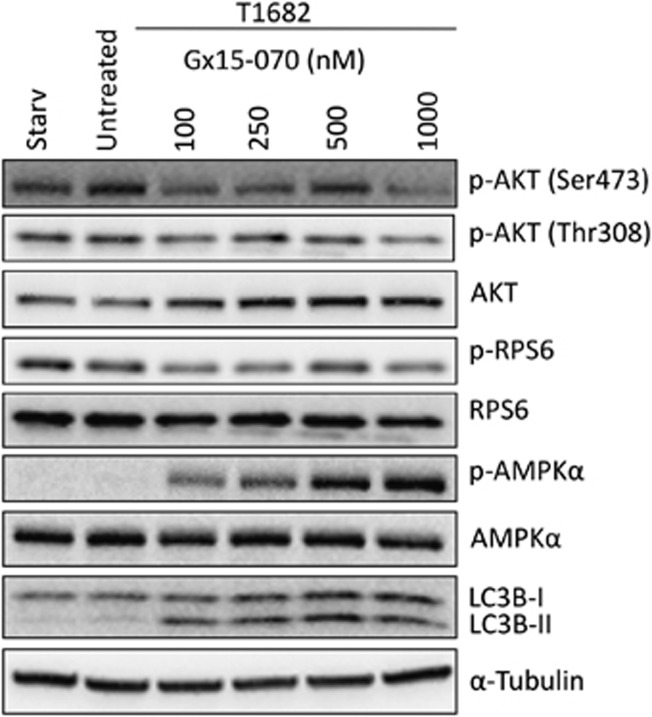
The molecular pathology of thymic epithelial tumors (TETs) is largely unknown. Using array comparative genomic hybridization (CGH), we evaluated 59 TETs and identified recurrent patterns of copy number (CN) aberrations in different histotypes. GISTIC algorithm revealed the presence of 126 significant peaks of CN aberration, which included 13 cancer-related genes. Among these peaks, CN gain of BCL2 and CN loss of CDKN2A/B were the only genes in the respective regions of CN aberration and were associated with poor outcome. TET cell lines were sensitive to siRNA knockdown of the anti-apoptotic molecules BCL2 and MCL1. Gx15-070, a pan-BCL2 inhibitor, induced autophagy-dependent necroptosis in TET cells via a mechanism involving mTOR pathways, and inhibited TET xenograft growth. ABT263, an inhibitor of BCL2/BCL-XL/BCL-W, reduced proliferation in TET cells when administered in combination with sorafenib, a tyrosine kinase inhibitor able to downregulate MCL1. Immunohistochemistry on 132 TETs demonstrated that CN loss of CDKN2A correlated with lack of expression of its related protein p16(INK4) and identified tumors with poor prognosis. The molecular markers BCL2 and CDKN2A may be of potential value in diagnosis and prognosis of TETs. Our study provides the first preclinical evidence that deregulated anti-apoptotic BCL2 family proteins may represent suitable targets for TET treatment.


Figures

Figure 1
Figure 1
Arm-level CN aberrations in TETs identified by CGH. (a) Arm-level CN aberrations were divided into 10 categories according to their length expressed as the percentage of the relative chromosome arm affect by the aberration. The number of CN aberrations covering <10% of the chromosome arm length were the most abundant. The power function y=6.5636x−2.546 summarizes the distribution of CN aberrations based on chromosome arm length from 0 to 80%, and based on this equation the expected number of 90–100% arm-length CN aberrations was 7 instead of 90 observed (χ2, P<0.001). (b) Arm-level CN gains (red) and losses (blue) of autosomal chromosomes. Arm-level CN aberrations were defined by the sum of all the CN gain or all the CN loss affecting one chromosome arm in each tumor. If this sum was >80% of the chromosome arm length it was considered an arm-level CN aberration. The top panel depicts the overall summary of frequency of arm-level CN aberrations. The arm-level CN aberrations grouped by histotype (A, AB, B2+B2/B3, B3 and TCs) are summarized in the bottom panel. * indicates B2 and B2/B3. Thymic carcinomas and B3 thymomas exhibit similar patterns of arm-level CN aberrations. Only few arm-level CN aberrations were observed in type A thymomas. (c) Time to progression and (d) disease-related survival curves in relation to 13q CN loss
Figure 2
Figure 2
Identification of significant CN aberration peaks with survival implications. (a) Peaks of CN gain and (b) CN loss identified by GISTIC algorithm. GISTIC q-values (x axis) are plotted across the genome (y axis). q-value of<0.25 was considered significant. Thirteen cancer-related genes were identified in the GISTIC peaks. (c) Representative samples with focal CN loss of CDKN2A/B locus and (d) focal CN gain of BCL2 locus on chromosomes 9p and 18q, respectively. x axis indicates genome map position, and y axis the log2 ratio of red and green signals from the array. Blue dots represent the array probes. Red circles indicate CDKN2A/B and BCL2 loci. (e) Disease-related survival in relation to CDKN2A expression evaluated by immunohistochemistry
Figure 3
Figure 3
Deregulation of BCL2 family genes in TETs. (a) BCL2 protein is more expressed in thymic carcinomas with BCL2 CN gain (TC2 and TC3) than in samples without CN gain. TC1, TC2, TC3: thymic carcinomas; B2 and AB: thymomas; nThy: normal thymus. (b) Expression of BCL2 anti-apoptotic and pro-apoptotic molecules in three TET cell lines by western blot analysis. (c) siRNA knockdown of anti-apoptotic BCL2 family proteins in the three TET cell lines. Cell proliferation was measured using MTS assay 72 h after siRNA transfection. Data were normalized to those of untransfected cells. BCL2 and MCL1 siRNAs induced a significant reduction of cell proliferation in all three TET cell lines, and in T1889 and TY82, respectively (*P<0.05). Western blots showed siRNA knockdown in each experiment. Note longer exposure revealed that BCL2 expression was detectable in T1889 cells (b and c)
Figure 4
Figure 4
Effect of two BCL2 anti-apopotic family inhibitors, ABT263 and Gx15-070, in TET cell lines. (a) MTS assay of ABT263 and Gx15-070 in TET and control cell lines. H146, H82 small cell lung cancer cell lines were used as references in ABT263 and H157 non-small cell lung cancer cell line in Gx15-070 experiments. Experiments were repeated four times. (b) In T1682 cells, ABT263 treatment increases MCL1 level compared with untreated cells or Gx15-070-treated cells. (c) T1889 was more sensitive to ABT263 and Sorafenib combination than to each single drug treatment as shown by MTS assay. Combination index (CI) values, reported on x axis, were calculated using Calcusync and demonstrated a synergistic effect for the drug combination: values <1 denotes synergism. Results for T1889 and TY82 are summarized in Supplementary Table S5. Experiments repeated three times. (d) Gx15-070 suppressed the growth of TY82 xenografts. Average fold change of tumor volume of 10 mice treated by Gx15-070 and 10 by vehicle alone are reported. The black arrow indicates the timing of treatment. (e) Cleavage of PARP and caspase-3 was assessed by western blot after 48-h treatment with various concentrations of Gx15-070 and ABT263 in T1682 cells. (f) Cell death induced by Gx15-070 and ABT263 was expressed as percentage of dead cells over total number of cells (cell death %). Cells were treated with the indicated concentrations of Gx15-070 and ABT263 for 48 h, stained with TOPRO3 and followed by flow cytometry analysis. Note that the highest effect of Gx15-070 in Ty82 cells was detected at 100 nM and was less pronounced at 1000 nM. This could be due to the off-target effect of Gx15-070 at high concentration that antagonized on-target effect of the drug (experiments were repeated two times)
Figure 5
Figure 5
Gx15-070 induces autophagy and necroptosis in TET cells. (a) Inhibitors of pan-caspase (50 μM ZVAD-FMK), necroptosis (30 μM NEC1), autophagosome formation (5 μM 3MA) and autophagosome maturation (25 μM CQ) rescued Gx15-070-induced growth inhibition. Percentage of reduction in cell growth induced by 100 nM Gx15-070 was calculated from the MTS data in the presence or absence of the indicated inhibitors for the three TET cell lines and for the small cell lung cancer cell line H146 as control. (*one-way ANOVA post hoc P<0.05; experiments were repeated three times). (b) Time-course electron microscopic morphology of T1682 cells treated with Gx15-070 at the indicated concentrations. After 1-h treatment, lamellar bodies (yellow arrow) consistent with early signs of autophagy and mitochondrial structural changes with loss of cristae (orange arrow) were evident. After 6-h treatment, early signs of necroptosis with intact nuclear envelope (top panel), and mitochondrial swelling with loss of mitochondrial matrix and cytoplasm vacuolization were observed (bottom panel). After 48-h treatment, late stages of necroptotic cell death (yellow arrow) and advanced stages of autophagy (orange arrow) were evident. The bottom panel depicts advanced stage of autophagic cell death with cytoplasmic vacuolization and lamellar bound structures consistent with autophagosomes. (c) Gx15-070 (1 μM) induced LC3BII accumulation after 48-h treatments in TET cells (top blot). LC3BII accumulation was observed in T1682 cells 1-h after Gx15-070 treatment at a concentration as low as 100 nM (bottom blot). (d) BECN1 and RIPK1 knockdown rescues Gx15-070-induced growth inhibition. Western blot shows shRNA knockdown of Beclin1 (sh-BECN1-1 and sh-BECN1-2) and RIPK1 (sh-RIPK1-1 and sh-RIPK1-2) in T1682 and TY82 cell lines. Sh-FF2: shRNA control vector carrying anti-exogenous luciferase shRNA FF2 (top). MTS assay of BECN1 and RIPK1 knockdown cells treated with 250 nM Gx15-070 (bottom). *denotes statistically significant differences compared with control (P<0.05); experiments were repeated three times
Figure 6
Figure 6
Effect of Gx15-070 of mTOR pathway and on AMPKα. Effect of 6h Gx15-070 treatment on T1682 cells compared with untreated cells and cells starved for 6 h. The treatment induced a progressive reduction of p-AKT (Ser473 and Thr308) and p-RPS6 with the exception of 500 nM concentration. Progressive increase of LC3B-II and AMPKα phosphorylation was observed in Gx15-070 concentration-dependent manner

References

    1. de Jong WK, Blaauwgeers JL, Schaapveld M, Timens W, Klinkenberg TJ, Groen HJ. Thymic epithelial tumours: a population-based study of the incidence, diagnostic procedures and therapy. Eur J Cancer. 2008;44:123–130. - PubMed
    1. Travis WD, Brambilla E, Muller-Hermelink HK, Harris CC. Pathology and Genetics: Tumors of the Lung, Pleura, Thymus And Heart. IARC Press: Lyon, France; 2004.
    1. Chiecchio L, Protheroe RK, Ibrahim AH, Cheung KL, Rudduck C, Dagrada GP, et al. Deletion of chromosome 13 detected by conventional cytogenetics is a critical prognostic factor in myeloma. Leukemia. 2006;20:1610–1617. - PubMed
    1. van den Berg J, Johannsson O, Hakansson S, Olsson H, Borg A. Allelic loss at chromosome 13q12-q13 is associated with poor prognosis in familial and sporadic breast cancer. Br J Cancer. 1996;74:1615–1619. - PMC - PubMed
    1. Beroukhim R, Getz G, Nghiemphu L, Barretina J, Hsueh T, Linhart D, et al. Assessing the significance of chromosomal aberrations in cancer: methodology and application to glioma. Proc Natl Acad Sci USA. 2007;104:20007–20012. - PMC - PubMed

Publication types

MeSH terms

Substances

Supplementary concepts