. 2012 Sep 14;287(38):31905-19.
doi: 10.1074/jbc.M112.368712. Epub 2012 Jul 23.

Generation of N-acylphosphatidylethanolamine by members of the phospholipase A/acyltransferase (PLA/AT) family

Affiliations

Generation of N-acylphosphatidylethanolamine by members of the phospholipase A/acyltransferase (PLA/AT) family

Toru Uyama et al. J Biol Chem. .

Abstract

Bioactive N-acylethanolamines (NAEs), including N-palmitoylethanolamine, N-oleoylethanolamine, and N-arachidonoylethanolamine (anandamide), are formed from membrane glycerophospholipids in animal tissues. The pathway is initiated by N-acylation of phosphatidylethanolamine to form N-acylphosphatidylethanolamine (NAPE). Despite the physiological importance of this reaction, the enzyme responsible, N-acyltransferase, remains molecularly uncharacterized. We recently demonstrated that all five members of the HRAS-like suppressor tumor family are phospholipid-metabolizing enzymes with N-acyltransferase activity and are renamed HRASLS1-5 as phospholipase A/acyltransferase (PLA/AT)-1-5. However, it was poorly understood whether these proteins were involved in the formation of NAPE in living cells. In the present studies, we first show that COS-7 cells transiently expressing recombinant PLA/AT-1, -2, -4, or -5, and HEK293 cells stably expressing PLA/AT-2 generated significant amounts of [(14)C]NAPE and [(14)C]NAE when cells were metabolically labeled with [(14)C]ethanolamine. Second, as analyzed by liquid chromatography-tandem mass spectrometry, the stable expression of PLA/AT-2 in cells remarkably increased endogenous levels of NAPEs and NAEs with various N-acyl species. Third, when NAPE-hydrolyzing phospholipase D was additionally expressed in PLA/AT-2-expressing cells, accumulating NAPE was efficiently converted to NAE. We also found that PLA/AT-2 was partly responsible for NAPE formation in HeLa cells that endogenously express PLA/AT-2. These results suggest that PLA/AT family proteins may produce NAPEs serving as precursors of bioactive NAEs in vivo.


Figures
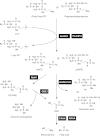
FIGURE 1.
FIGURE 1.
Major biosynthetic and degradative pathways of NAPE and pNAPE. *, PC is a representative acyl donor phospholipid. Abh4, α/β-hydrolase 4; GDE1, glycerophosphodiesterase 1; PA, phosphatidic acid.
FIGURE 2.
FIGURE 2.
Production of NAPE and NAE in COS-7 cells transiently expressing PLA/AT family members. COS-7 cells were transiently transfected with the insert-free vector (lanes (−)) or expression vectors harboring human PLA/AT-1–5 (lanes 1–5, respectively). Homogenates (30 μg of protein) of cells were incubated with 40 μm 1,2-[1-14C]dipalmitoyl-PC and 75 μm 1,2-dioleoyl-PE, and the resultant products were separated by TLC (A). In this assay, N-palmitoyl-PE-forming activity and free palmitic acid-forming activity were regarded as N-acyltransferase activity and PLA1/2 activity, respectively, and these activities were quantified (mean values ± S.D. (error bars), n = 3) (B). #, ratio of N-acyltransferase activity to PLA1/2 activity in each PLA/AT is shown (B). C--E, living cells were incubated with [14C]ethanolamine, and their total lipids were extracted. Radiolabeled lipids were then separated by TLC (C). Relative radioactivities of NAPE (D) and NAE (E) are shown (mean values ± S.D. (error bars), n = 3). The radioactive substance corresponding to NAPE was extracted from the band on the TLC plate and treated with recombinant NAPE-PLD (lane +) or buffer alone (lane −) (F). Cells were radiolabeled with [14C]palmitic acid, and their total lipids were separated by TLC (G). Asterisks indicate significant differences from control cells (p < 0.005). A, C, F, and G, the positions of authentic compounds on the TLC plate are indicated. NPPE, N-palmitoyl-PE; lyso-NPPE, N-palmitoyl-lyso-PE; C16:0, palmitic acid.
FIGURE 3.
FIGURE 3.
Enzyme activity of PLA/AT-2 is required for the production of NAPE. COS-7 cells were transiently transfected with the insert-free vector, expression vector harboring human wild-type PLA/AT-2 (WT), or its mutant C113S. Homogenates (30 μg of protein) of cells were subjected to Western blotting with the anti-FLAG antibody (A) and the N-acyltransferase assay (B) as described under “Experimental Procedures.” B, enzyme activities were quantified (mean values ± S.D. (error bars), n = 3). For metabolic radiolabeling experiments, cells were incubated with [14C]ethanolamine, and their total lipids were analyzed by TLC. Relative radioactivities of NAPE (C) and NAE (D) are shown (mean values ± S.D. (error bars), n = 3). Asterisks indicate significant differences from control cells (p < 0.01).
FIGURE 4.
FIGURE 4.
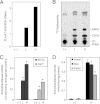
Reactivities of purified PLA/AT-2 with region-specific radiolabeled PCs. Purified recombinant human PLA/AT-2 (0.15 μg of protein) (lanes +) or buffer alone (lanes −) was allowed to react with 40 μm of 1-[14C]palmitoyl-2-palmitoyl-PC (*PP-PC), 1-palmitoyl-2-[14C]palmitoyl-PC (P*P-PC), or 1,2-[14C]dipalmitoyl-PC (*P*P-PC) in the presence of 75 μm of 1,2-dioleoyl-PE. Products were separated by TLC (A) and N-acyltransferase activity was quantified (mean values ± S.D. (error bars), n = 3) (B). The positions of authentic compounds on the TLC plate are indicated. NPPE, N-palmitoyl-PE; lyso-NPPE, N-palmitoyl-lyso-PE; C16:0, palmitic acid.
FIGURE 5.
FIGURE 5.
Stable expression of PLA/AT-2 in HEK293 cells. The expression of PLA/AT-2 mRNA was analyzed by semiquantitative real time PCR (A). GAPDH was used as a control. −, mock-transfected HEK293 cells; L, PLA/AT-2-L cells; H, PLA/AT-2-H cells. Cell homogenates (30 μg of protein) were assayed for N-acyltransferase activity as described under “Experimental Procedures,” and products were separated by TLC (B). The positions of authentic compounds on the TLC plate are indicated. NPPE, N-palmitoyl-PE; C16:0, palmitic acid. The N-acyltransferase assay was performed in the presence of 1 mm EDTA or 1 mm CaCl2 (C). Cell homogenates (Homo), soluble fractions (Sup), and particulate fractions (Pellet) (30 μg of protein) were also assayed (D). Enzyme activity is shown as mean values ± S.D. (error bars, n = 3) (C and D). Asterisks indicate significant differences from control cells (p < 0.001).
FIGURE 6.
FIGURE 6.
Metabolic labeling of PLA/AT-2-expressing cells with [14C]ethanolamine. Cells were radiolabeled with [14C]ethanolamine, and their total lipids were separated by TLC (A). The positions of authentic compounds on the TLC plate are indicated. −, mock-transfected HEK293 cells; L, PLA/AT-2-L cells; H, PLA/AT-2-H cells. Relative radioactivities of NAPE and NAE are shown (mean values ± S.D. (error bars), n = 3) (B). Asterisks indicate significant differences from control cells (p < 0.005).
FIGURE 7.
FIGURE 7.
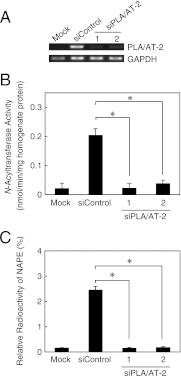
Knockdown of PLA/AT-2 in PLA/AT-2-H cells. PLA/AT-2-H cells were transfected with a control siRNA (siControl) or PLA/AT-2 siRNAs (siPLA/AT-2–1 and -2) (A). After 48 h, total RNAs were isolated and analyzed by RT-PCR using specific primers for the mRNAs of PLA/AT-2 and GAPDH (a control). Cell homogenates (30 μg of protein) were subjected to the N-acyltransferase assay as described under “Experimental Procedures” (B). Enzyme activity is shown as mean values ± S.D. (error bars, n = 3). Cells were radiolabeled with [14C]ethanolamine, and their total lipids were separated by TLC (C). Relative radioactivities of NAPE are shown (mean values ± S.D. (error bars), n = 3). Asterisks indicate significant differences from siControl cells (p < 0.005).
FIGURE 8.
FIGURE 8.
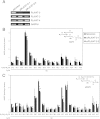
LC-MS/MS analysis of N-acylated ethanolamine phospholipids in PLA/AT-2-H cells. Various species of NAPEs (A) and pNAPEs (B) in PLA/AT-2-H cells (closed columns) and control cells (open columns) were analyzed by LC-MS/MS as described under “Experimental Procedures.” N-Heptadecanoyl-1,2-dipalmitoyl-PE was used as an internal standard. pNAPEs levels were corrected based on the calibration line constructed with authentic N-heptadecanoyl-1-O-1′(Z)-octadecenyl-2-oleoyl-glycerophosphoethanolamine and N-heptadecanoyl-1,2-dipalmitoyl-PE (B). Results are shown as picomoles/μmol of total phospholipids (mean values ± S.D., n = 2). R1CO+RNCO and R1(CH)2+RNCO represent the total number of carbon atoms and double bonds in sn-1 O-acyl (or sn-1 O-alkenyl) and N-acyl chains.
FIGURE 9.
FIGURE 9.
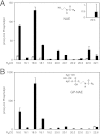
LC-MS/MS analysis of NAEs and GP-NAEs in PLA/AT-2-H cells. Various species of NAEs (A) and GP-NAEs (B) in PLA/AT-2-H cells (closed columns) and control cells (open columns) were analyzed by LC-MS/MS as described under “Experimental Procedures.” NAE and GP-NAE species were quantified on the basis of peak ratios relative to deuterated N-palmitoylethanolamine and glycerophospho-N-heptadecanoylglycerol, respectively. Results are shown as picomoles/μmol of total phospholipids (mean values ± S.D., n = 2).
FIGURE 10.
FIGURE 10.
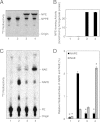
LC-MS/MS analysis of PEs and plasmenylethanolamines and Western blot analysis of peroxisomal proteins in PLA/AT-2-H cells. Various species of diacyl-type PEs (A) and plasmenylethanolamines (B) in PLA/AT-2-H cells (closed columns) and control cells (open columns) were analyzed by LC-MS/MS as described under “Experimental Procedures.” 1,2-Dimyristoyl-PE was used as an internal standard. Plasmenylethanolamine levels were corrected based on the calibration line constructed with authentic dimyristoyl-PE and 1-O-1′(Z)-octadecenyl-2-oleoyl-glycerophosphoethanolamine (B). Results are shown as nanomoles/μmol of total phospholipids (mean values ± S.D., n = 2). C, postnuclear supernatant (PNS), particulate (P), and supernatant (S) fractions of control cells (Mock), PLA/AT-2-H cells (PLA/AT-2-H), and HEK293 cells overexpressing PLA/AT-3 (PLA/AT-3) were analyzed by Western blotting with antibodies against PMP70 and catalase. D, total RNAs were isolated from the indicated cells and were analyzed by RT-PCR using specific primers for PMP70, catalase, and GAPDH (a control).
FIGURE 11.
FIGURE 11.
Effect of NAPE-PLD expression on PLA/AT-2-H cells. PLA/AT-2-H cells were transfected with the insert-free vector (lane 2) or expression vector harboring mouse NAPE-PLD (lanes 3 and 4) and incubated in the absence (lanes 1–3) or presence (lane 4) of 0.2 μm URB597 as described under “Experimental Procedures” (A). Control HEK293 cells transfected only with the insert-free vector were also analyzed (lane 1). Homogenates (30 μg of protein) of cells were subjected to the NAPE-PLD assay with 100 μm N-[14C]palmitoyl-PE as substrate, and the resultant N-[14C]palmitoylethanolamine was separated by TLC (A). N-Palmitoylethanolamine-forming activity was quantified (mean values ± S.D. (error bars), n = 3) (B). For metabolic radiolabeling experiments, cells incubated with [14C]ethanolamine in the absence (lanes 1–3) or presence (lane 4) of 0.2 μm URB597, and their total lipids were separated by TLC (C). The relative radioactivities of NAPE and NAE are shown (mean values ± S.D. (error bars), n = 3) (D). Asterisks indicate significant differences from PLA/AT-2-H cells transfected with insert-free vector (p < 0.002). A and C, the positions of authentic compounds on the TLC plate are indicated. NPPE, N-palmitoyl-PE; NPE, N-palmitoylethanolamine.
FIGURE 12.
FIGURE 12.
Cotransfection of PLA/AT-2-H cells with NAPE-PLD and NAAA. Control HEK293 cells (lane 1), PLA/AT-2-H cells (lane 2), PLA/AT-2-H cells transiently expressing mouse NAPE-PLD (lane 3), and PLA/AT-2-H cells transiently expressing both mouse NAPE-PLD and human NAAA (lane 4) were subjected to the NAAA assay (A) or metabolic labeling with [14C]ethanolamine (B and C). Cell homogenates (30 μg of protein) were allowed to react with N-palmitoylethanolamine as described under “Experimental Procedures,” and NAE-hydrolyzing activity was quantified (mean values ± S.D. (error bars), n = 3) (A). Cells were radiolabeled with [14C]ethanolamine in the presence of 0.2 μm URB597, and their total lipids were separated by TLC (B). Relative radioactivities of NAE are shown (mean values ± S.D. (error bars), n = 3) (C). B, the positions of authentic compounds on the TLC plate are indicated. Asterisk indicates a significant difference (p < 0.001).
FIGURE 13.
FIGURE 13.
Effects of stimulators on NAPE biosynthesis in PLA/AT-2-H cells. PLA/AT-2-H cells were radiolabeled with [14C]ethanolamine and then treated with vehicle (Me2SO) (lane 1), 1 μm A23187 (lane 2), 10 μm forskolin (lane 3), or 1 μm PMA (lane 4) for 10 min at 37 °C. Total lipids were separated by TLC. NAPE and NAE levels of Me2SO-treated cells are normalized to 100%, respectively, and relative radioactivities are shown (mean values ± S.D. (error bars), n = 3).
FIGURE 14.
FIGURE 14.
LC-MS/MS analysis of N-acylated ethanolamine phospholipids in HeLa cells treated with siRNA against PLA/AT-2. HeLa cells were transfected with control siRNA (siControl) or PLA/AT-2 siRNAs (siPLA/AT-2–1 or -2). After 48 h, total RNAs were isolated and analyzed by RT-PCR using specific primers for the mRNAs of PLA/AT-2–4 and GAPDH (a control) (A). Various species of NAPEs (B) and pNAPEs (C) in HeLa cells treated with siControl (black), PLA/AT-2–1 (dark gray), or PLA/AT-2–2 (light gray) were analyzed by LC-MS/MS as described under “Experimental Procedures.” N-Heptadecanoyl-1,2-dipalmitoyl-PE was used as an internal standard. B, levels of pNAPEs were corrected based on the calibration line constructed with authentic N-heptadecanoyl-1-O-1′(Z)-octadecenyl-2-oleoyl-glycerophosphoethanolamine and N-heptadecanoyl-1,2-dipalmitoyl-PE. Results are shown as picomoles/mg of protein (mean values ± S.D., n = 3). Asterisks indicate significant differences from control cells (p < 0.05). R1CO+RNCO and R1(CH)2+RNCO represent the total number of carbon atoms and double bonds in sn-1 O-acyl (or sn-1 O-alkenyl) and N-acyl chains.

References

    1. Schmid H. H. O., Schmid P. C., Natarajan V. (1990) N-Acylated glycerophospholipids and their derivatives. Prog. Lipid Res. 29, 1–43 - PubMed
    1. Hansen H. S., Moesgaard B., Hansen H. H., Petersen G. (2000) N-Acylethanolamines and precursor phospholipids. Relation to cell injury. Chem. Phys. Lipids 108, 135–150 - PubMed
    1. Devane W. A., Hanus L., Breuer A., Pertwee R. G., Stevenson L. A., Griffin G., Gibson D., Mandelbaum A., Etinger A., Mechoulam R. (1992) Isolation and structure of a brain constituent that binds to the cannabinoid receptor. Science 258, 1946–1949 - PubMed
    1. Zygmunt P. M., Petersson J., Andersson D. A., Chuang H., Sørgård M., Di Marzo V., Julius D., Högestätt E. D. (1999) Vanilloid receptors on sensory nerves mediate the vasodilator action of anandamide. Nature 400, 452–457 - PubMed
    1. Calignano A., La Rana G., Giuffrida A., Piomelli D. (1998) Control of pain initiation by endogenous cannabinoids. Nature 394, 277–281 - PubMed

Publication types