. 2012 Jul 23;198(2):219-33.
doi: 10.1083/jcb.201202061.

Atg9 vesicles are an important membrane source during early steps of autophagosome formation

Affiliations

Atg9 vesicles are an important membrane source during early steps of autophagosome formation

Hayashi Yamamoto et al. J Cell Biol. .

Abstract

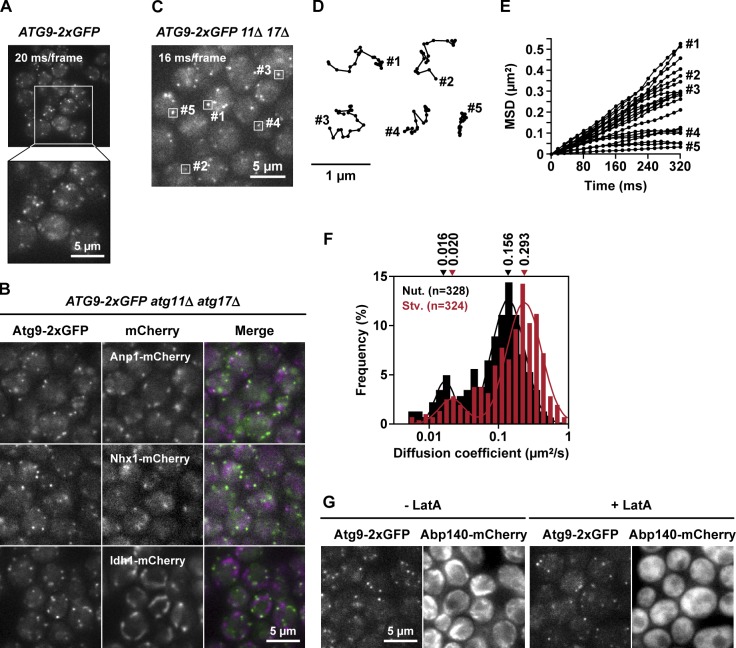
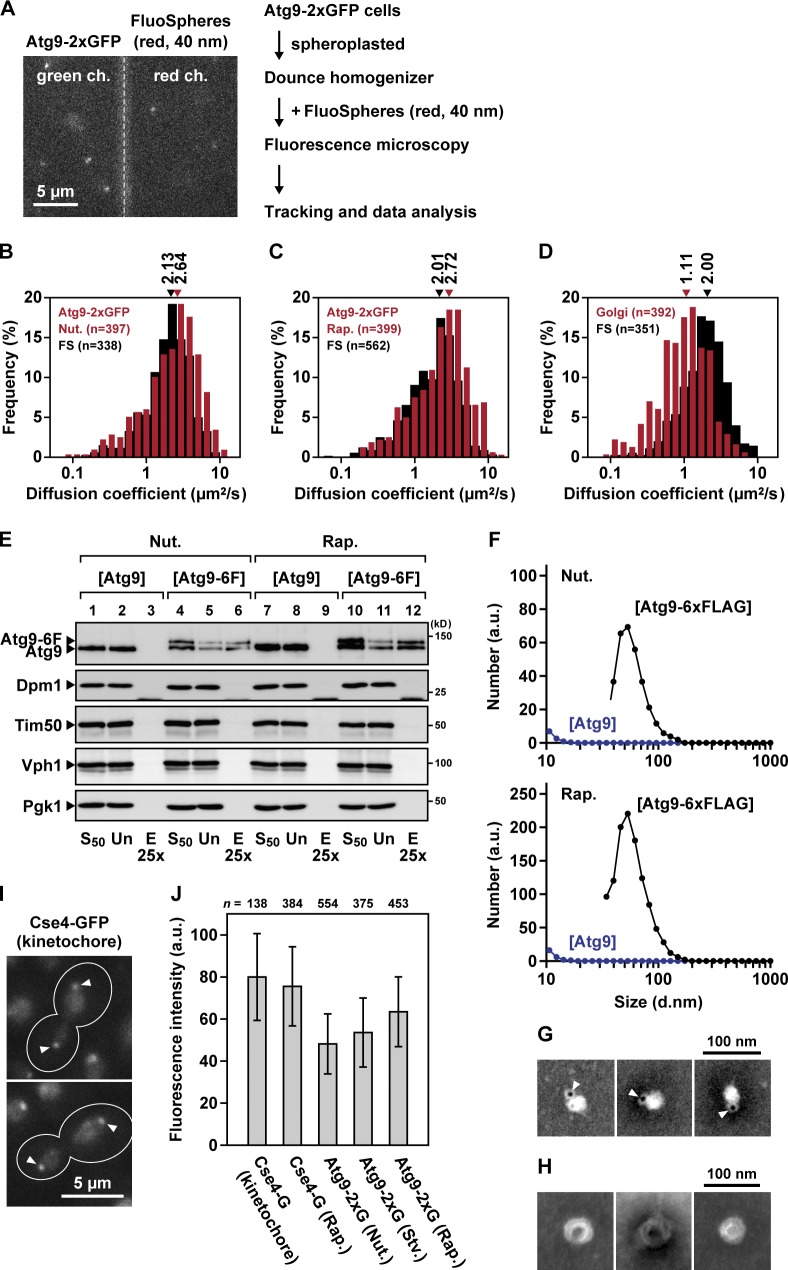
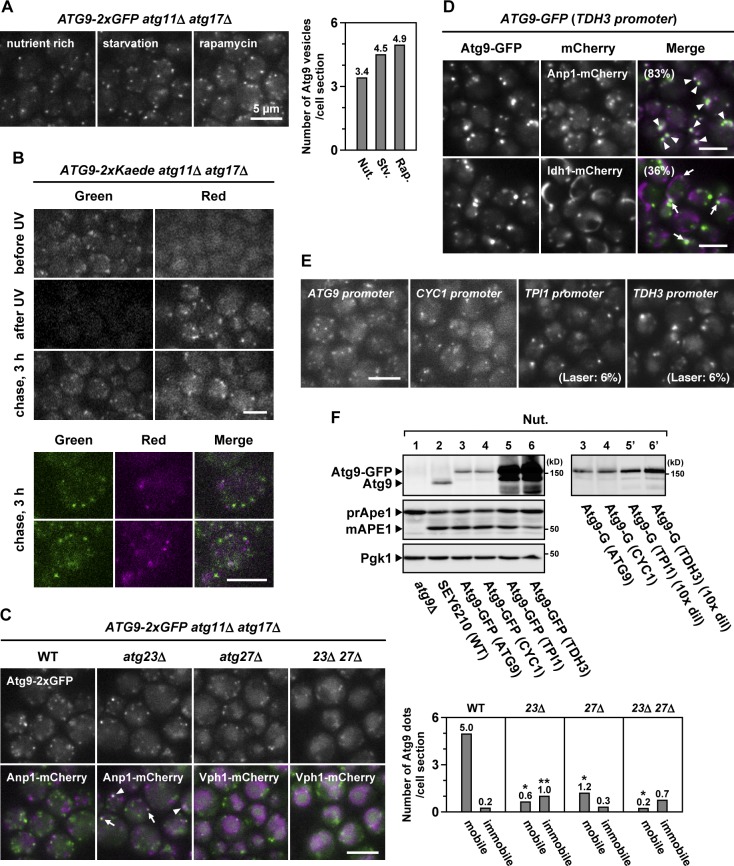
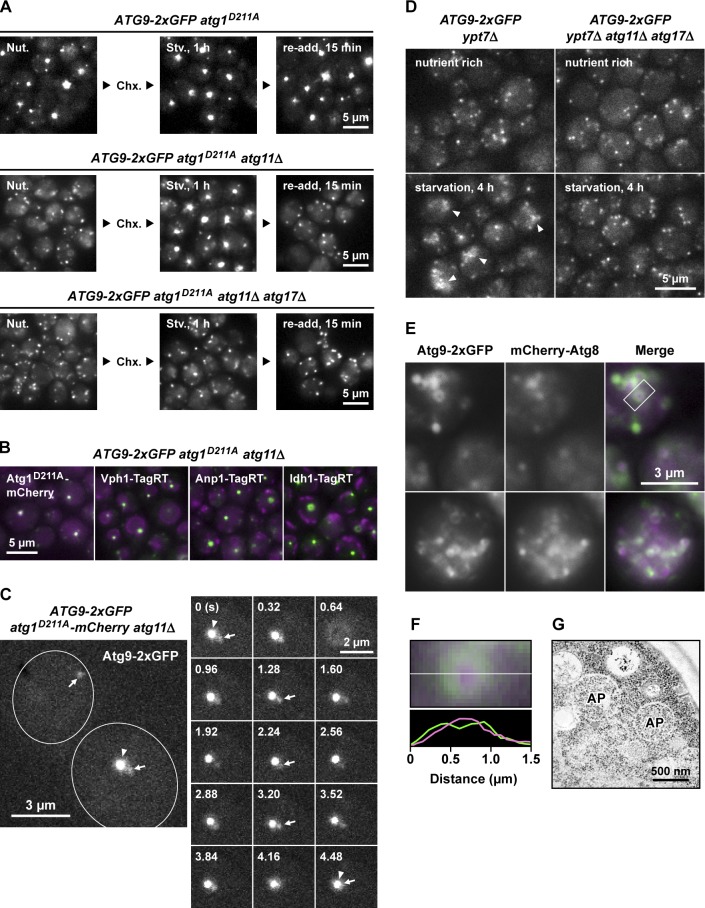
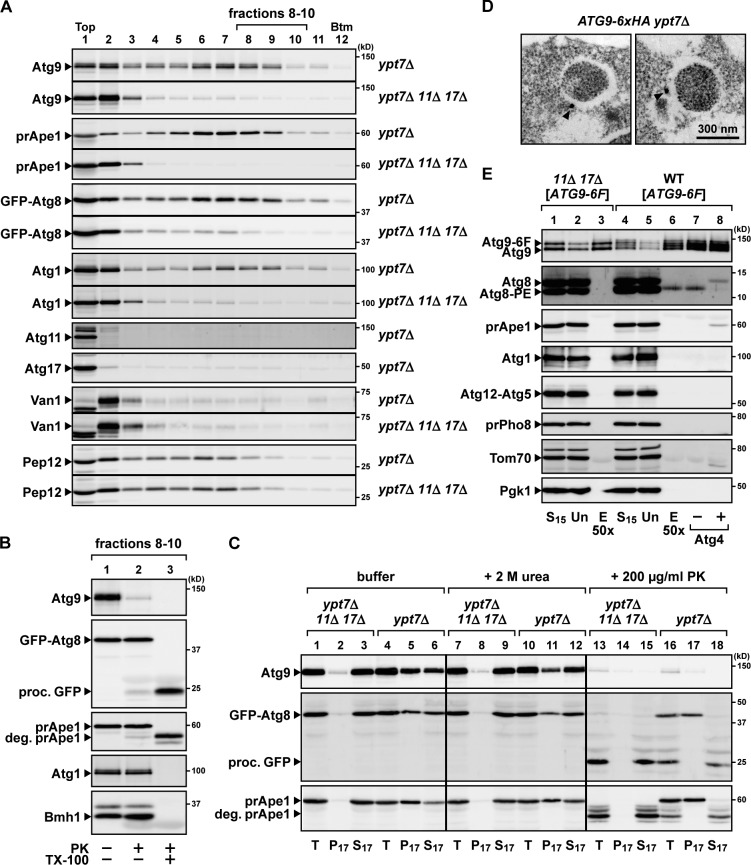
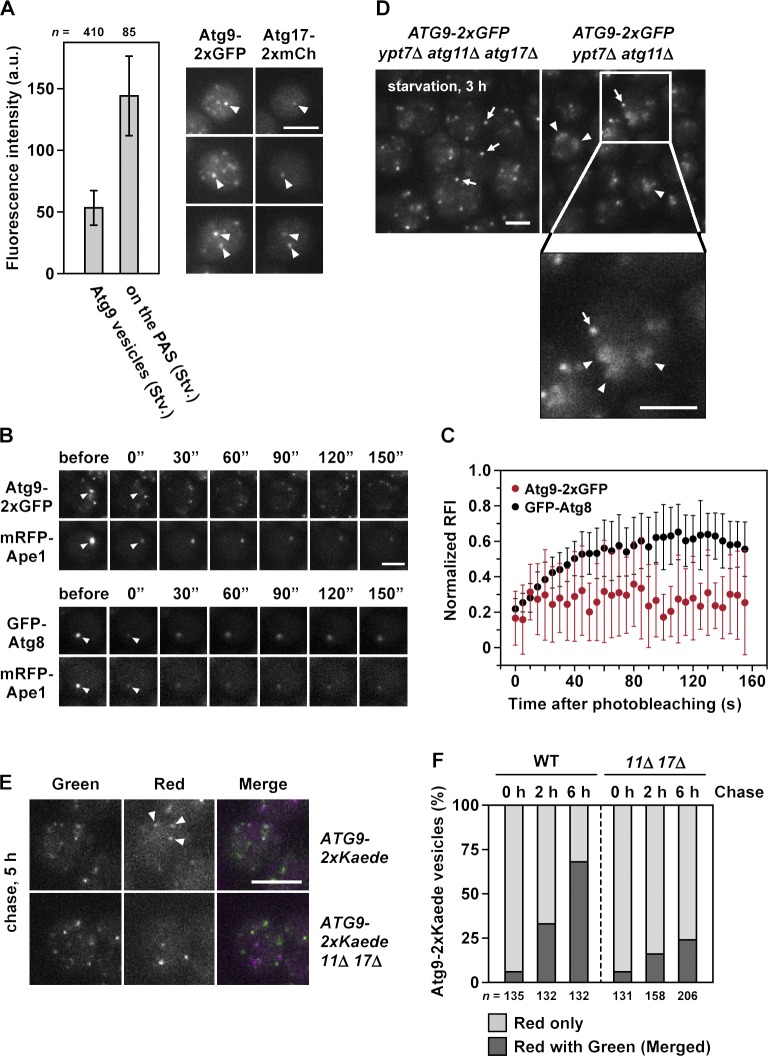
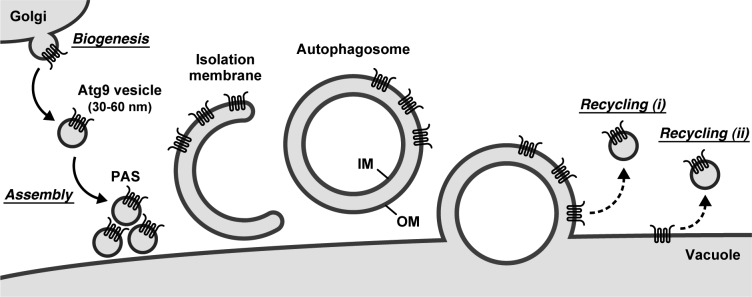
During the process of autophagy, cytoplasmic materials are sequestered by double-membrane structures, the autophagosomes, and then transported to a lytic compartment to be degraded. One of the most fundamental questions about autophagy involves the origin of the autophagosomal membranes. In this study, we focus on the intracellular dynamics of Atg9, a multispanning membrane protein essential for autophagosome formation in yeast. We found that the vast majority of Atg9 existed on cytoplasmic mobile vesicles (designated Atg9 vesicles) that were derived from the Golgi apparatus in a process involving Atg23 and Atg27. We also found that only a few Atg9 vesicles were required for a single round of autophagosome formation. During starvation, several Atg9 vesicles assembled individually into the preautophagosomal structure, and eventually, they are incorporated into the autophagosomal outer membrane. Our findings provide conclusive linkage between the cytoplasmic Atg9 vesicles and autophagosomal membranes and offer new insight into the requirement for Atg9 vesicles at the early step of autophagosome formation.


Figures

Figure 1.
Figure 1.
Atg9-containing structures are observed by high temporal resolution microscopy and analyzed by single-particle tracking. (A) ATG9-2×GFP cells were treated with rapamycin for 2 h and observed by fluorescence microscopy at 20 ms/frame (see also Video 1). Magnified view of the boxed area is shown. (B) ATG9-2×GFP atg11Δ atg17Δ cells were treated with rapamycin for 1 h and observed at 30 ms/frame. Anp1-mCherry (Golgi), Nhx1-mCherry (endosome), and Idh1-mCherry (mitochondria) were used as organelle markers. Green fluorescence and red fluorescence were acquired concurrently. (C) ATG9-2×GFP atg11Δ atg17Δ cells were observed at 16 ms/frame and subjected to single-particle tracking analysis. (D) Trajectories of the Atg9 puncta indicated in C. (E) 20 examples of the mean square displacement (MSD) curves calculated from traces of Atg9 puncta. (F) Histograms of the diffusion coefficients of the Atg9 puncta observed in cells grown to logarithmic phase (nutrient [Nut.]) or cells starved for 2 h (Stv.). The histograms were fitted to Gaussian distributions; medians of the fitting curves are indicated. The data shown are from a single representative experiment out of two repeats. (G) ATG9-2×GFP ABP140-mCherry cells were treated with 100 µg/ml latrunculin A (LatA) for 20 min and observed by fluorescence microscopy at 32 ms/frame (see also Video 2).
Figure 2.
Figure 2.
Atg9-containing structures are small single-membrane vesicles. (A) Mobility of Atg9 puncta in vitro. ATG9-2×GFP atg11Δ atg17Δ pep4Δ cells and ANP1-GFP atg11Δ atg17Δ pep4Δ cells were spheroplasted, ruptured with a Dounce homogenizer, and centrifuged at 15,000 g for 15 min. The supernatant fraction was mixed with 40-nm red FluoSpheres and then observed as in Fig. 1 C. Green fluorescence (green channel [ch.]) and red fluorescence (red channel [ch.]) were acquired concurrently. (B–D) Histograms of the diffusion coefficients of Atg9 puncta prepared from growing cells (B) or rapamycin-treated cells (C) and of the Golgi protein Anp1-GFP (D) are shown. FS, FluoSpheres. The mean size of the FluoSpheres used in this study was 44.1 nm (Fig. S1 D). The histograms were fitted to Gaussian distributions; medians of the fitting curves are indicated at the top. The data shown are from a single representative experiment out of three repeats. (E) Immunoisolation of Atg9-containing structures. atg11Δ atg17Δ pep4Δ cells expressing Atg9-6×FLAG were converted to spheroplasts (nutrient [Nut.]) and then treated with rapamycin for 2 h (Rap.). The spheroplasts were ruptured by passage through membrane filters with 5-µm pores. After a centrifugation at 50,000 g for 15 min, the supernatants (S50) were subjected to immunoisolation using the anti-FLAG antibody. The bound materials were eluted with 3×FLAG peptide and subjected to immunoblotting using antibodies against Atg9, Dpm1 (ER), Tim50 (mitochondria), Vph1 (vacuole), and Pgk1 (cytoplasm). Un, unbound fractions; E25×, eluted fractions concentrated 25-fold. (F) Size distribution profiles of the isolated Atg9-containing structures. The eluted fractions of E were subjected to DLS measurement. (G and H) Atg9-containing structures were immunoisolated from cells expressing both Atg9-6×FLAG and Atg9-3×BAP (3× biotinylated tag) and then subjected to negative staining EM. In G, the Atg9-containing structures were labeled with streptavidin-conjugated Qdots (Invitrogen). Arrowheads indicate Qdots. (I) CSE4-GFP cells were observed at 30 ms/frame. Arrowheads indicate kinetochore clusters consisting of ∼80 molecules of Cse4-GFP. Outlines indicate the edges of cells. (J) ATG9-2×GFP atg11Δ atg17Δ cells and CSE4-GFP cells were grown to logarithmic phase (nutrient) and then either starved for 2 h (Stv.) or treated with rapamycin for 2 h (Rap.). The fluorescence intensities of each GFP cluster (Atg9-2×GFP vesicle or Cse4-GFP kinetochore cluster) were quantified. Background signals of cytoplasmic regions were subtracted. The mean intensity of the Cse4-GFP kinetochore cluster is set to 80 U. Error bars indicate standard deviation. a.u., arbitrary unit.
Figure 3.
Figure 3.
Atg9 vesicles are generated de novo during starvation. (A) ATG9-2×GFP atg11Δ atg17Δ cells were either starved for 2 h or treated with rapamycin for 2 h. The number of Atg9 vesicles per cell section was counted. This experiment was completed once (n > 135). Nut., nutrient; Stv., starved; Rap., rapamycin. (B) ATG9-2×Kaede atg11Δ atg17Δ cells were treated with rapamycin for 1 h (before UV) and then irradiated with 365-nm UV (after UV). The cells were subjected to chase incubation for 3 h (chase, 3 h). (C) ATG9-2×GFP atg11Δ atg17Δ cells lacking Atg23 and/or Atg27 were treated with rapamycin for 3 h (see also Video 5). Anp1-mCherry (Golgi) and Vph1-mCherry (vacuole) were used as organelle markers. Arrowheads and arrows indicate Atg9-GFP clusters accumulated at and adjacent to the Golgi apparatus, respectively. The number of mobile Atg9 dots and immobile Atg9 dots per cell section was counted. This experiment was completed once (n > 250). Single asterisks indicate, in these mutant cells, very small mobile Atg9 dots that were observed but not counted. The double asterisk indicates, in atg23Δ cells, immobile Atg9 dots that were occasionally located at or adjacent to the Golgi apparatus (42%). (D) Cells expressing Atg9-GFP via the TDH3 promoter were observed at 32 ms/frame. Anp1-mCherry (Golgi) and Idh1-mCherry (mitochondria) were used as organelle markers. Arrowheads and arrows indicate immobile Atg9-GFP clusters adjacent to the Golgi apparatus and mitochondria, respectively. (E) Cells expressing Atg9-GFP via the ATG9 promoter, CYC1 promoter, TPI1 promoter, or TDH3 promoter were observed at 32 ms/frame (see also Video 6). When Atg9-GFP was expressed via the TPI1 promoter or TDH3 promoter, the excitation laser intensity was lowered to 6% with a neutral density filter. (F) Total cell lysates were prepared from the cells used in E and subjected to immunoblotting. Some samples were diluted 10-fold (10× dil). WT, wild type.
Figure 4.
Figure 4.
Atg9 localizes around the autophagosome in ypt7Δ cells. (A) ATG9-2×GFP atg1D211A cells (top), ATG9-2×GFP atg1D211A atg11Δ VPH1-TagRFPT cells (middle), and ATG9-2×GFP atg1D211A atg11Δ atg17Δ cells (bottom) were starved for 1 h (Stv., 1 h) in the presence of 1 mg/ml cycloheximide (Chx.). After starvation, nutrient-rich medium was added to the culture and incubated for 15 min (re-add, 15 min). Nut., nutrient. (B) ATG9-2×GFP atg1D211A atg11Δ cells were treated with rapamycin for 1 h. Atg1D211A-mCherry (PAS), Vph1-TagRFPT (vacuole), Anp1-TagRFPT (Golgi), and Idh1-TagRFPT (mitochondria) were used as organelle markers. The Atg9-2×GFP clusters observed in these cells represent the PAS (labeled with Atg1D211A-mCherry) but not clusters accumulated at the Golgi apparatus (labeled with Anp1-TagRFPT). (C) Cytoplasmic Atg9 vesicles individually assemble to the PAS. ATG9-2×GFP atg1D211A-mCherry atg11Δ cells were treated with rapamycin for 1 h and observed at 32 ms/frame (see also Video 8). Arrows and arrowheads indicate cytoplasmic mobile Atg9 vesicles and Atg9 clusters assembled at the PAS, respectively. Outlines indicate the edges of cells. (D) Intracellular behavior of Atg9-2×GFP is altered in a manner dependent on autophagosome formation. ATG9-2×GFP ypt7Δ cells and ATG9-2×GFP ypt7Δ atg11Δ atg17Δ cells were starved for 4 h and observed at 32 ms/frame (see also Video 9). Arrowheads indicate immobile Atg9-positive structures. (E) Atg9 localizes around the autophagosome. ATG9-2×GFP mCherry-Atg8 ypt7Δ atg11Δ cells were starved for 4 h and observed at 3,000 ms/frame. The rectangle indicates the autophagosome analyzed in F. (F) The autophagosome highlighted in E was analyzed using the line scan analysis function of MetaMorph software. (G) The cells used in E were starved for 4 h and subjected to EM. AP, autophagosomes.
Figure 5.
Figure 5.
Atg9 is embedded in the autophagosomal outer membrane. (A) Atg9 co-migrates with autophagosomes. ypt7Δ cells and ypt7Δ atg11Δ atg17Δ cells expressing GFP-Atg8 were converted to spheroplasts, treated with rapamycin for 5 h, and then ruptured by passage through a membrane filter with 5-µm pores. After removal of cell debris, the total lysates were loaded onto 8–30% (vol/vol) OptiPrep linear gradients and centrifuged at 200,000 g for 1 h. Van1 (Golgi) and Pep12 (endosome) were used as organelle markers. prApe1, a proform of Ape1; Btm, bottom. (B) Atg9 is exposed outside the autophagosomal membrane. After density gradient centrifugation, the autophagosome-enriched fractions (fractions 8–10 in A) were mixed, divided into three aliquots, and then treated with 100 µg/ml proteinase K (PK) for 20 min on ice with or without 0.3% Triton X-100 (TX-100). To exclude free Atg9 vesicles, fractions 8–10 were used as autophagosome-enriched fractions. proc. GFP, the processed form of GFP moiety; deg. prApe1, the degraded form of prApe1. (C) Total lysates were prepared as in A from ypt7Δ cells and ypt7Δ atg11Δ atg17Δ cells treated with rapamycin for 5 h. The total lysates (T) were either treated with 2 M urea or 200 µg/ml proteinase K for 20 min on ice or mock treated (buffer) and then separated into pellet (P17) and supernatant (S17) fractions by centrifugation at 17,400 g for 15 min. (D) ATG9-6×HA ypt7Δ cells were treated with rapamycin for 3 h and then subjected to pre-embedding immuno-EM using anti-HA antibody. Arrowheads indicate gold-enhanced NanoGold particles. (E) Wild-type (WT) cells and atg11Δ atg17Δ cells expressing Atg9-6×FLAG were converted to spheroplasts and treated with rapamycin for 2 h. Total lysates were prepared as in A. Total lysates were centrifuged at 15,000 g for 10 min; supernatant fractions (S15) were subjected to immunoisolation using the anti-FLAG antibody and eluted with the 3×FLAG peptide. The eluted fraction (lane 6) was treated with 1 µM recombinant Atg4 for 10 min at 30°C (lane 8) or mock treated (lane 7). Atg9-6F, Atg9-6×FLAG; prPho8, a proform of Pho8; Un, unbound fractions; E50×, eluted fractions concentrated 50-fold.
Figure 6.
Figure 6.
Only a small number of Atg9 vesicles are involved in a single round of autophagosome formation. (A) Wild-type cells expressing both Atg9-2×GFP and Atg17-2×mCherry were starved for 2 h and observed at 30 ms/frame. GFP fluorescence intensities of cytoplasmic mobile Atg9 vesicles and PAS-assembled Atg9 vesicles were quantitated as in Fig. 2 J. Error bars indicate standard deviation. Arrowheads indicate Atg9-2×GFP vesicles and Atg17-2×mCherry assembling at the PAS. a.u., arbitrary unit; Stv., starved. (B) FRAP analysis of Atg proteins at the PAS. ATG9-2×GFP mRFP-APE1 cells and GFP-ATG8 mRFP-APE1 cells were treated with rapamycin for 30 min and then subjected to FRAP analysis. Arrowheads indicate positions of photobleaching. (C) Quantitation of FRAP observations in B; normalized relative fluorescence intensities (RFI) after photobleaching of Atg9-2×GFP (n = 9) and GFP-Atg8 (n = 10). Error bars indicate standard deviation. (D) ypt7Δ atg11Δ cells and ypt7Δ atg11Δ atg17Δ cells expressing Atg9-2×GFP were starved for 3 h and observed at 30 ms/frame (see also Video 10). Arrows and arrowheads indicate cytoplasmic Atg9-2×GFP vesicles and Atg9-2×GFP clusters located on the autophagosomal membranes, respectively. (E) Multiple Atg9 vesicles are mixed during autophagy. Wild-type cells and atg11Δ atg17Δ cells expressing Atg9-2×Kaede were treated with rapamycin for 1 h. After UV irradiation (0 h), the cells were subjected to prolonged chase incubation for 2, 5, or 6 h. Arrowheads indicate Atg9-2×Kaede vesicles observed with both red and green fluorescence. (F) The number of mobile Atg9-2×Kaede vesicles observed with either red fluorescence alone or with both red and green fluorescence in E were counted. To exclude Atg9 signals colocalized at the PAS, immobile Atg9 puncta were not counted. The data shown are from a single representative experiment out of three repeats. WT, wild type. Bars: (A, D, and E) 5 µm; (B) 3 µm.
Figure 7.
Figure 7.
Involvement of Atg9-containing structures in the membrane dynamics of autophagy. Atg9 vesicles are derived from the Golgi apparatus as single-membrane structures with a diameter of 30–60 nm. During starvation, a small number of Atg9 vesicles assemble to the PAS to become part of the isolation membrane and ultimately part of the autophagosomal outer membrane. After autophagosome formation, Atg9 clusters remaining on the outer membrane are recycled back to the cytoplasm: (i) Atg9 vesicle recycling is coupled with fusion of the autophagosomal outer membrane with the vacuolar membrane; or (ii) the Atg9 vesicle is recycled from the vacuolar membrane (alternatively, Atg9 is translocated to the endosome or the Golgi apparatus by retrograde transport and generated via the Golgi-related secretory system as well as the biogenesis of Atg9 vesicles). The asymmetrical distribution of Atg9 on the outer membrane would allow Atg9 to avoid degradation and to be recycled back to the cytoplasm. IM and OM, autophagosomal inner and outer membranes, respectively.

Comment in

References

    1. Anderson C.M., Georgiou G.N., Morrison I.E., Stevenson G.V., Cherry R.J. 1992. Tracking of cell surface receptors by fluorescence digital imaging microscopy using a charge-coupled device camera. Low-density lipoprotein and influenza virus receptor mobility at 4 degrees C. J. Cell Sci. 101:415–425 - PubMed
    1. Babst M., Sato T.K., Banta L.M., Emr S.D. 1997. Endosomal transport function in yeast requires a novel AAA-type ATPase, Vps4p. EMBO J. 16:1820–1831 10.1093/emboj/16.8.1820 - DOI - PMC - PubMed
    1. Cheong H., Nair U., Geng J., Klionsky D.J. 2008. The Atg1 kinase complex is involved in the regulation of protein recruitment to initiate sequestering vesicle formation for nonspecific autophagy in Saccharomyces cerevisiae. Mol. Biol. Cell. 19:668–681 10.1091/mbc.E07-08-0826 - DOI - PMC - PubMed
    1. Coffman V.C., Wu P., Parthun M.R., Wu J.Q. 2011. CENP-A exceeds microtubule attachment sites in centromere clusters of both budding and fission yeast. J. Cell Biol. 195:563–572 10.1083/jcb.201106078 - DOI - PMC - PubMed
    1. Elsner M., Hashimoto H., Simpson J.C., Cassel D., Nilsson T., Weiss M. 2003. Spatiotemporal dynamics of the COPI vesicle machinery. EMBO Rep. 4:1000–1004 10.1038/sj.embor.embor942 - DOI - PMC - PubMed

Publication types

MeSH terms