. 2012 Aug 21;109(34):E2284-93.
doi: 10.1073/pnas.1202174109. Epub 2012 Jul 23.

Amino acid starvation induces reactivation of silenced transgenes and latent HIV-1 provirus via down-regulation of histone deacetylase 4 (HDAC4)

Affiliations

Amino acid starvation induces reactivation of silenced transgenes and latent HIV-1 provirus via down-regulation of histone deacetylase 4 (HDAC4)

Ilaria Palmisano et al. Proc Natl Acad Sci U S A. .

Abstract

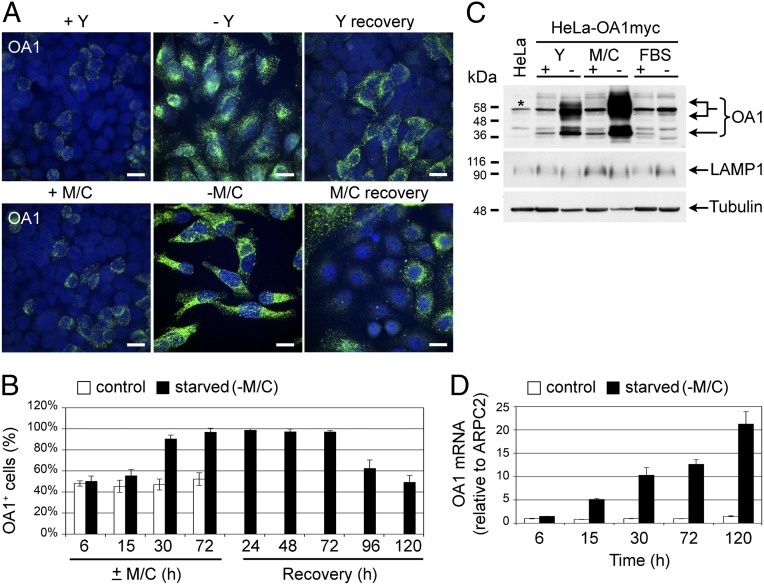
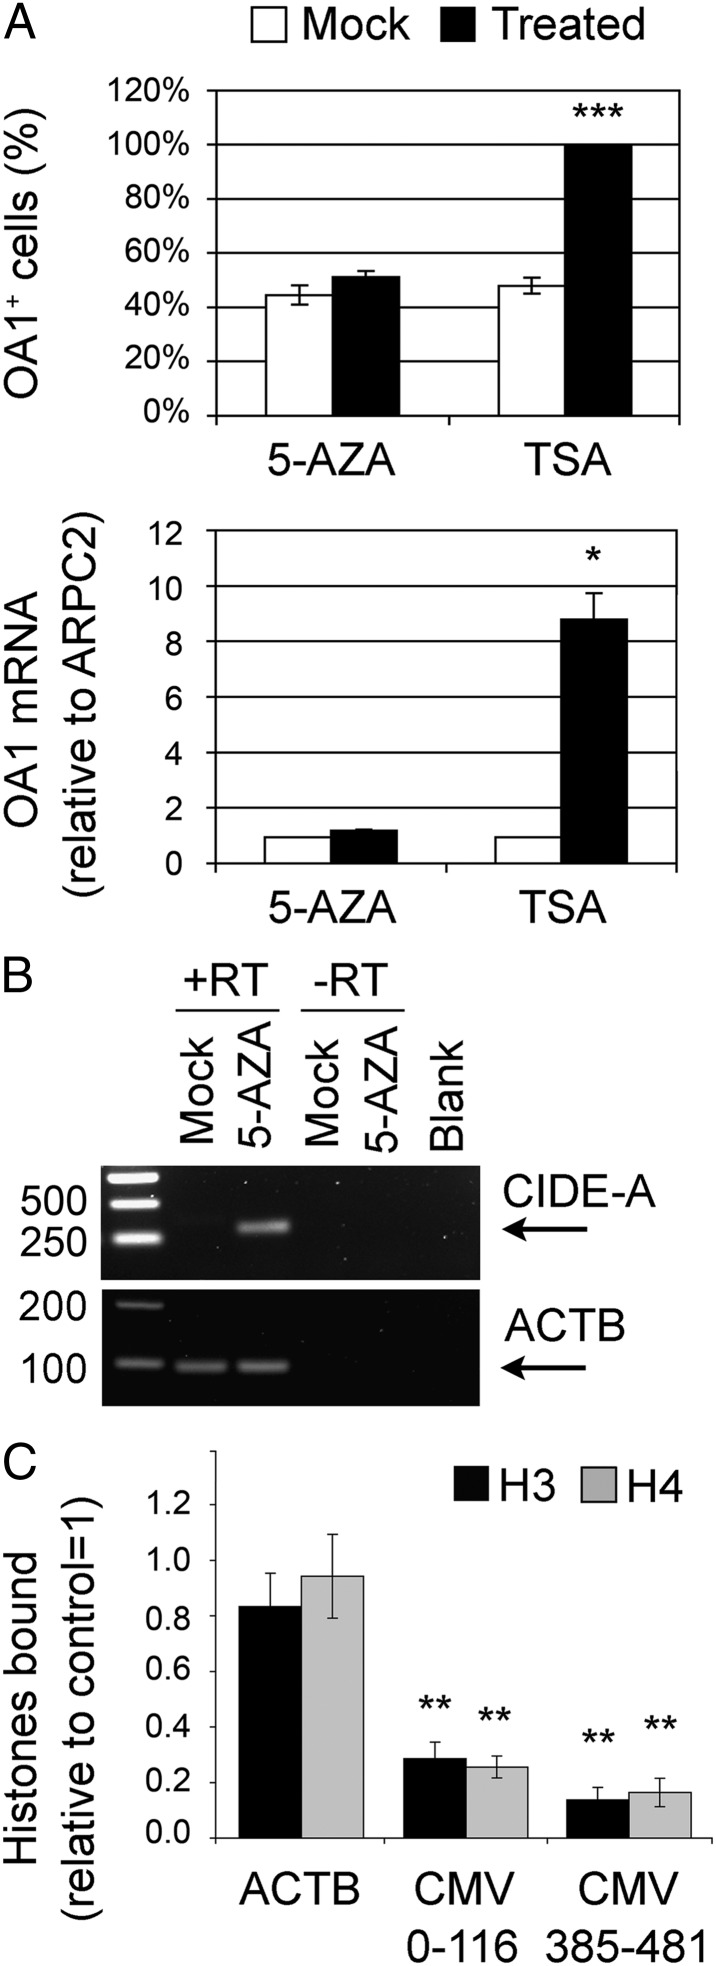
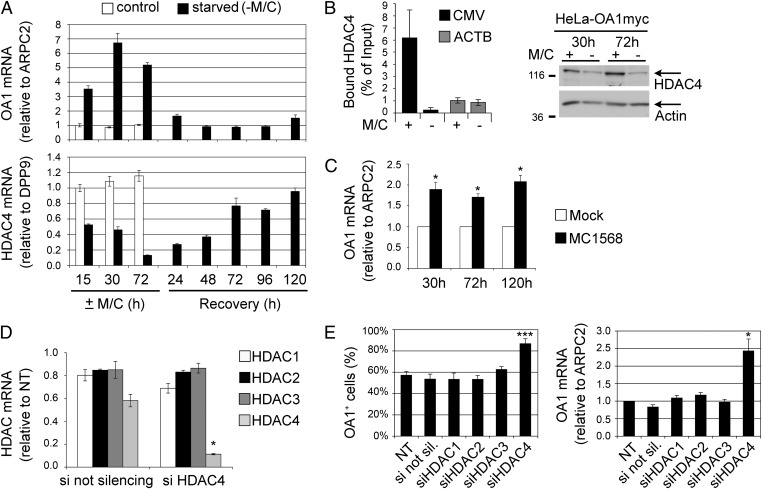
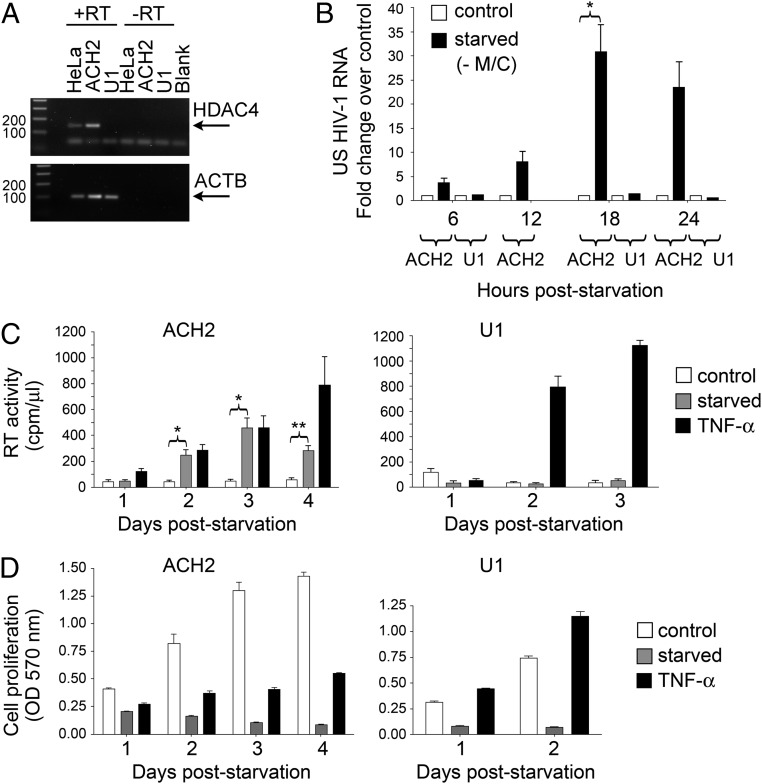
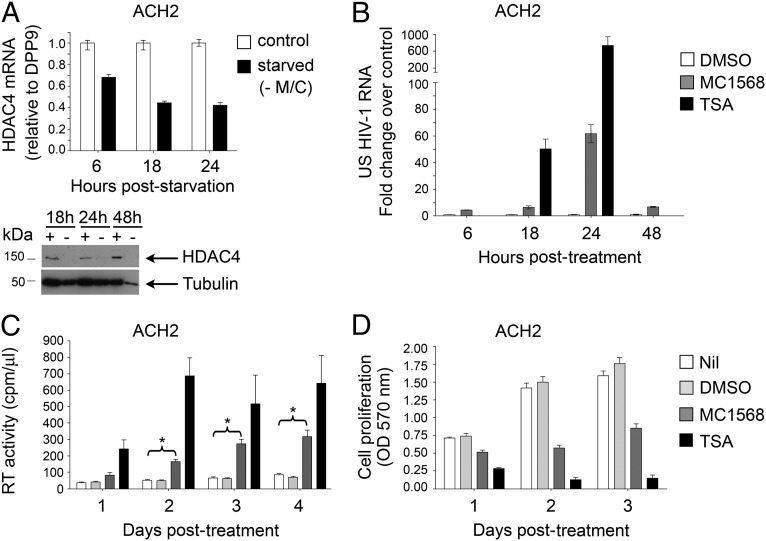
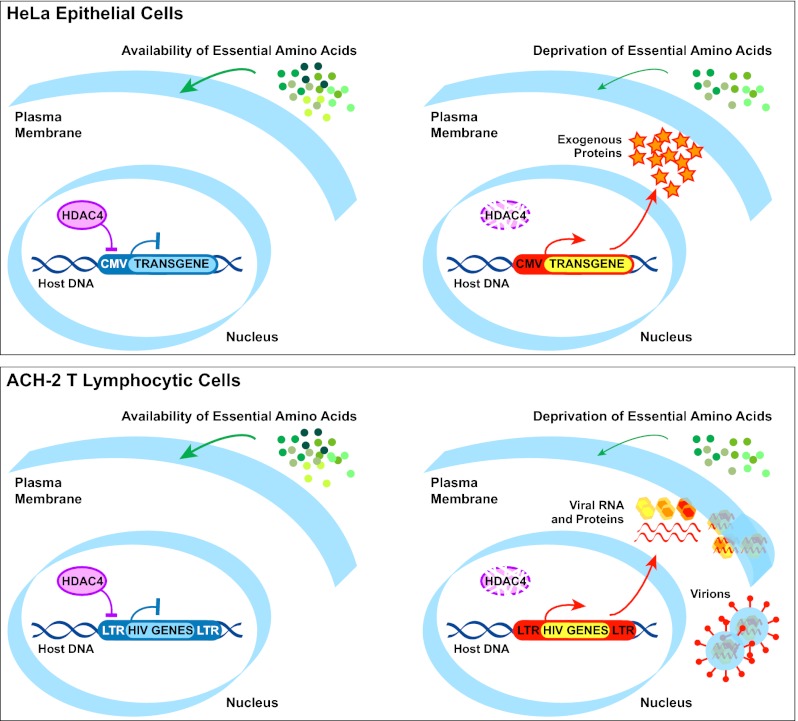
The epigenetic silencing of exogenous transcriptional units integrated into the genome represents a critical problem both for long-term gene therapy efficacy and for the eradication of latent viral infections. We report here that limitation of essential amino acids, such as methionine and cysteine, causes selective up-regulation of exogenous transgene expression in mammalian cells. Prolonged amino acid deprivation led to significant and reversible increase in the expression levels of stably integrated transgenes transcribed by means of viral or human promoters in HeLa cells. This phenomenon was mediated by epigenetic chromatin modifications, because histone deacetylase (HDAC) inhibitors reproduced starvation-induced transgene up-regulation, and transcriptome analysis, ChIP, and pharmacological and RNAi approaches revealed that a specific class II HDAC, namely HDAC4, plays a critical role in maintaining the silencing of exogenous transgenes. This mechanism was also operational in cells chronically infected with HIV-1, the etiological agent of AIDS, in a latency state. Indeed, both amino acid starvation and pharmacological inhibition of HDAC4 promoted reactivation of HIV-1 transcription and reverse transcriptase activity production in HDAC4(+) ACH-2 T-lymphocytic cells but not in HDAC4(-) U1 promonocytic cells. Thus, amino acid deprivation leads to transcriptional derepression of silenced transgenes, including integrated plasmids and retroviruses, by a process involving inactivation or down-regulation of HDAC4. These findings suggest that selective targeting of HDAC4 might represent a unique strategy for modulating the expression of therapeutic viral vectors, as well as that of integrated HIV-1 proviruses in latent reservoirs without significant cytotoxicity.


Conflict of interest statement

The authors declare no conflict of interest.

Figures

Fig. 1.
Fig. 1.
OA1 transgene expression is reversibly up-regulated by amino acid starvation. (A) IF analysis of HeLa cells stably transfected with an expression vector for mycHis-tagged OA1 and clonally selected (HeLa-OA1myc). Cells were cultured in the presence (+) or absence (−) of Y or M/C for 5 d, followed by 5 d of recovery, and were then fixed and stained with anti-OA1 Ab (green) and Hoechst (blue). Both the intensity of the OA1 staining per cell and the number of OA1-expressing cells increase dramatically on starvation and decline on recovery. (Scale bars: 20 μm.) (B) Quantification of OA1-expressing cells in the HeLa-OA1myc population at the indicated times of M/C starvation and recovery. Results are expressed as a percentage of OA1+ cells of the total (mean ± SD of 5 random fields from 1 experiment representative of 4). (C) Immunoblotting of HeLa-OA1myc cell lysates after 5 d of culture in the presence (+) or absence (−) of Y, M/C, or FBS in the medium and decorated with specified Abs. Cell lysate from nontransfected HeLa cells not expressing OA1 serves as a negative control for the anti-OA1 Ab specificity (first lane). Note the huge accumulation of OA1 on amino acid but not FBS starvation compared with endogenous LAMP1 and tubulin. *Nonspecific product recognized by the anti-OA1 Ab. (D) Quantification of OA1 mRNA expression by real-time PCR in HeLa-OA1myc cells at the indicated times of M/C starvation. Data are expressed as the fold change compared with the amount of OA1 mRNA at 6 h in control conditions (mean ± SD of 3 technical replicates from 1 experiment representative of 3–4).
Fig. 2.
Fig. 2.
Transgene up-regulation on starvation is reproduced by HDACi and is associated with histone displacement. (A) Assessment of OA1 expression in HeLa-OA1myc cells following treatment with TSA (pan-HDACi) for 15 h or with 5-AZA (DNA methylation inhibitor) for 72 h. (Upper) IF quantification of OA1-expressing cells, presented as a percentage of the total (mean ± SEM of 5 independent experiments; ***P < 0.001, paired two-tailed Student t test vs. mock). (Lower) Real-time PCR quantification of OA1 mRNA levels expressed as the fold change compared with the amount of OA1 mRNA in mock conditions (mean ± SEM of 3 independent experiments; *P < 0.05, paired two-tailed Student t test vs. mock). ARPC2, actin-related protein 2/3 complex, subunit 2. (B) PCR analysis of CIDE-A expression and ACTB in mock- and 5-AZA–treated cells to confirm treatment efficacy. Blank, amplification in the absence of template. (C) Quantification of histones H3 and H4 bound to the ACTB and CMV promoters after 30 h of M/C starvation relative to control conditions, as obtained by ChIP and real-time PCR analysis. Two pairs of primers were used for the CMV promoter, amplifying regions 0–116 and 385–481 (CMV total length = 654 bp). Data are normalized to the input DNA and expressed as the fold change vs. control (mean ± SEM of 3 independent experiments; **P < 0.01, paired two-tailed Student t test vs. control). The amount of H3 and H4 associated with both regions of the CMV promoter is significantly reduced after starvation.
Fig. 3.
Fig. 3.
HDAC4 and OA1 expression correlate inversely during starvation, and HDAC4 inhibition or knockdown leads to OA1 transgene up-regulation. (A) Quantification of OA1 (Upper) and HDAC4 (Lower) mRNA expression by real-time PCR in HeLa-OA1myc cells at the indicated times of M/C starvation and recovery. Data are expressed as the fold change compared with the amount of the examined mRNA at 15 h in control conditions (mean ± SD of 3 technical replicates of 1 experiment representative of 3–4). Note the opposite trend of OA1 up-regulation and HDAC4 down-regulation. ARPC2, actin-related protein 2/3 complex, subunit 2. (B) Quantification of HDAC4 bound to the CMV (region 385–481) and ACTB promoters of HeLa-OA1myc cells after 30 h of M/C starvation relative to control conditions, as obtained by ChIP and real-time PCR analysis. Values were normalized to those obtained with rabbit IgG and expressed as a percentage of the input DNA (mean ± SEM of 2–3 independent experiments). HDAC4 is associated with the CMV promoter but not ACTB promoter in a starvation-sensitive manner. (Right) Immunoblotting analysis of HDAC4 protein levels after the indicated times of culture in the presence (+) or absence (−) of M/C. Actin was used as a loading control. (C) Quantification of OA1 mRNA expression by real-time PCR in HeLa-OA1myc cells at the indicated times of incubation with MC1568 (class II HDACi). Data are expressed as the fold change compared with the amount of the OA1 mRNA in mock conditions at each time point (mean ± SEM of 3 independent experiments; *P < 0.05, paired two-tailed Student t test vs. mock). (D) Quantification of HDAC1, HDAC2, HDAC3, and HDAC4 mRNA levels by real-time PCR following HDAC4 silencing (siHDAC4) compared with the not silencing siRNA (si not silencing). Data are expressed as the fold change compared with the amount of the examined mRNA in nontransfected cells (NT = 1; mean ± SEM of 3 independent experiments; *P < 0.05, paired two-tailed Student t test vs. the not silencing siRNA). (E) Assessment of OA1 expression in HeLa-OA1myc cells analyzed 72 h after transfection with the indicated siRNAs against different HDACs. (Left) IF quantification of OA1-expressing cells, presented as a percentage of the total (mean ± SEM of 4 independent experiments; ***P < 0.001, paired two-tailed Student t test vs. nontransfected cells). si not sil., siRNA not silencing. (Right) Real-time PCR quantification of OA1 mRNA levels expressed as the fold change compared with the amount of the OA1 mRNA in nontransfected cells (mean ± SEM of 5 independent experiments; *P < 0.05, paired two-tailed Student t test vs. nontransfected cells). Note that up-regulation of OA1 is obtained by HDAC4 silencing only.
Fig. 4.
Fig. 4.
M/C starvation reactivates dormant HIV-1 provirus in HDAC4+ ACH-2 cells but not in HDAC4 U1 cells. (A) PCR amplification of HDAC4 and ACTB transcripts in HeLa, ACH-2, and U1 cells; HDAC4 is detected in ACH-2 cells but not in U1 cells. Blank, amplification in the absence of template. (B) Real-time PCR quantification of US HIV-1 RNA in ACH-2 and U1 cells cultivated in the presence (control) or absence of M/C for the indicated times. Results are expressed as the fold change vs. the amount of HIV-1 RNA in control conditions at each time point (mean ± SEM of 2–4 independent experiments; *P < 0.05, paired two-tailed Student t test vs. control cells). HIV-1 RNA expression was significantly up-regulated in starved ACH-2 cells but not in U1 cells. (C) RT activity of daily collected supernatants from ACH-2 and U1 cells cultivated up to 4 d in control medium in the absence of M/C (starved) or presence of TNF-α (mean ± SEM of 5 independent experiments for ACH-2 or 2 independent experiments for U1; *P < 0.05 and **P < 0.01, paired two-tailed Student t test vs. control cells). RT activity accumulation after M/C starvation was observed in ACH-2 cells only. (D) 3-(4,5-Dimethylthiazol-2-yl)-2,5-diphenyltetrazolium bromide assay performed on daily collected supernatants from ACH-2 or U1 cells cultured as described in C (mean ± SEM of 3 technical replicates of 1 experiment representative of 3 for ACH-2 or 2 for U1). M/C starvation affects viability and proliferation of ACH-2 and U1 cells to a comparable extent.
Fig. 5.
Fig. 5.
HDAC4 is down-regulated during starvation, and its inhibition leads to HIV-1 reactivation in ACH-2 cells. (A) Real-time PCR quantification of HDAC4 mRNA expression in ACH-2 cells in control medium or after M/C deprivation (starved) at the indicated times. The results are expressed as the fold change vs. control at each time point (mean ± SEM of 3 technical replicates of 1 experiment representative of 3). (Lower) Immunoblotting analysis of HDAC4 protein levels on whole-cell lysates extracted from ACH-2 cells cultivated in the presence (+) or absence (−) of M/C at the indicated times. Antitubulin Ab was used as a loading control. (B) Real-time PCR quantification of US HIV-1 RNA in ACH-2 cells incubated with DMSO (mock of MC1568), MC1568, or TSA at the reported times. Results are expressed as the fold change vs. the amount of US HIV-1 RNA in DMSO conditions at each time point (mean ± SEM of 3 technical replicates of 1 experiment representative of 3). MC1568, as well as the more potent TSA induced HIV-1 RNA transcription. (C) RT activity of daily collected supernatants from ACH-2 cells incubated with standard medium (Nil), DMSO, MC1568, or TSA for 4 d (mean ± SEM of 3 independent experiments; *P < 0.05, paired two-tailed Student t test vs. control). (D) 3-(4,5-Dimethylthiazol-2-yl)-2,5-diphenyltetrazolium bromide assay for cell viability and proliferation of daily collected supernatants from ACH-2 cells incubated for 3 d as described in C (mean ± SEM of 3 independent experiments).
Fig. P1.
Fig. P1.
In HeLa or ACH2 cells, which carry silenced transgenes or HIV-1 proviruses integrated into the genome, respectively, our data suggest a direct or indirect (by recruitment of other factors) role for HDAC4 in repressing transcription from exogenous viral (or human) promoters. On deprivation of essential amino acids, a cell response is activated and promotes the down-regulation of HDAC4, with consequent transcriptional induction of the transgenes or the HIV-1 provirus. This reactivation is also induced by targeting HDAC4 by means of pharmacological inhibitors or RNAi. CMV, CMV promoter; LTR, retroviral LTR promoter.

Comment in

References

    1. Kilberg MS, Pan YX, Chen H, Leung-Pineda V. Nutritional control of gene expression: How mammalian cells respond to amino acid limitation. Annu Rev Nutr. 2005;25:59–85. - PMC - PubMed
    1. Margueron R, Reinberg D. Chromatin structure and the inheritance of epigenetic information. Nat Rev Genet. 2010;11:285–296. - PMC - PubMed
    1. Haberland M, Montgomery RL, Olson EN. The many roles of histone deacetylases in development and physiology: Implications for disease and therapy. Nat Rev Genet. 2009;10:32–42. - PMC - PubMed
    1. Lahm A, et al. Unraveling the hidden catalytic activity of vertebrate class IIa histone deacetylases. Proc Natl Acad Sci USA. 2007;104:17335–17340. - PMC - PubMed
    1. Fischle W, et al. Enzymatic activity associated with class II HDACs is dependent on a multiprotein complex containing HDAC3 and SMRT/N-CoR. Mol Cell. 2002;9:45–57. - PubMed

Publication types

MeSH terms

Supplementary concepts

Associated data