Developed and developing world responsibilities for historical climate change and CO2 mitigation
- PMID: 22826257
- PMCID: PMC3420160
- DOI: 10.1073/pnas.1203282109
Developed and developing world responsibilities for historical climate change and CO2 mitigation
Abstract
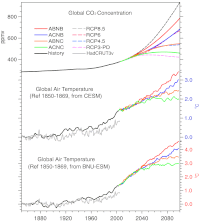
At the United Nations Framework Convention on Climate Change Conference in Cancun, in November 2010, the Heads of State reached an agreement on the aim of limiting the global temperature rise to 2 °C relative to preindustrial levels. They recognized that long-term future warming is primarily constrained by cumulative anthropogenic greenhouse gas emissions, that deep cuts in global emissions are required, and that action based on equity must be taken to meet this objective. However, negotiations on emission reduction among countries are increasingly fraught with difficulty, partly because of arguments about the responsibility for the ongoing temperature rise. Simulations with two earth-system models (NCAR/CESM and BNU-ESM) demonstrate that developed countries had contributed about 60-80%, developing countries about 20-40%, to the global temperature rise, upper ocean warming, and sea-ice reduction by 2005. Enacting pledges made at Cancun with continuation to 2100 leads to a reduction in global temperature rise relative to business as usual with a 1/3-2/3 (CESM 33-67%, BNU-ESM 35-65%) contribution from developed and developing countries, respectively. To prevent a temperature rise by 2 °C or more in 2100, it is necessary to fill the gap with more ambitious mitigation efforts.
Conflict of interest statement
The authors declare no conflict of interest.
Figures


References
-
- Barnett T, et al. Detecting and attributing external influences on the climate system: A review of recent advances. J Clim. 2005;18:1291–1314.
-
- Gillett NP, Zwiers FW, Weaver AJ, Stott PA. Detection of human influence on sea-level pressure. Nature. 2002;88:292–294. - PubMed
-
- Santer BD. Contributions of anthropogenic and natural forcing to recent tropopause height changes. Science. 2003;301:479–483. - PubMed
-
- Zhang X, et al. Detection of human influence on twentieth-century precipitation trends. Nature. 2007;448:461–465. - PubMed
-
- Barnett TP, et al. Penetration of human-induced warming into the world’s oceans. Science. 2005;309:284–287. - PubMed
Publication types
MeSH terms
Substances
LinkOut - more resources
Full Text Sources
Medical
Miscellaneous

