. 2012 Sep 1;189(5):2151-8.
doi: 10.4049/jimmunol.1103741. Epub 2012 Jul 23.

Inhibition of mechanistic target of rapamycin promotes dendritic cell activation and enhances therapeutic autologous vaccination in mice

Affiliations

Inhibition of mechanistic target of rapamycin promotes dendritic cell activation and enhances therapeutic autologous vaccination in mice

Eyal Amiel et al. J Immunol. .

Abstract

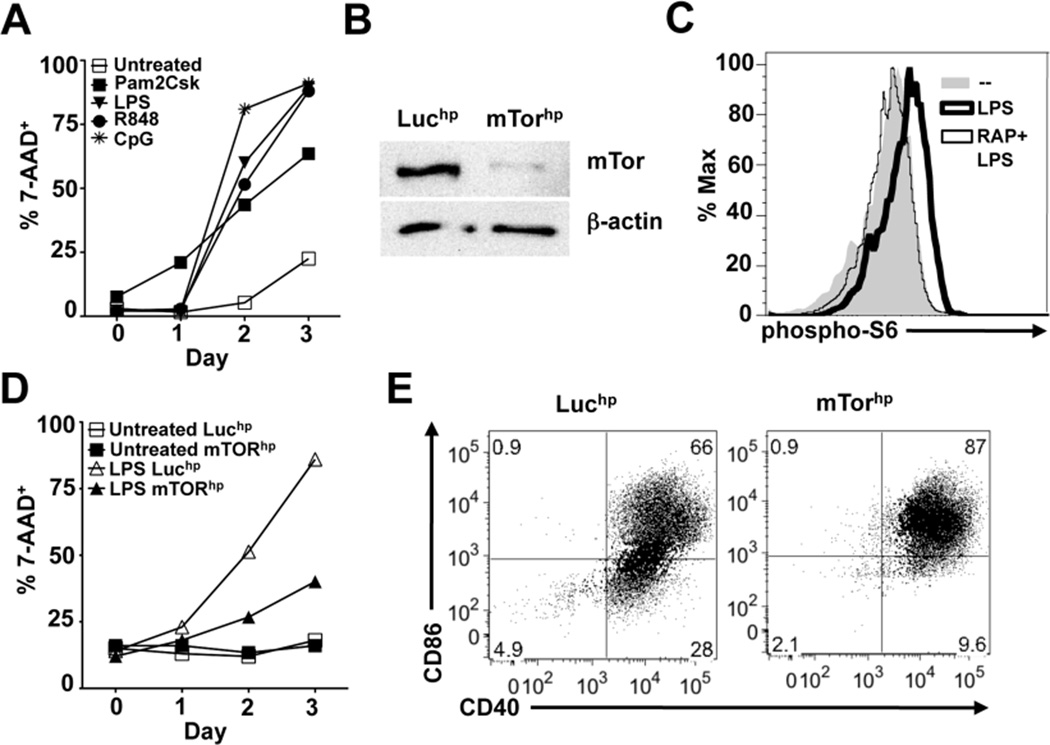
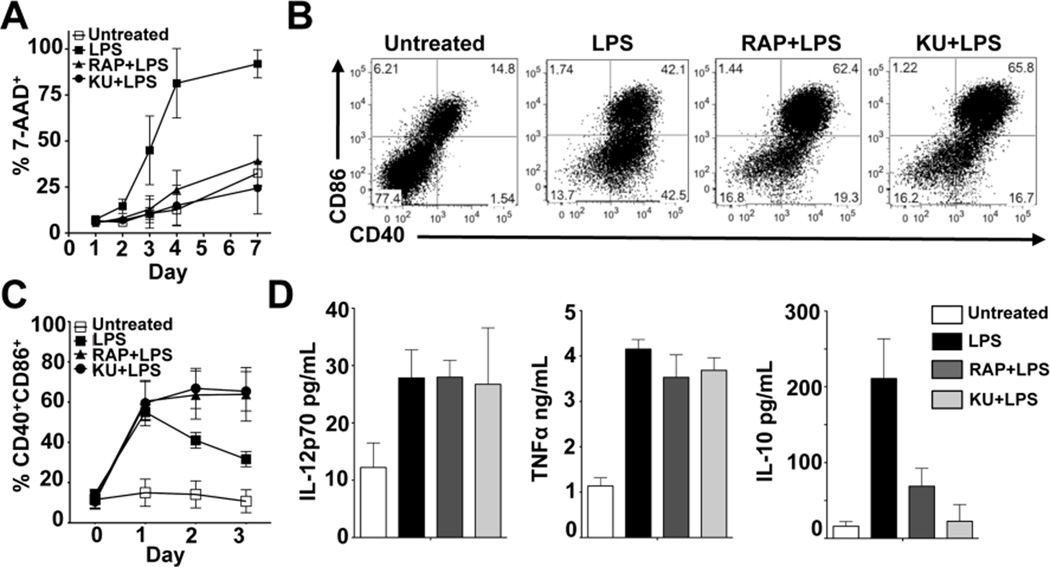
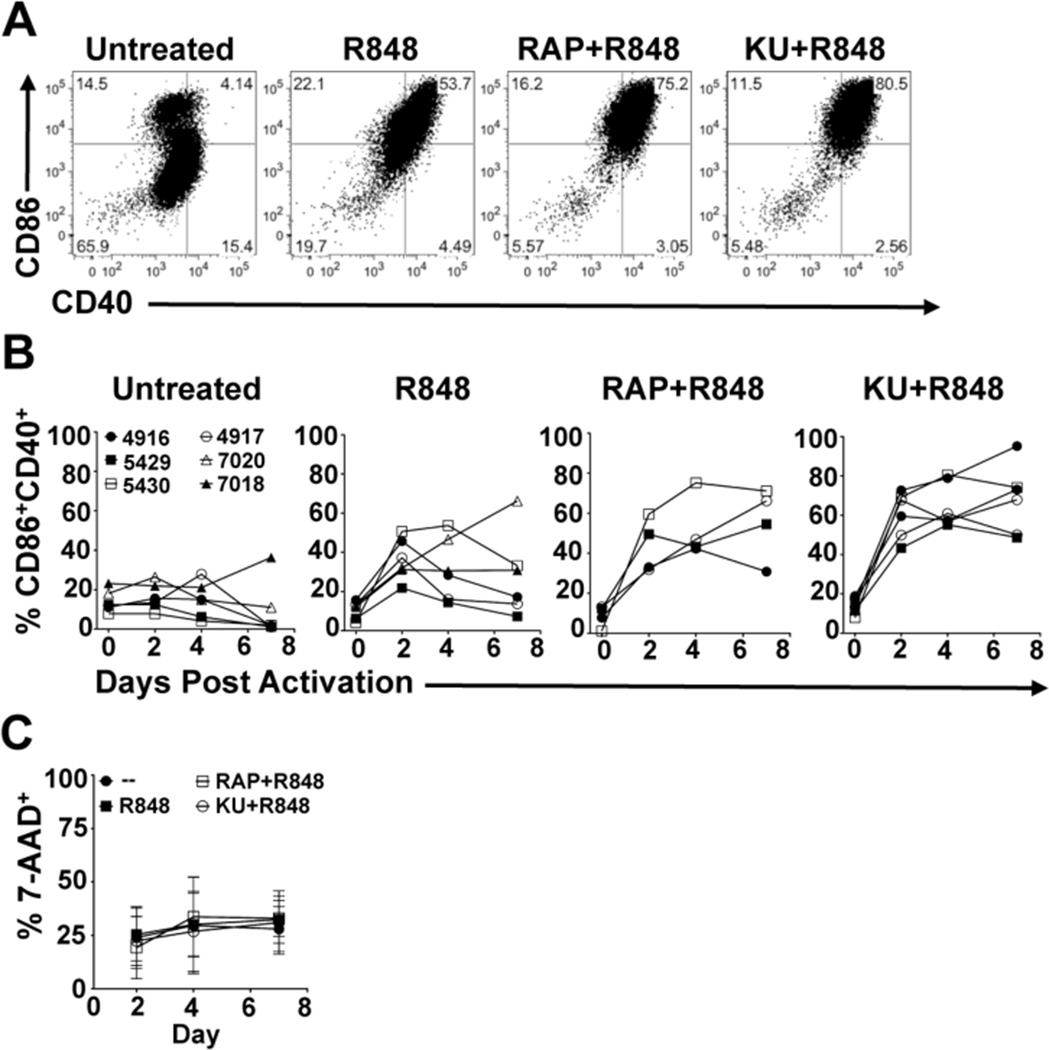
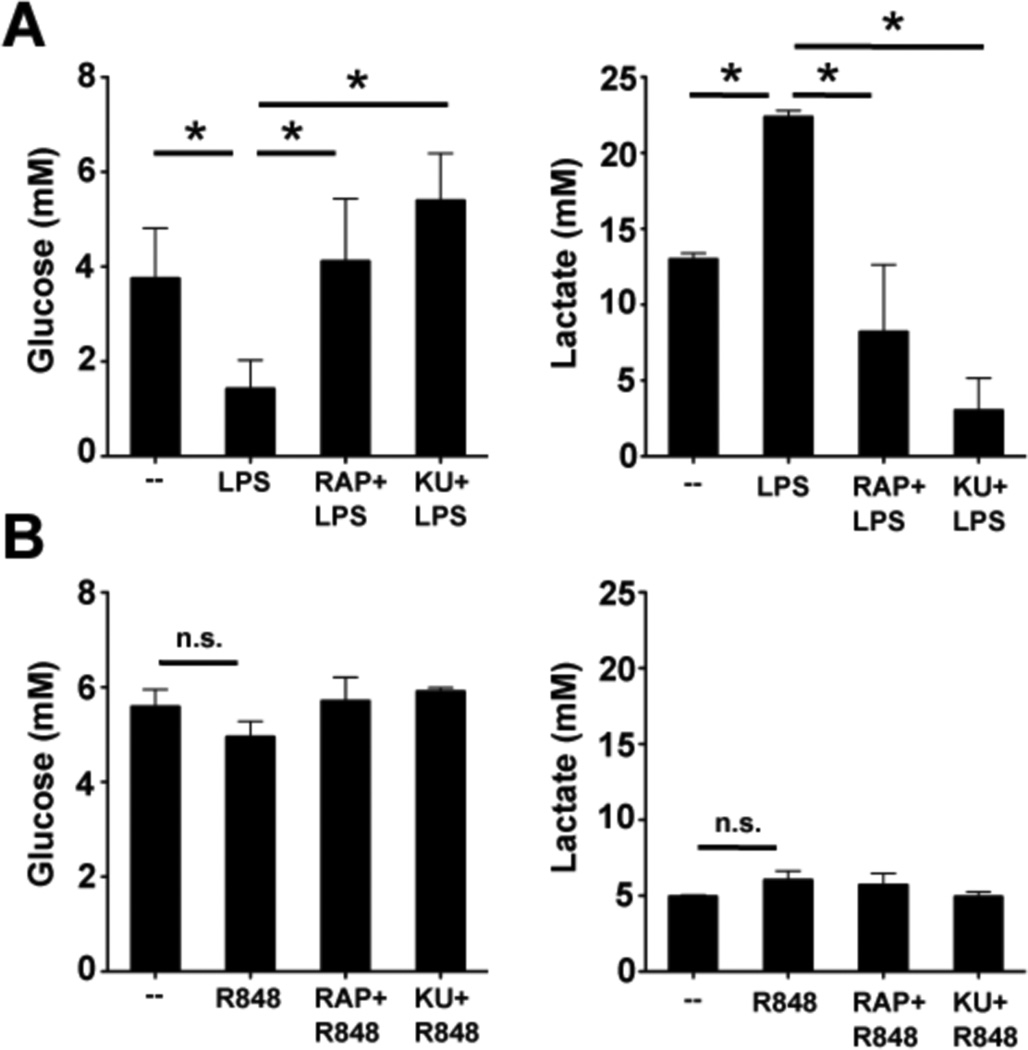
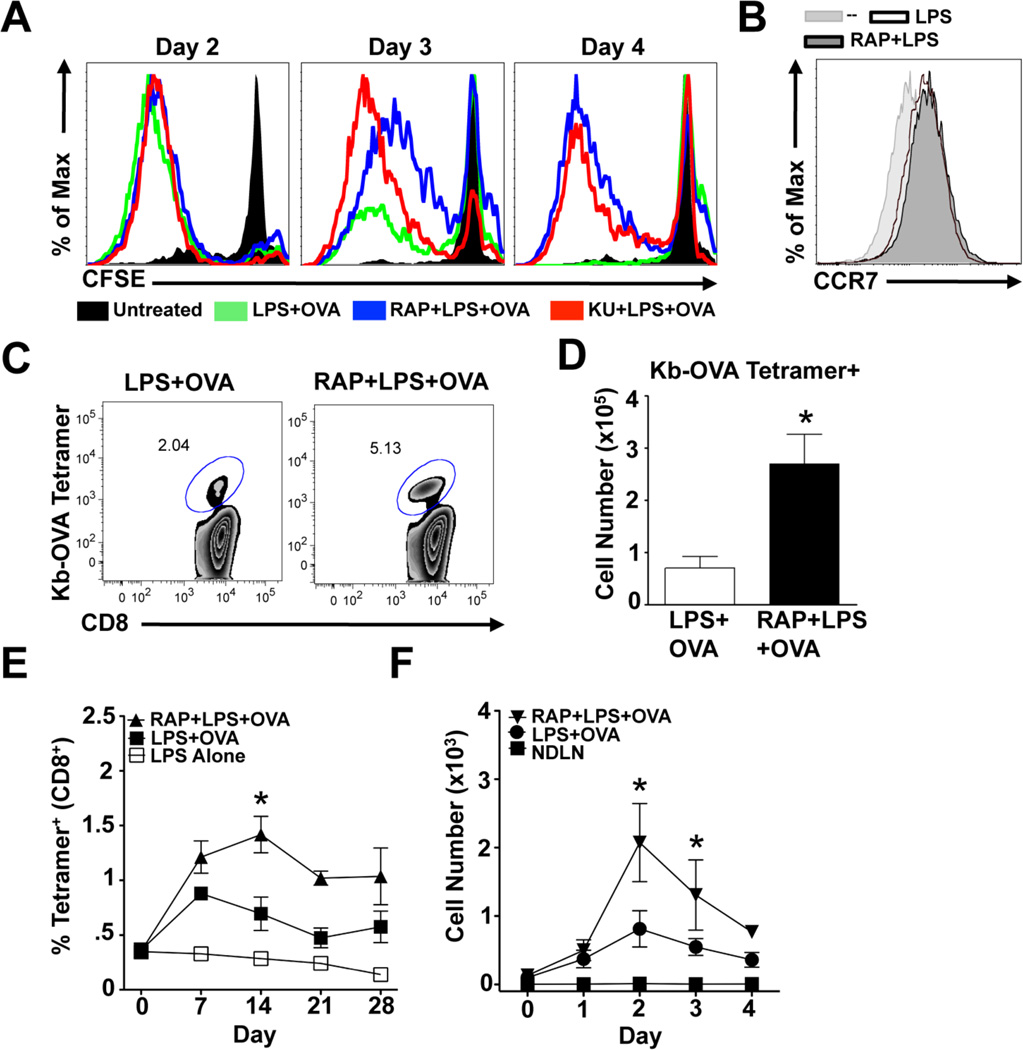
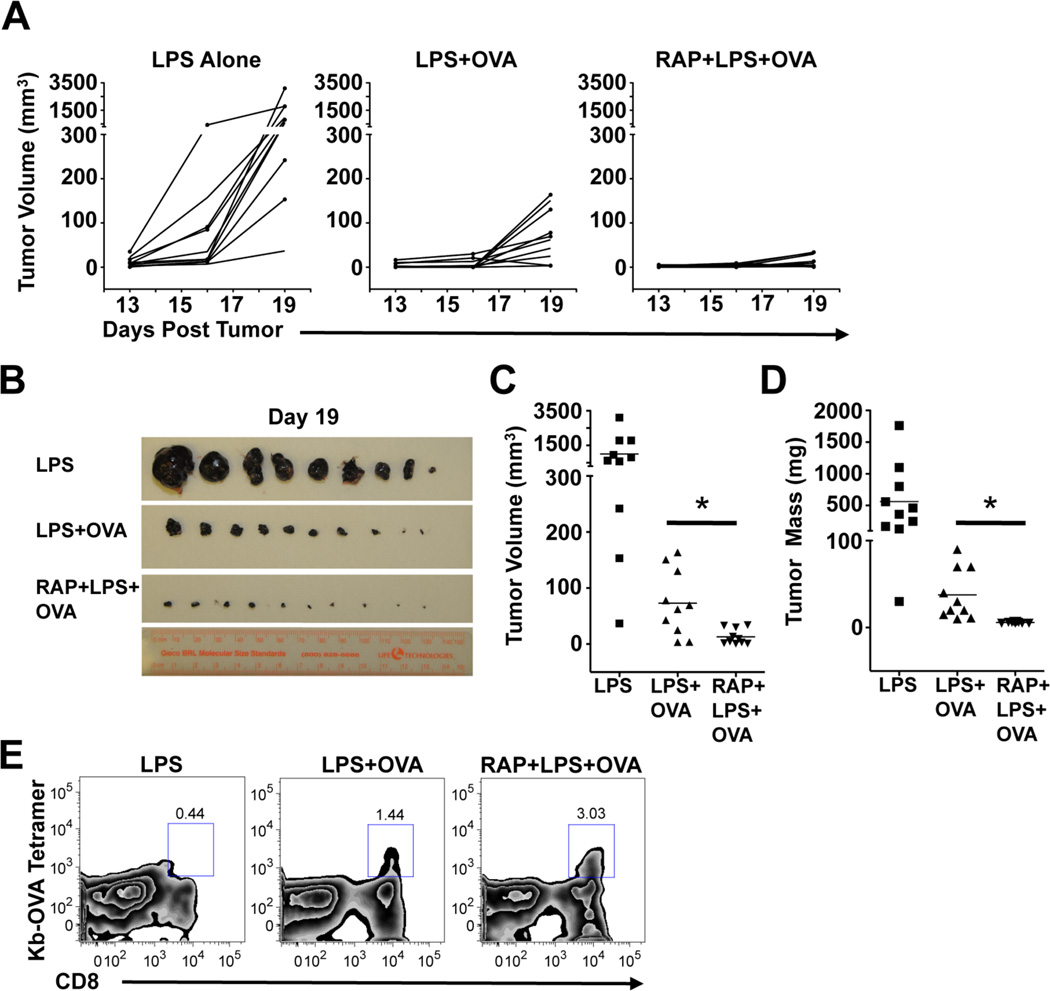
Dendritic cells (DCs) are potent inducers of T cell immunity, and autologous DC vaccination holds promise for the treatment of cancers and chronic infectious diseases. In practice, however, therapeutic vaccines of this type have had mixed success. In this article, we show that brief exposure to inhibitors of mechanistic target of rapamycin (mTOR) in DCs during the period that they are responding to TLR agonists makes them particularly potent activators of naive CD8+ T cells and able to enhance control of B16 melanoma in a therapeutic autologous vaccination model in the mouse. The improved performance of DCs in which mTOR has been inhibited is correlated with an extended life span after activation and prolonged, increased expression of costimulatory molecules. Therapeutic autologous vaccination with DCs treated with TLR agonists plus the mTOR inhibitor rapamycin results in improved generation of Ag-specific CD8+ T cells in vivo and improved antitumor immunity compared with that observed with DCs treated with TLR agonists alone. These findings define mTOR as a molecular target for augmenting DC survival and activation, and document a novel pharmacologic approach for enhancing the efficacy of therapeutic autologous DC vaccination.


Figures

Figure 1
Figure 1
Inhibition of mTOR expression prolongs DC lifespan and promotes expression of costimulatory molecules CD40 and CD86. (A) DCs were pulsed with Pam2CSK4, LPS, R848, or CpG for 6 hours and then washed and cultured in complete medium. Cell viability was monitored daily by FACS analysis of 7-AAD staining of CD11c+ cells. (B) Western blot for mTOR and β-actin protein in Luciferase hpRNA (Luchp) or mTOR hpRNA (mTORhp) -transduced DCs. (C) DCs were stimulated with media alone, LPS, or rapamycin + LPS for 30 minutes. Cells were subsequently fixed and stained for phosphorylated S6 protein as a molecular readout for mTOR activation and analyzed by FACS. (D) Luchp and mTORhp-transduced DCs were left untreated or stimulated with LPS and monitored daily for cell viability by analysis of 7-AAD staining of CD11c+ cells. (E) Luchp or mTORhp DCs were cultured with or without LPS for 24 hours and analyzed by FACS for CD40 and CD86 expression. All graphs in this figure represent mean values of replicate wells; all experiments were performed at least twice with similar results.
Figure 2
Figure 2
Pharmacological inhibition of mTOR augments DC lifespan and costimulatory molecule expression. (A) DCs were stimulated with LPS in the presence or absence of RAP or KU. Cells were monitored daily for cell viability as described for Figure 1. Data are presented as mean +/− SD of 4 independent experiments. (B) DCs were unstimulated or stimulated with LPS, RAP + LPS, or KU+LPS and analyzed by FACS 24 hours later for CD40 and CD86 expression. Data are representative of more than 4 independent experiments. (C) DCs were treated as in (B) and analyzed daily by FACS for CD40 and CD86 expression gated on live CD11c+ cells. Data are presented as mean +/− SD of 4 independent experiments. (D) DCs were treated as indicated and supernatants collected 24 hours later for analysis by Cytometric Bead Array for IL-12p70, TNFα, and IL-10. Data are presented as mean +/− SD of 2 independent experiments.
Figure 3
Figure 3
Pharmacological inhibition of mTOR augments the duration of costimulatory molecule expression in human myeloid DCs. (A) Human myeloid DCs were either unstimulated or stimulated with R848 in the presence or absence of rapamycin (RAP) or KU. CD40 and CD86 expression was analyzed by FACS. Day 4 costimulatory molecule expression from a representatitve donor (5430) is depicted. (B) DCs were treated as in (A) and analyzed daily by FACS for CD40 and CD86 expression. (C) DCs were treated as in (A) and analyzed for viability at indicated times by FACS analysis of 7-AAD staining. For each treatment, data from 4–6 individual donors is depicted.
Figure 4
Figure 4
mTOR inhibition affects activation-induced metabolic changes in mouse but not human DCs. (A) Mouse BMDCs were either left unstimulated, or treated with LPS in the presence or absence of rapamycin or KU as indicated and supernatants collected 48 hours later for analysis of glucose concentration (left) and lactate concentration (right). (B) Human myeloid DCs were either left unstimulated, or treated with R848 in the presence or absence of rapamycin or KU as indicated and supernatants collected 48 hours later for analysis of glucose concentration (left) and lactate concentration (right). Asterisks indicate statistically significant differences between groups (p<0.05). For all graphs data represent the mean +/− SD of data from at least 3 individual mice or donors.
Figure 5
Figure 5
mTOR inhibition in DCs improves their ability to stimulate CD8 T cell responses. (A) DCs were treated as indicated for 24 hours after which cells were washed and replaced with normal media. 2, 3, or 4 days after activation, DCs were co-cultured at a 1:5 ratio with CFSE-labeled OT-I CD8+ T cells for 4 days. T-cell proliferation was determined by CFSE dilution within CD8+ cell population. Data are representative of 3 independent experiments. (B) DCs were treated as indicated for 24 hours and stained for CCR7 expression. Data is representative of two independent experiments. (C) 10 mice per group were immunized subcutaneously with DCs stimulated in vitro for 6 hours with LPS, LPS plus OVA, or rapamycin (RAP) plus LPS plus OVA. 7 days later, draining (popliteal) LNs were harvested and frequencies of Kb-OVA tetramer+ CD8+ cells were determined. FACS plots represents concatenated data from all 10 individual mice per group. Data are representative of more than 3 individual experiments. (D) Total numbers of tetramer+ cells from (C) were calculated. (E) Mice were immunized as in (C) and bled weekly for one month thereafter. The frequencies of Kb-OVA tetramer+, CD44+, CD8+ cells at different times after immunization are shown. Asterisk indicates statistically significant differences between mice immunized with RAP-treated DC and normally activated DCs (p<0.05). (E) CFSE-labeled DCs were treated as indicated and injected subcutaneously into mice. On indicated days, the total number of CFSE+ CD11c+ DCs within draining or non-draining LNs (NDLN) were calculated and are displayed (n = 3–5 per group per day). Asterisks indicate statistically significant differences between RAP-treated and control DC groups (p<0.05). Data are representative of 3 individual experiments.
Figure 6
Figure 6
Rapamycin enhances the ability of DCs to induce therapeutic anti-tumor immunity. (A) Mice inoculated with tumors on Day 0 were each immunized once subcutaneously with 5 × 10⁵ DCs treated as indicated on Day 3 and then monitored every three days for tumor growth. Tumor volumes were measured at each time point. The kinetics of tumor growth for each individual mouse in the experiment (n = 10 per group) is plotted. 19 days after immunization, mice were sacrificed and tumors were excised, photographed (B) and tumor volume (C) and mass (D) were calculated. Data from all individual mice in the experiment are shown, and mean values illustrated by horizontal bars in (C) and (D). Asterisks show statistically significant differences (p<0.05). (E) Tumor single-cell suspensions were analyzed by FACS and the frequencies of Kb-OVA tetramer+ CD8+ T cells within the CD45+ gates are shown. Data are concatenated from all tumors for each mouse group. All tumor experiments were repeated at least three times with similar results.

References

    1. Barton GM, Medzhitov R. Control of adaptive immune responses by Toll-like receptors. Curr Opin Immunol. 2002;14:380–383. - PubMed
    1. Steinman RM, Hemmi H. Dendritic cells: translating innate to adaptive immunity. Curr Top Microbiol Immunol. 2006;311:17–58. - PubMed
    1. Palucka AK, Ueno H, Fay JW, Banchereau J. Taming cancer by inducing immunity via dendritic cells. Immunol Rev. 2007;220:129–150. - PubMed
    1. Palucka K, Ueno H, Zurawski G, Fay J, Banchereau J. Building on dendritic cell subsets to improve cancer vaccines. Curr Opin Immunol. 2010;22:258–263. - PMC - PubMed
    1. Kim JH, Kang TH, Noh KH, Bae HC, Kim SH, Yoo YD, Seong SY, Kim TW. Enhancement of dendritic cell-based vaccine potency by anti-apoptotic siRNAs targeting key pro-apoptotic proteins in cytotoxic CD8(+) T cell-mediated cell death. Immunol Lett. 2009;122:58–67. - PubMed

Publication types

MeSH terms