. 2012 Jul 18:6:28.
doi: 10.3389/fnana.2012.00028. eCollection 2012.

Systematic, balancing gradients in neuron density and number across the primate isocortex

Affiliations

Systematic, balancing gradients in neuron density and number across the primate isocortex

Diarmuid J Cahalane et al. Front Neuroanat. .

Abstract

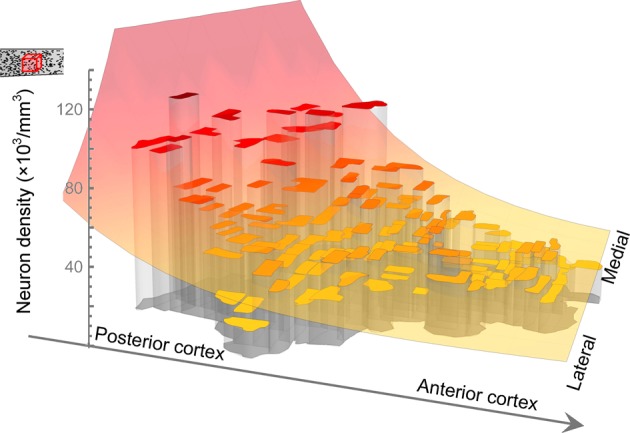
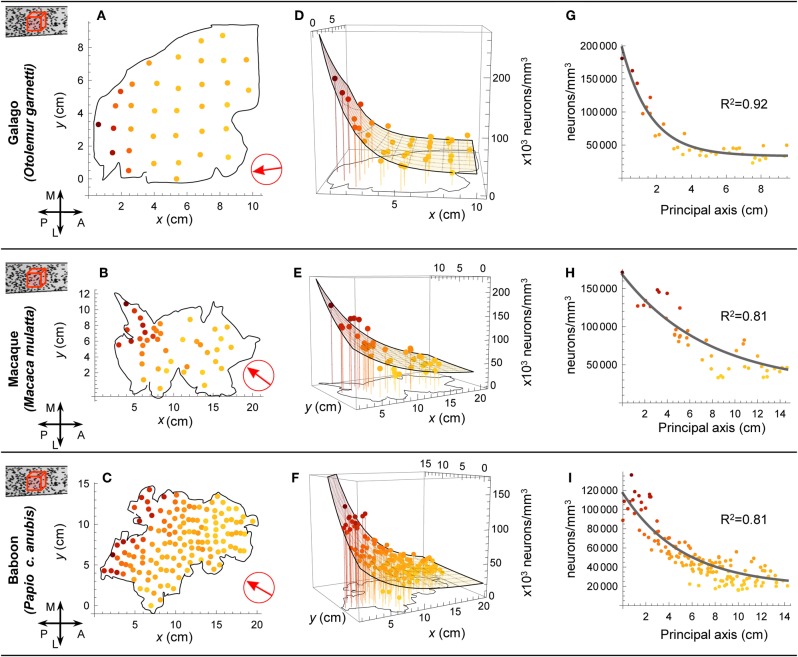
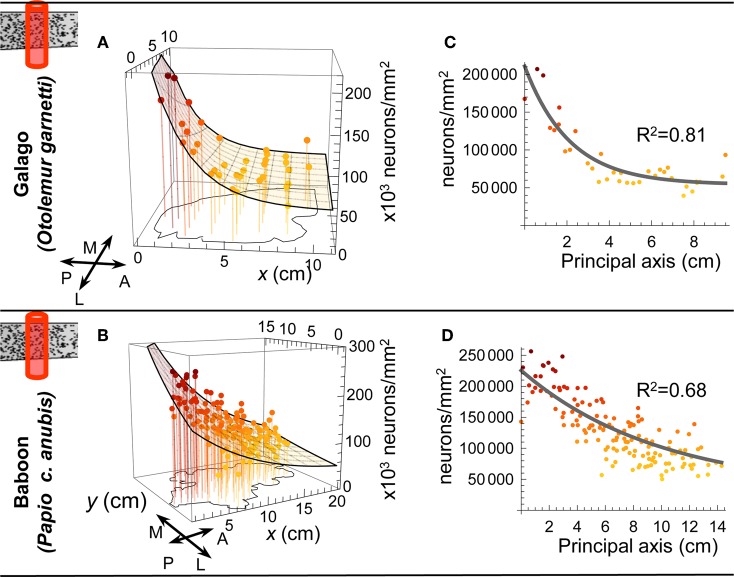
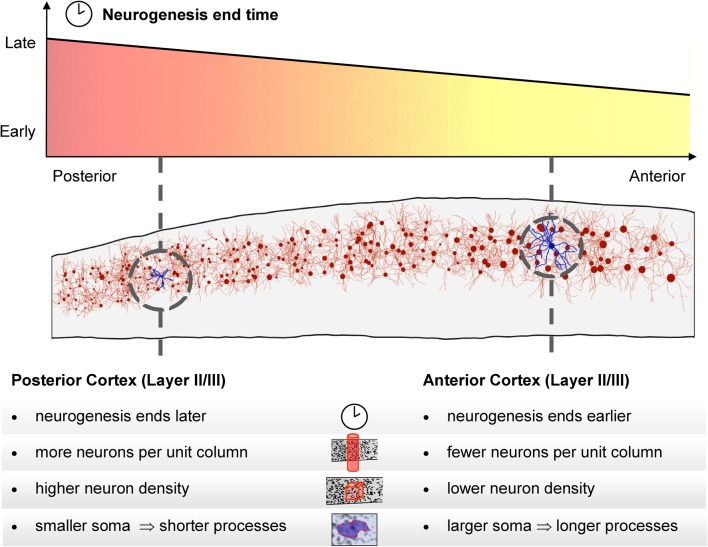
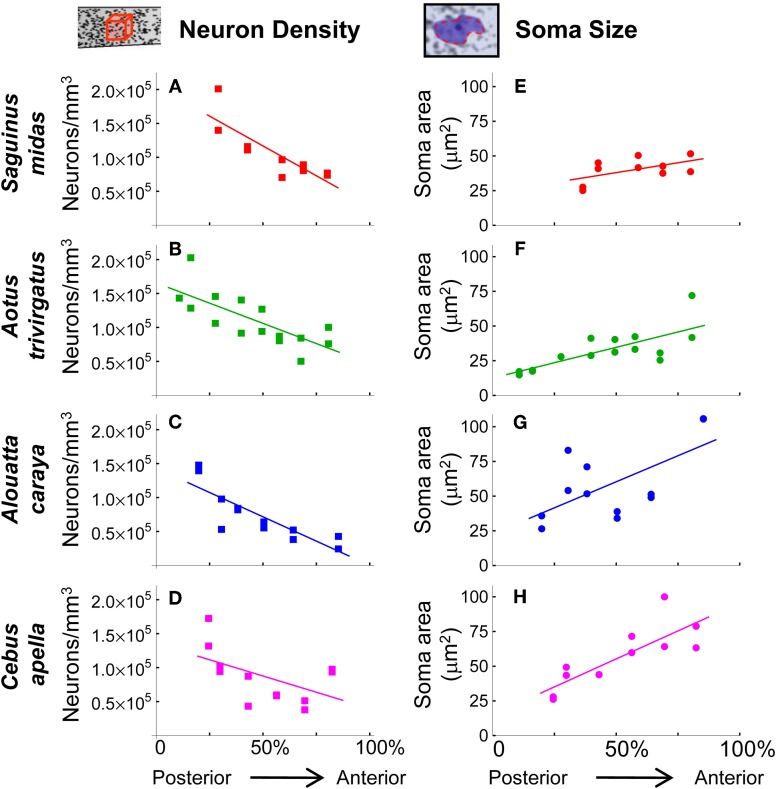
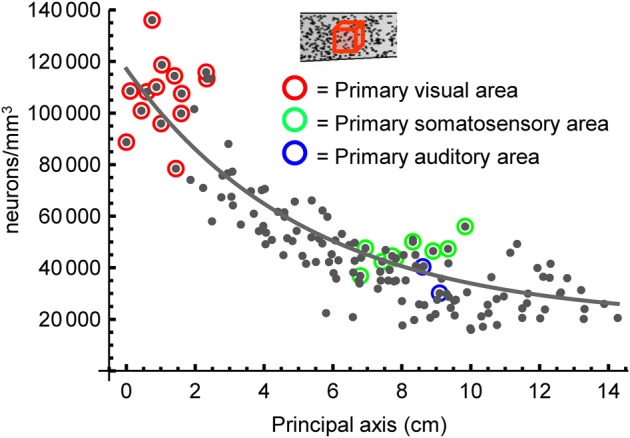
The cellular and areal organization of the cerebral cortex impacts how it processes and integrates information. How that organization emerges and how best to characterize it has been debated for over a century. Here we demonstrate and describe in the isocortices of seven primate species a pronounced anterior-to-posterior gradient in the density of neurons and in the number of neurons under a unit area of the cortical surface. Our findings assert that the cellular architecture of the primate isocortex is neither arranged uniformly nor into discrete patches with an arbitrary spatial arrangement. Rather, it exhibits striking systematic variation. We conjecture that these gradients, which establish the basic landscape that richer areal and cellular structure is built upon, result from developmental patterns of cortical neurogenesis which are conserved across species. Moreover, we propose a functional consequence: that the gradient in neurons per unit of cortical area fosters the integration and dimensional reduction of information along its ascent through sensory areas and toward frontal cortex.

Keywords: cortex; cortical areas; cytoarchitecture; evolutionary development; gradient; neurogenesis; primate evolution.


Figures

Figure 1
Figure 1
Fitting a model to neuron density recorded in each sample in baboon. Collins et al. removed and flattened the entire cortical sheet, cut it into samples and measured the density of neurons and number of neurons in each. The outlines of the samples of Collins et al. are as represented here and the height of each surface indicates the density of neurons measured in the corresponding sample. Also illustrated is the model function, increasing along an axis from anterior-lateral to posterior-medial cortex, which we have fitted to describe the global trend in neuron density.
Figure 2
Figure 2
Modeling neuron density. In three primate species Collins et al. dissected the cortex into multiple samples and recorded the density of neurons in each dissected piece. In (A, B, and C) we denote the locations of the samples on the flattened cortical sheet. We fitted model surfaces (D,E,F) which allowed us to project the data onto a principal axis of variation (G,H,I). In (A,B, and C) the red arrow indicates the alignment of the principal axis. A: anterior; P: posterior; M: medial; L: lateral.
Figure 3
Figure 3
Neurons per unit column. (A and B) Model surfaces fitted to the to the number of neurons under a square millimeter of cortical surface in each of the samples tested by Collins et al. (C and D) As for the neuron density measurements (see text), we found that the data were well represented by projecting onto a single “principal axis.” A: anterior; P: posterior; M: medial; L: lateral.
Figure 4
Figure 4
Cortical Thickness. Sample average thickness of cortex as calculated by dividing the number of neurons per column by the density of neurons for each sample in the study by Collins et al. Cortical thickness is seen to, on average, be reduced in posterior regions. The surfaces (in C and D) and the curves (in E and F) were calculated by dividing our respective model functions for neurons per column by those for neuron density. The arrows in (A and B) indicate the orientation of the principal axes.
Figure 5
Figure 5
Schematic depiction of the neurogenesis timing gradient and balanced gradients in neuron density and number per unit column. In posterior regions neurogenesis continues for longer, resulting in a higher total number of neurons in each unit column. Higher neuronal density in those regions means that the increased number of neurons does not result in greater cortical thickness. We also found that the average size of a neuron's cell body in cortical layers II and III increases toward anterior regions. Larger neuron cell bodies are associated with longer axonal and/or dendritic processes.
Figure 6
Figure 6
(A–D) Stereological measurements of neuron density in four species of New World monkeys. Neuron density decreases toward the anterior. Linear regression confirms the high significance (p < 0.002, one-tailed t-test) of the trend in (A,B, and C). For (D), Cebus apella, (p = 0.08). (E–F) Neuron soma size in cortical layers II and III. Soma size increases toward the anterior isocortex (in E, p = 0.09; F, p = 0.0008; G, p = 0.03, H, p = 0.001 using a one-tailed t-test).
Figure 7
Figure 7
Highlighting primary sensory areas in baboon. Fitting all data points with a one-factor model (as described in the text) yielded the black curve. A two-factor model (not illustrated, see text) suggests primary sensory areas (those highlighted here) have an expected density 1.26 times greater than would a non-primary area in the same location.
Figure 8
Figure 8
Counting boxes for neuron density and neuron soma size estimates. As outlined in the Materials and Methods section, and as illustrated here in a section from Aotus trivirgatus temporal isocortex, sampling axes (dashed line) were placed normal to the cortex's outer surface at chosen sites in cortical sections. Along each sampling axis, counting boxes measuring 41 μm × 41 μm (red squares, drawn to scale) were placed, typically at 100 μm intervals, from the surface to the white matter. Neuron density estimates were made within each counting box. In those counting boxes that lay in cortical layers II and III (indicated by the bracket), estimates of neuron soma size were also made.

References

    1. Anderson M. L. (2010). Neural reuse: a fundamental organizational principle of the brain. Behav. Brain Sci. 33, 245–266 10.1017/S0140525X10000853 - DOI - PubMed
    1. Badre D. (2008). Cognitive control, hierarchy, and the rostro-caudal organization of the frontal lobes. Trends Cogn. Sci. 12, 193–200 10.1016/j.tics.2008.02.004 - DOI - PubMed
    1. Bar M. (2007). The proactive brain: using analogies and associations to generate predictions. Trends Cogn. Sci. 11, 280–289 10.1016/j.tics.2007.05.005 - DOI - PubMed
    1. Barone P., Batardiere A., Knoblauch K., Kennedy H. (2000). Laminar distribution of neurons in extrastriate areas projecting to visual areas V1 and V4 correlates with the hierarchical rank and indicates the operation of a distance rule. J. Neurosci. 20, 3263–3281 - PMC - PubMed
    1. Bayer S. A., Altman J. (1991). Neocortical development. New York, NY: Raven Press;

LinkOut - more resources