Comparative Study
. 2012 Sep:102:50-8.
doi: 10.1016/j.exer.2012.07.004. Epub 2012 Jul 22.

Oxygen consumption and distribution in the Long-Evans rat retina

Affiliations
Comparative Study

Oxygen consumption and distribution in the Long-Evans rat retina

Jennifer C M Lau et al. Exp Eye Res. 2012 Sep.

Abstract

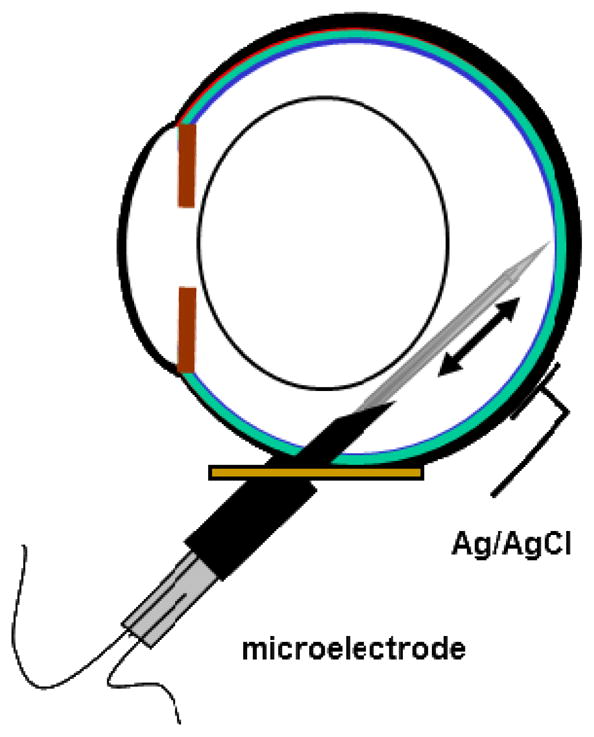
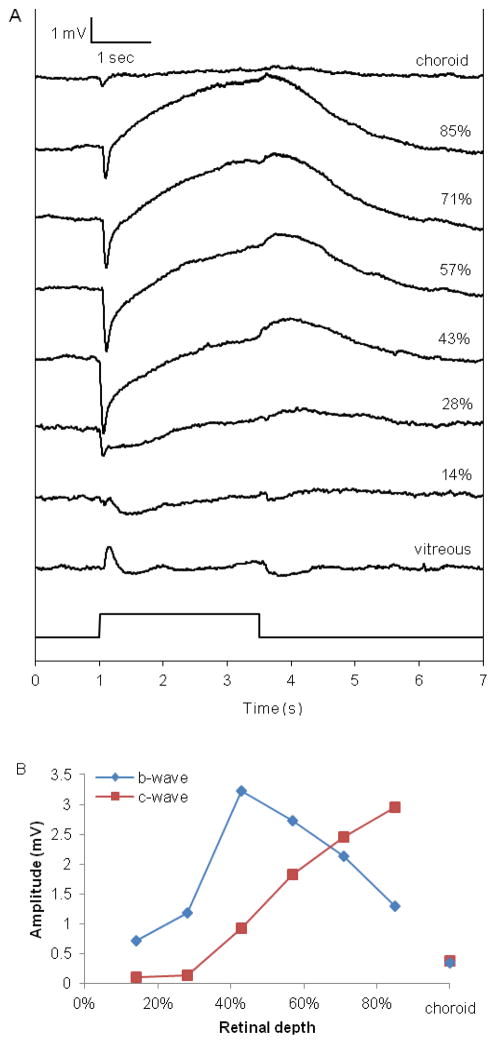
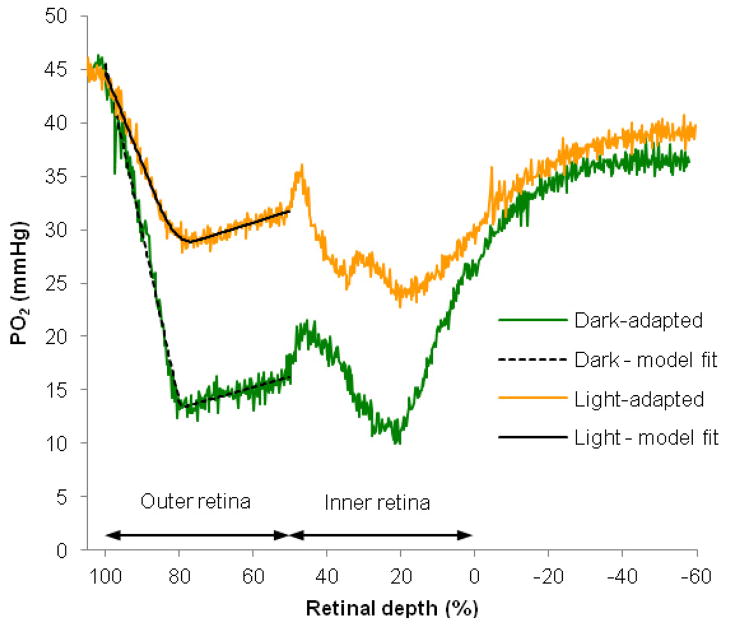
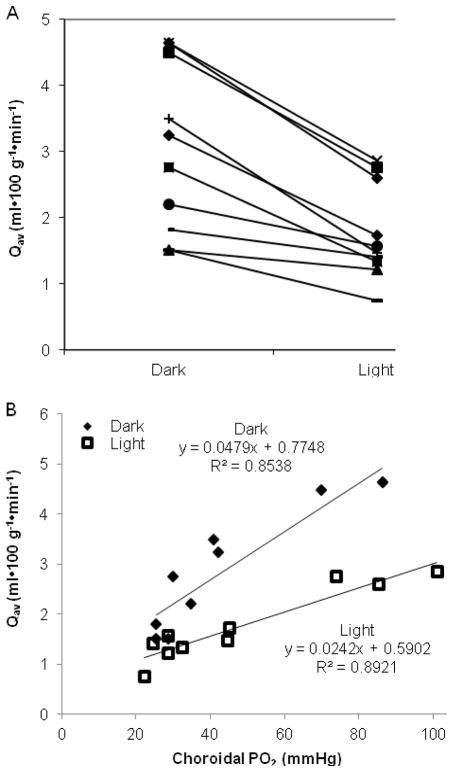
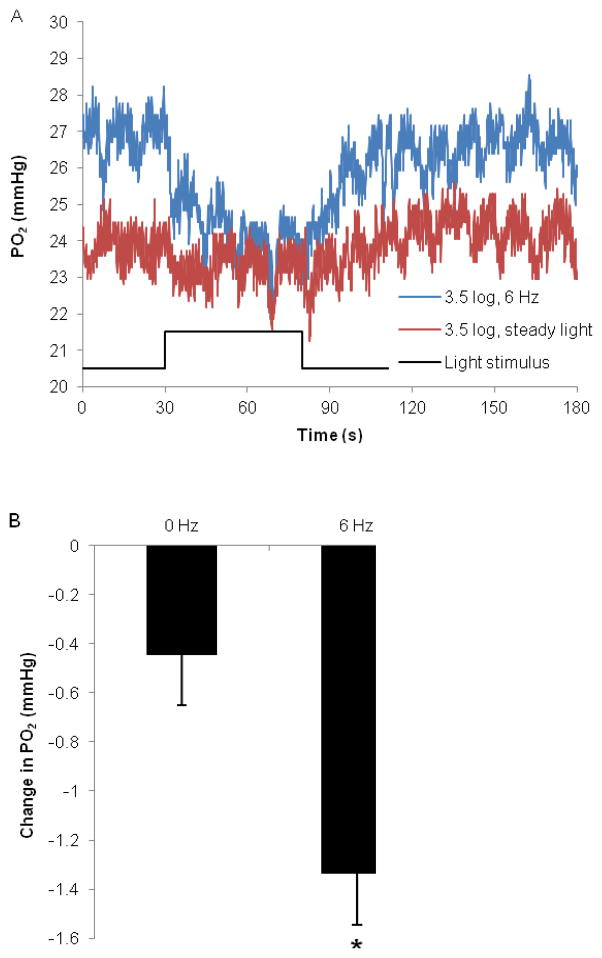
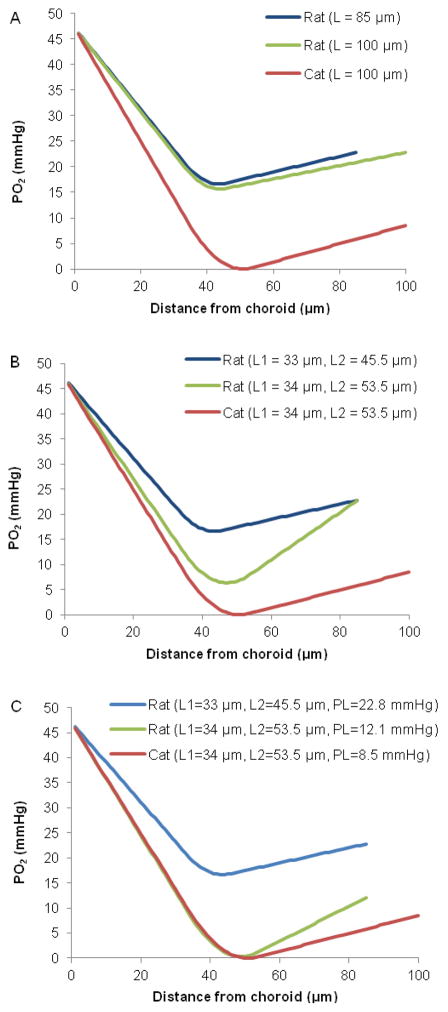
The purpose of this study was to investigate the oxygen distribution and consumption in the pigmented Long-Evans rat retina in vivo during dark and light adaptation, and to compare these results to previous work on cat and albino rat. Double-barreled microelectrodes recorded both intraretinal PO(2) depth profiles and the electroretinogram (ERG), which was used to identify the boundaries of the retina. Light adaptation decreased photoreceptor oxygen consumption per unit volume (Q(av)) from 3.0 ± 0.4 ml·100 g(-1) min(-1) (mean ± SEM) in darkness to 1.8 ± 0.2 ml·100 g(-1) min(-1) and increased minimum outer retinal PO(2) at the inner segments (P(min)) from 17.4 ± 3.0 to 29.9 ± 5.3 mmHg. The effects of light on outer retinal PO(2) and Q(av) were similar to those previously observed in cat, monkey, and albino rats; however, dark-adapted P(min) was higher in rat than cat. The parameters derived from fitting the oxygen diffusion model to the rat data were compared to those from cat. Oxygen consumption of the inner segments (Q(2)) and choroidal PO(2) (P(C)) in rat and cat were similar. P(min) was higher in rat than in cat for two reasons: first, rat photoreceptors have a shorter oxygen consuming region; and second, the retinal circulation supplied a greater fraction of consumed oxygen to rat photoreceptors. The average PO(2) across the inner retina (P(IR)) was not different in dark adaptation (25.4 ± 4.8 mmHg) and light adaptation (28.8 ± 5.4 mmHg) when measured from PO(2) profiles. However, with the microelectrode stationary at 9-18% retinal depth, a small consistent decrease in PO(2) occurred during illumination. Flickering light at 6 Hz decreased inner retinal PO(2) significantly more than an equivalent steady illumination, suggesting that changes in blood flow did not completely compensate for increased metabolism. This study comprehensively characterized rat retinal oxygenation in both light and dark, and determined the similarities and differences between rat and cat retinas.


Figures

Figure 1
Figure 1
Schematic of the experimental setup. The manipulator that held the eye, which allowed for positioning of the electrode, and the boot sealing the electrode into the needle are not shown.
Figure 2
Figure 2
Intraretinal electroretinogram (ERG) from one rat (Rat 104) in response to 2.5 sec of illumination just below rod saturation (<10 lux), as a function of retinal depth. A. Individual ERG traces at different retinal depths shown as percentage of the distance between the vitreous (0%) and the choriocapillaris (100%). The negative trough in the intraretinal recordings is the b-wave, and the c-wave is the peak just before the light was turned off. The amplitudes of both the b- and c-waves decreased precipitously after the electrode crossed the RPE into the choroid. B. The amplitudes of the b- and c-waves from the traces in 2A, measured from baseline, as a function of retinal depth.
Figure 3
Figure 3
Typical PO2 profiles as a function of retinal depth from one rat retina (Rat 117). Profiles were first recorded in dark adaptation. Then, light-adapted profiles were recorded during an illumination that was sufficient to saturate rod responses in the ERG. The choriocapillaris is located at 100% retinal depth, and 0% represents the interface between the retina and the vitreous. The PO2 profile in green was recorded in dark adaptation while the profile in orange was recorded in light adaptation. The solid black line is the model fit to the data obtained in dark adaptation, and the dashed black line is the model fit to the data obtained in light adaptation. The vitreous near the retina is indicated by negative percent retinal depth.
Figure 4
Figure 4
Photoreceptor oxygen consumption (Qav) decreased in light adaptation and was dependent on choroidal PO2. A. Qav in dark and light adaptation for each rat with lines connecting values from individual rats. (n = 10 rats) B. Qav was dependent on choroidal PO2. Each data point is the averaged dark- or light-adapted value from each rat.
Figure 5
Figure 5
PO2 was recorded within the inner retina while the electrode was held stationary. Illumination is given as log units of light attenuation from the maximum. A. Representative examples of inner retinal PO2 in response to steady light (red) and 6 Hz flicker at 3.5 log units of attenuation (blue), from Rat 132. Light was turned on at 30 seconds and turned off at 80 seconds. The electrode was positioned at approximately 9% retinal depth. B. Changes in inner retinal PO2 (mmHg) in response to steady and 6 Hz flickering light. Illumination was 3 log units of attenuation or more from the maximum available. (n = 5 rats, mean ± SEM, * p < 0.03)
Figure 6
Figure 6
Simulations of average outer retinal PO2 profiles in rat from parameters given in Table 2, compared to simulated profiles from cat. In each section of the figure, the PO2 profile in rat (blue) and cat (red) are shown. A. The length of rat photoreceptors is shorter than in cat. Modifying L in the rat model so that it is the same as in the cat decreased Pmin by 1 mmHg in the rat simulation (green). B. Modifying L1 and L2 in the rat model so that they were the same as in the cat model decreased Pmin to 6.4 mmHg (green). C. Changing Fr, the percent oxygen supplied by the retinal circulation to the photoreceptors, in the rat model so that it is the same as in the cat model changed PL to 12.1 mmHg. By modifying L1, L2, and PL in the rat model, Pmin approached zero (green).

Similar articles

Cited by

References

    1. Ahmed J, Braun RD, Dunn R, Jr, Linsenmeier RA. Oxygen distribution in the macaque retina. Invest Ophthalmol Vis Sci. 1993;34:516–521. - PubMed
    1. Alder VA, Yu DY, Cringle SJ. Vitreal oxygen tension measurements in the rat eye. Exp Eye Res. 1991;52:293–299. - PubMed
    1. Barnett V, Lewis T. Outliers in Statistical Data. John Wiley & Sons; New York: 1978.
    1. Berkowitz BA, Bissig D, Bergman D, Bercea E, Kasturi VK, Roberts R. Intraretinal calcium channels and retinal morbidity in experimental retinopathy of prematurity. Mol Vis. 2011;17:2516–2526. - PMC - PubMed
    1. Bill A, Sperber GO. Aspects of oxygen and glucose consumption in the retina: effects of high intraocular pressure and light. Graefes Arch Clin Exp Ophthalmol. 1990;228:124–127. - PubMed

Publication types