

Redeployment-based drug screening identifies the anti-helminthic niclosamide as anti-myeloma therapy that also reduces free light chain production
- PMID: 22829072
- PMCID: PMC3255256
- DOI: 10.1038/bcj.2011.38
Redeployment-based drug screening identifies the anti-helminthic niclosamide as anti-myeloma therapy that also reduces free light chain production
Abstract
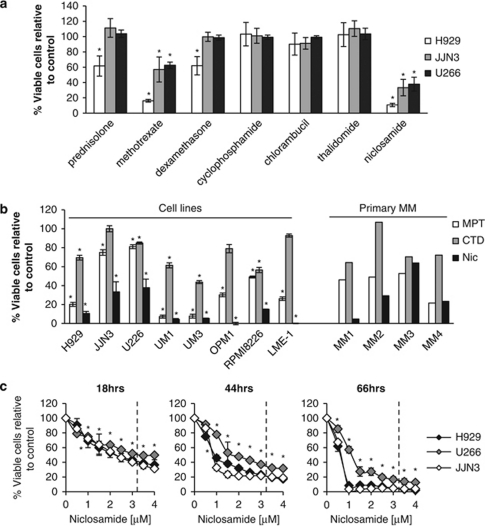
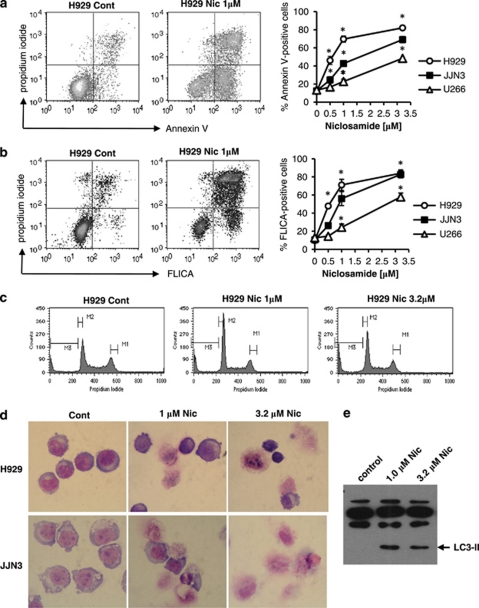
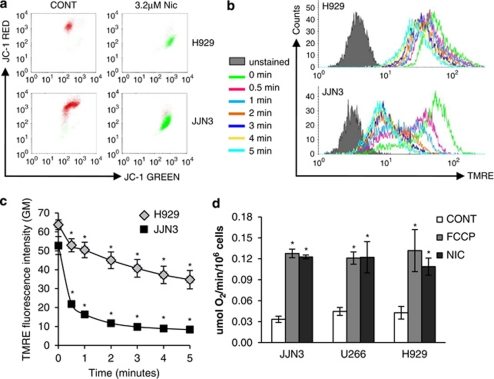
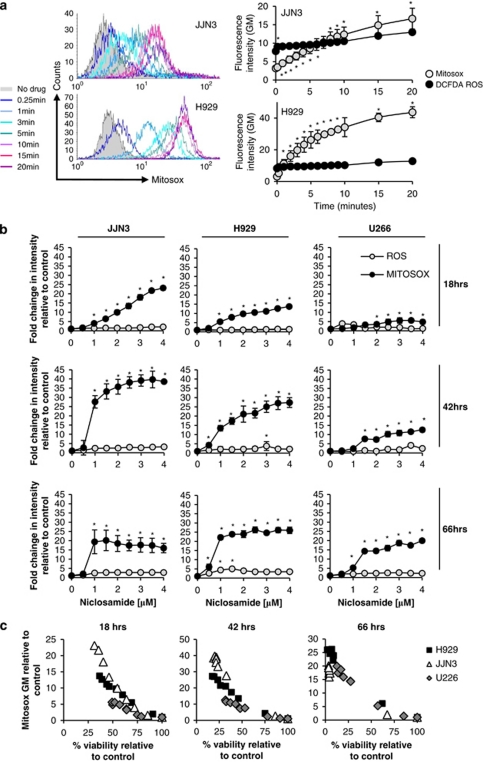
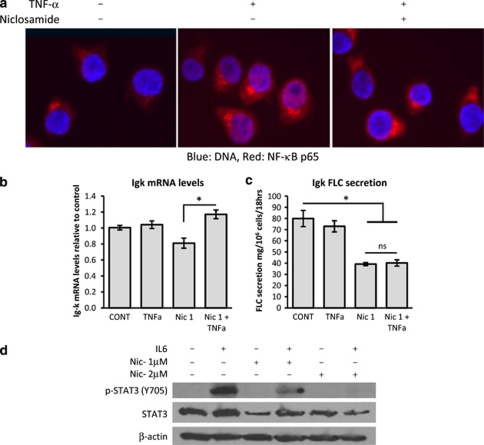
Despite recent therapeutic advancements, multiple myeloma (MM) remains incurable and new therapies are needed, especially for the treatment of elderly and relapsed/refractory patients. We have screened a panel of 100 off-patent licensed oral drugs for anti-myeloma activity and identified niclosamide, an anti-helminthic. Niclosamide, at clinically achievable non-toxic concentrations, killed MM cell lines and primary MM cells as efficiently as or better than standard chemotherapy and existing anti-myeloma drugs individually or in combinations, with little impact on normal donor cells. Cell death was associated with markers of both apoptosis and autophagy. Importantly, niclosamide rapidly reduced free light chain (FLC) production by MM cell lines and primary MM. FLCs are a major cause of renal impairment in MM patients and light chain amyloid and FLC reduction is associated with reversal of tissue damage. Our data indicate that niclosamides anti-MM activity was mediated through the mitochondria with rapid loss of mitochondrial membrane potential, uncoupling of oxidative phosphorylation and production of mitochondrial superoxide. Niclosamide also modulated the nuclear factor-κB and STAT3 pathways in MM cells. In conclusion, our data indicate that MM cells can be selectively targeted using niclosamide while also reducing FLC secretion. Importantly, niclosamide is widely used at these concentrations with minimal toxicity.
Figures

Similar articles
-
Repurposing of the anti-helminthic drug niclosamide to treat melanoma and pulmonary metastasis via the STAT3 signaling pathway.Biochem Pharmacol. 2019 Nov;169:113610. doi: 10.1016/j.bcp.2019.08.012. Epub 2019 Aug 26. Biochem Pharmacol. 2019. PMID: 31465777
-
A Novel High Content Imaging-Based Screen Identifies the Anti-Helminthic Niclosamide as an Inhibitor of Lysosome Anterograde Trafficking and Prostate Cancer Cell Invasion.PLoS One. 2016 Jan 19;11(1):e0146931. doi: 10.1371/journal.pone.0146931. eCollection 2016. PLoS One. 2016. PMID: 26784896 Free PMC article.
-
Serum free light chain measurement aids the diagnosis of myeloma in patients with severe renal failure.BMC Nephrol. 2008 Sep 22;9:11. doi: 10.1186/1471-2369-9-11. BMC Nephrol. 2008. PMID: 18808676 Free PMC article.
-
The pathogenesis of acute kidney impairment in patients with multiple myeloma.Adv Chronic Kidney Dis. 2012 Sep;19(5):282-6. doi: 10.1053/j.ackd.2012.04.009. Adv Chronic Kidney Dis. 2012. PMID: 22920637 Review.
-
The magic bullet: Niclosamide.Front Oncol. 2022 Nov 21;12:1004978. doi: 10.3389/fonc.2022.1004978. eCollection 2022. Front Oncol. 2022. PMID: 36479072 Free PMC article. Review.
Cited by
-
Extracellular pH Modulates Neuroendocrine Prostate Cancer Cell Metabolism and Susceptibility to the Mitochondrial Inhibitor Niclosamide.PLoS One. 2016 Jul 20;11(7):e0159675. doi: 10.1371/journal.pone.0159675. eCollection 2016. PLoS One. 2016. PMID: 27438712 Free PMC article.
-
The Anthelmintic Drug Niclosamide and Its Analogues Activate the Parkinson's Disease Associated Protein Kinase PINK1.Chembiochem. 2018 Mar 2;19(5):425-429. doi: 10.1002/cbic.201700500. Epub 2018 Jan 24. Chembiochem. 2018. PMID: 29226533 Free PMC article.
-
Niclosamide suppresses renal cell carcinoma by inhibiting Wnt/β-catenin and inducing mitochondrial dysfunctions.Springerplus. 2016 Aug 30;5(1):1436. doi: 10.1186/s40064-016-3153-x. eCollection 2016. Springerplus. 2016. PMID: 27652012 Free PMC article.
-
Drug repurposing for antimicrobial discovery.Nat Microbiol. 2019 Apr;4(4):565-577. doi: 10.1038/s41564-019-0357-1. Epub 2019 Mar 4. Nat Microbiol. 2019. PMID: 30833727 Review.
-
Niclosamide inhibits ovarian carcinoma growth by interrupting cellular bioenergetics.J Cancer. 2020 Mar 13;11(12):3454-3466. doi: 10.7150/jca.41418. eCollection 2020. J Cancer. 2020. PMID: 32284741 Free PMC article.
References
-
- Kleber M, Ihorst G, Deschler B, Jakob C, Liebisch P, Koch B, et al. Detection of renal impairment as one specific comorbidity factor in multiple myeloma: multicenter study in 198 consecutive patients. Eur J Haematol. 2009;83:519–527. - PubMed
-
- Clark AD, Shetty A, Soutar R. Renal failure and multiple myeloma: pathogenesis and treatment of renal failure and management of underlying myeloma. Blood Rev. 1999;13:79–90. - PubMed
-
- Dimopoulos MA, Terpos E, Chanan-Khan A, Leung N, Ludwig H, Jagannath S, et al. Renal impairment in patients with multiple myeloma: a consensus statement on behalf of the International Myeloma Working Group. J Clin Oncol. 2010;28:4976–4984. - PubMed
-
- Rayner HC, Haynes AP, Thompson JR, Russell N, Fletcher J. Perspectives in multiple myeloma: survival, prognostic factors and disease complications in a single centre between 1975 and 1988. Q J Med. 1991;79:517–525. - PubMed
-
- Augustson BM, Begum G, Dunn JA, Barth NJ, Davies F, Morgan G, et al. Early mortality after diagnosis of multiple myeloma: analysis of patients entered onto the United kingdom Medical Research Council trials between 1980 and 2002—Medical Research Council Adult Leukaemia Working Party. J Clin Oncol. 2005;23:9219–9226. - PubMed
LinkOut - more resources
Full Text Sources
Other Literature Sources
Molecular Biology Databases
Miscellaneous
