

The mTOR inhibitor, everolimus (RAD001), overcomes resistance to imatinib in quiescent Ph-positive acute lymphoblastic leukemia cells
- PMID: 22829152
- PMCID: PMC3255258
- DOI: 10.1038/bcj.2011.16
The mTOR inhibitor, everolimus (RAD001), overcomes resistance to imatinib in quiescent Ph-positive acute lymphoblastic leukemia cells
Abstract
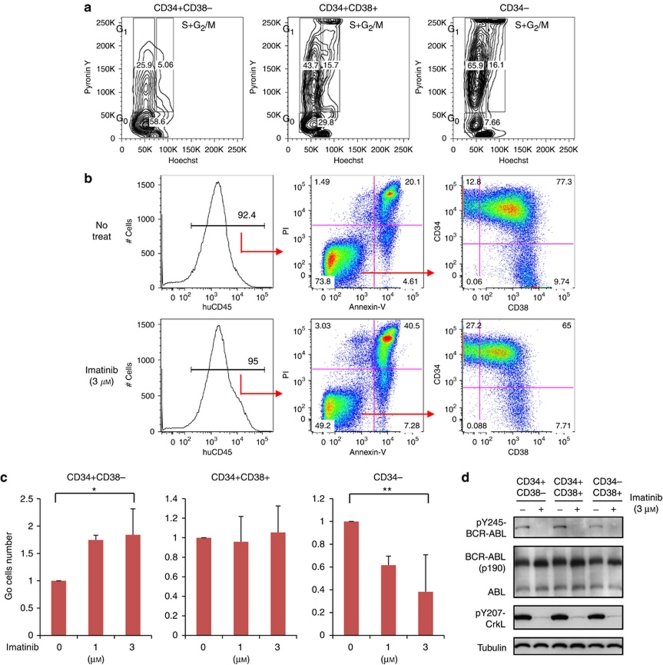
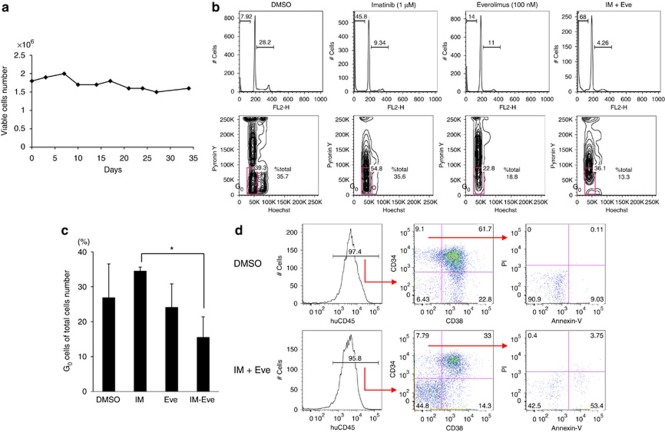
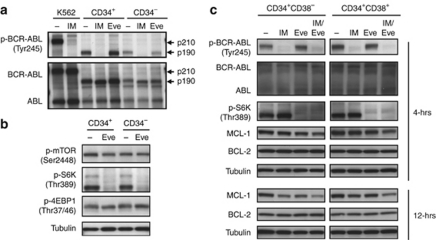
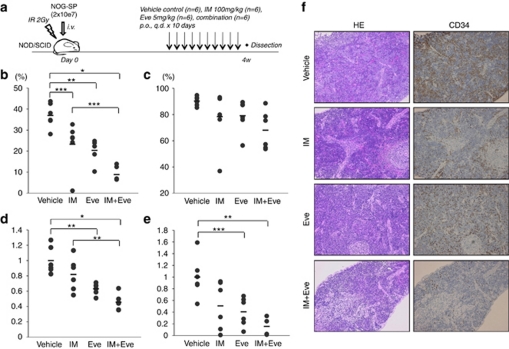
In Ph-positive (Ph(+)) leukemia, the quiescent cell state is one of the reasons for resistance to the BCR-ABL-kinase inhibitor, imatinib. In order to examine the mechanisms of resistance due to quiescence and the effect of the mammalian target of rapamycin inhibitor, everolimus, for such a resistant population, we used Ph(+) acute lymphoblastic leukemia patient cells serially xenotransplanted into NOD/SCID/IL2rγ(null) (NOG) mice. Spleen cells from leukemic mice showed a higher percentage of slow-cycling G(0) cells in the CD34(+)CD38(-) population compared with the CD34(+)CD38(+) and CD34(-) populations. After ex vivo imatinib treatment, more residual cells were observed in the CD34(+)CD38(-) population than in the other populations. Although slow-cycling G(0) cells were insensitive to imatinib in spite of BCR-ABL and CrkL dephosphorylation, combination treatment with everolimus induced substantial cell death, including that of the CD34(+)CD38(-) population, with p70-S6 K dephosphorylation and decrease of MCL-1 expression. The leukemic non-obese diabetic/severe combined immunodeficiency (NOD/SCID) mouse system with the in vivo combination treatment with imatinib and everolimus showed a decrease of tumor burden including CD34(+) cells. These results imply that treatment with everolimus can overcome resistance to imatinib in Ph(+) leukemia due to quiescence.
Figures
Similar articles
-
Dual inhibition of Bcr-Abl and Hsp90 by C086 potently inhibits the proliferation of imatinib-resistant CML cells.Clin Cancer Res. 2015 Feb 15;21(4):833-43. doi: 10.1158/1078-0432.CCR-13-3317. Epub 2014 Dec 11. Clin Cancer Res. 2015. PMID: 25501124
-
HDAC inhibitor suppresses proliferation and tumorigenicity of drug-resistant chronic myeloid leukemia stem cells through regulation of hsa-miR-196a targeting BCR/ABL1.Exp Cell Res. 2018 Sep 15;370(2):519-530. doi: 10.1016/j.yexcr.2018.07.017. Epub 2018 Jul 12. Exp Cell Res. 2018. PMID: 30017934
-
Resistance to imatinib of bcr/abl p190 lymphoblastic leukemia cells.Cancer Res. 2006 May 15;66(10):5387-93. doi: 10.1158/0008-5472.CAN-05-3058. Cancer Res. 2006. PMID: 16707466
-
Resistance of Philadelphia-chromosome positive leukemia towards the kinase inhibitor imatinib (STI571, Glivec): a targeted oncoprotein strikes back.Leukemia. 2003 May;17(5):829-38. doi: 10.1038/sj.leu.2402889. Leukemia. 2003. PMID: 12750693 Review.
-
Src-family kinases in the development and therapy of Philadelphia chromosome-positive chronic myeloid leukemia and acute lymphoblastic leukemia.Leuk Lymphoma. 2008 Jan;49(1):19-26. doi: 10.1080/10428190701713689. Leuk Lymphoma. 2008. PMID: 18203007 Free PMC article. Review.
Cited by
-
Murine models of acute leukemia: important tools in current pediatric leukemia research.Front Oncol. 2014 May 7;4:95. doi: 10.3389/fonc.2014.00095. eCollection 2014. Front Oncol. 2014. PMID: 24847444 Free PMC article. Review.
-
Tyrosine kinase inhibitor-induced defects in DNA repair sensitize FLT3(ITD)-positive leukemia cells to PARP1 inhibitors.Blood. 2018 Jul 5;132(1):67-77. doi: 10.1182/blood-2018-02-834895. Epub 2018 May 21. Blood. 2018. PMID: 29784639 Free PMC article.
-
Small-molecule Hedgehog inhibitor attenuates the leukemia-initiation potential of acute myeloid leukemia cells.Cancer Sci. 2016 Oct;107(10):1422-1429. doi: 10.1111/cas.13019. Epub 2016 Sep 2. Cancer Sci. 2016. PMID: 27461445 Free PMC article.
-
Obesity and Leukemia: Biological Mechanisms, Perspectives, and Challenges.Curr Obes Rep. 2024 Mar;13(1):1-34. doi: 10.1007/s13679-023-00542-z. Epub 2023 Dec 30. Curr Obes Rep. 2024. PMID: 38159164 Free PMC article. Review.
-
Targeting mTOR in Acute Lymphoblastic Leukemia.Cells. 2019 Feb 21;8(2):190. doi: 10.3390/cells8020190. Cells. 2019. PMID: 30795552 Free PMC article. Review.
References
-
- Wassmann B, Pfeifer H, Goekbuget N, Beelen DW, Beck J, Stelljes M, et al. Alternating versus concurrent schedules of imatinib and chemotherapy as front-line therapy for Philadelphia-positive acute lymphoblastic leukemia (Ph+ ALL) Blood. 2006;108:1469–1477. - PubMed
-
- Quintas-Cardama A, Kantarjian H, Cortes J. Imatinib and beyond—exploring the full potential of targeted therapy for CML. Nat Rev Clin Oncol. 2009;6:535–543. - PubMed
-
- Michor F, Hughes TP, Iwasa Y, Branford S, Shah NP, Sawyers CL, et al. Dynamics of chronic myeloid leukaemia. Nature. 2005;435:1267–1270. - PubMed
-
- Roeder I, Horn M, Glauche I, Hochhaus A, Mueller MC, Loeffler M. Dynamic modeling of imatinib-treated chronic myeloid leukemia: functional insights and clinical implications. Nat Med. 2006;12:1181–1184. - PubMed
LinkOut - more resources
Full Text Sources
Other Literature Sources
Research Materials
Miscellaneous
