

The relationship between cardiac and liver iron evaluated by MR imaging in haematological malignancies and chronic liver disease
- PMID: 22829233
- PMCID: PMC3270252
- DOI: 10.1038/bcj.2011.48
The relationship between cardiac and liver iron evaluated by MR imaging in haematological malignancies and chronic liver disease
Abstract
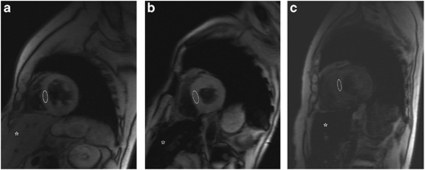
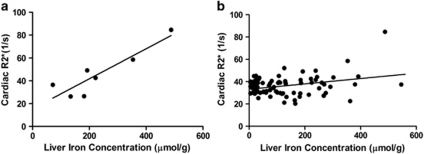
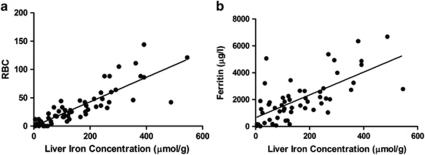
Although iron overload is clinically significant, only limited data have been published on iron overload in haematological diseases. We investigated cardiac and liver iron accumulation by magnetic resonance imaging (MRI) in a cohort of 87 subjects who did not receive chelation, including 59 haematological patients. M-HIC (MRI-based hepatic iron concentration, normal values <36 μmol/g) is a non-invasive, liver biopsy-calibrated method to analyse iron concentration. This method, calibrated to R2 (transverse relaxation rate), was used as a reference standard (M-HIC(R2)). Transfusions and ferritin were evaluated. Mean M-HIC(R2) and cardiac R(*) of all patients were 142 μmol/g (95% CI, 114-170) and 36.4 1/s (95% CI, 34.2-38.5), respectively. M-HIC(R2) was higher in haematological patients than in patients with chronic liver disease or normal controls (P<0.001). Clearly elevated cardiac R2(*) was found in two myelodysplastic syndrome (MDS) patients with severe liver iron overload. A poor correlation was found between liver and cardiac iron (n=82, r=0.322, P=0.003), in contrast to a stronger correlation in MDS (n=7, r=0.905, P=0.005). In addition to transfusions, MDS seemed to be an independent factor in iron accumulation. In conclusion, the risk for cardiac iron overload in haematological diseases other than MDS is very low, despite the frequently found liver iron overload.
Figures
Similar articles
-
Quantitative Susceptibility Mapping Using a Multispectral Autoregressive Moving Average Model to Assess Hepatic Iron Overload.J Magn Reson Imaging. 2021 Sep;54(3):721-727. doi: 10.1002/jmri.27584. Epub 2021 Feb 26. J Magn Reson Imaging. 2021. PMID: 33634923 Free PMC article.
-
Assessing cardiac and liver iron overload in chronically transfused patients with sickle cell disease.Br J Haematol. 2016 Nov;175(4):705-713. doi: 10.1111/bjh.14277. Epub 2016 Aug 10. Br J Haematol. 2016. PMID: 27507431
-
Iron overload: accuracy of in-phase and out-of-phase MRI as a quick method to evaluate liver iron load in haematological malignancies and chronic liver disease.Br J Radiol. 2012 Jun;85(1014):e162-7. doi: 10.1259/bjr/22327146. Epub 2011 Mar 8. Br J Radiol. 2012. PMID: 21385919 Free PMC article.
-
Impact of iron overload in myelodysplastic syndromes.Blood Rev. 2009 Dec;23 Suppl 1:S15-9. doi: 10.1016/S0268-960X(09)70005-0. Blood Rev. 2009. PMID: 20116635 Review.
-
Optimizing therapy for iron overload in the myelodysplastic syndromes: recent developments.Drugs. 2011 Jan 22;71(2):155-77. doi: 10.2165/11585280-000000000-00000. Drugs. 2011. PMID: 21275444 Review.
Cited by
-
Safety and efficacy of deferasirox in the management of transfusion-dependent patients with myelodysplastic syndrome and aplastic anaemia: a perspective review.Ther Adv Hematol. 2013 Apr;4(2):93-102. doi: 10.1177/2040620712472355. Ther Adv Hematol. 2013. PMID: 23610617 Free PMC article.
-
MRI for Quantification of Liver and Cardiac Iron in Thalassemia Major Patients: Pilot Study in Indian Population.Indian J Pediatr. 2017 Apr;84(4):276-282. doi: 10.1007/s12098-017-2310-8. Epub 2017 Feb 24. Indian J Pediatr. 2017. PMID: 28233255
References
-
- Schafer AI, Cheron RG, Dluhy R, Cooper B, Gleason RE, Soeldner JS, et al. Clinical consequences of acquired transfusional iron overload in adults. N Engl J Med. 1981;304:319–324. - PubMed
-
- Olivieri NF, Nathan DG, MacMillan JH, Wayne AS, Liu PP, McGee A, et al. Survival in medically treated patients with homozygous beta-thalassemia. N Engl J Med. 1994;331:574–578. - PubMed
-
- Fenaux P, Rose C. Impact of iron overload in myelodysplastic syndromes. Blood Rev. 2009;23 (Suppl 1:S15–S19. - PubMed
-
- Malcovati L, Della Porta MG, Cazzola M. Predicting survival and leukemic evolution in patients with myelodysplastic syndrome. Haematologica. 2006;91:1588–1590. - PubMed
LinkOut - more resources
Full Text Sources
Research Materials
Miscellaneous
