. 2012 Sep;160(1):379-95.
doi: 10.1104/pp.112.202408. Epub 2012 Jul 24.

Unique drought resistance functions of the highly ABA-induced clade A protein phosphatase 2Cs

Affiliations

Unique drought resistance functions of the highly ABA-induced clade A protein phosphatase 2Cs

Govinal Badiger Bhaskara et al. Plant Physiol. 2012 Sep.

Erratum in

  • CORRECTION: Vol. 160: 379-395, 2012.
    [No authors listed] [No authors listed] Plant Physiol. 2018 Nov;178(3):1423. doi: 10.1104/pp.18.01168. Plant Physiol. 2018. PMID: 30425159 Free PMC article. No abstract available.

Abstract

Six Arabidopsis (Arabidopsis thaliana) clade A protein phosphatase 2Cs (PP2Cs) have established abscisic acid (ABA) signaling roles; however, phenotypic roles of the remaining three "HAI" PP2Cs, Highly ABA-Induced1 (HAI1), AKT1-Interacting PP2C1/HAI2, and HAI3, have remained unclear. HAI PP2C mutants had enhanced proline and osmoregulatory solute accumulation at low water potential, while mutants of other clade A PP2Cs had no or lesser effect on these drought resistance traits. hai1-2 also had increased expression of abiotic stress-associated genes, including dehydrins and late embryogenesis abundant proteins, but decreased expression of several defense-related genes. Conversely, the HAI PP2Cs had relatively less impact on several ABA sensitivity phenotypes. HAI PP2C single mutants were unaffected in ABA sensitivity, while double and triple mutants were moderately hypersensitive in postgermination ABA response but ABA insensitive in germination. The HAI PP2Cs interacted most strongly with PYL5 and PYL7 to -10 of the PYL/RCAR ABA receptor family, with PYL7 to -10 interactions being relatively little affected by ABA in yeast two-hybrid assays. HAI1 had especially limited PYL interaction. Reduced expression of the main HAI1-interacting PYLs at low water potential when HAI1 expression was strongly induced also suggests limited PYL regulation and a role of HAI1 activity in negatively regulating specific drought resistance phenotypes. Overall, the HAI PP2Cs had greatest effect on ABA-independent low water potential phenotypes and lesser effect on classical ABA sensitivity phenotypes. Both this and their distinct PYL interaction demonstrate a new level of functional differentiation among the clade A PP2Cs and a point of cross talk between ABA-dependent and ABA-independent drought-associated signaling.


Figures
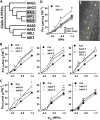
Figure 1.
Figure 1.
HAI PP2Cs are negative regulators of low-Ψw-induced Pro accumulation. A, Diagram showing the positions of the HAI PP2Cs (shaded) relative to other clade A PP2Cs. The diagram is adapted from the phylogenetic analysis of Schweighofer et al. (2004). T-DNA mutants used for our analyses are described in Supplemental Figure S1. B, Pro contents of the wild type (Col) and HAI PP2C mutants. Seven-day-old seedlings were transferred to PEG-infused agar plates of the indicated Ψw and Pro contents measured 96 h after transfer. Data are means ± se (n = 9–12) combined from three independent experiments. Significant differences of mutant versus the wild type (P ≤ 0.05) at a particular Ψw are marked by asterisks. Data from twice-backcrossed lines of hai3-1 are also presented and represent means of three homozygous lines selected after backcrossing. FW, Fresh weight. C, Pro contents of other clade A PP2C mutants. The T-DNA mutants of ABI1 and ABI2 are referred to as abi1td and abi2td to clearly distinguish them from the dominant negative alleles of these genes. Data presentation is the same as in B. D, Pro content of the hai1-2 mutant complemented with 35S-YFP:HAI1. Data from three independent T3 homozygous lines are shown along with the Col wild type and the hai1-2 mutant. Data are means ± se (n = 6–9) combined from two independent experiments. E, Subcellular localization of YFP:HAI1. The image is from the root of a representative 35S-YFP:HAI1 transgenic line. Bar = 20 μm.
Figure 2.
Figure 2.
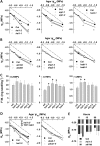
Mutants of the HAI PP2Cs have increased osmoregulatory solute accumulation and fresh weight at low Ψw. A, Ψs of HAI PP2C mutants measured 96 h after transfer of 7-d-old seedlings to PEG-infused plates of a range of Ψw. Data are plotted as the osmotic potential versus the agar water potential measured at the time of sample collection. The dashed line in each panel plots where agar Ψw = seedling Ψs. Points below the dashed line are consistent with a positive turgor pressure, as more reduced Ψs indicates greater accumulation of osmotically active solutes. Data are means ± se (n = 3–5) of measurements combined from two to three independent experiments. Significant differences between the mutant and the wild type (P ≤ 0.05) are indicated by asterisks. B, Ψs of ABA signaling clade A PP2Cs. Data presentation is as described for A. C, Seedling fresh weight (F.W.) measured 96 h after transfer of wild-type and mutant seedlings to a high-Ψw control (−0.25 MPa), an intermediate Ψw (−0.7 MPa), or more severe low Ψw (−1.2 MPa) treatment. Data are means ± se (n = 3–5) combined from two to three independent experiments. Significant differences between the mutant and the wild type (P ≤ 0.05) are indicated by asterisks. D, Seedling Ψs of hai1-2 complemented with 35S-YFP:HAI1 (left panel; data of three independent T3 homozygous lines are shown) as well as p5cs1-4, which has reduced Pro accumulation, and aba2-1, which is ABA deficient (right panel). Experimental procedures and data presentation are as described for A. E, Effect of ABA treatment (5 μm) on Ψs. Seven-day-old seedlings were transferred to ABA-containing plates, and Ψs was measured 10 and 96 h later. Data are means ± se (n = 3–5) combined from two independent experiments.
Figure 3.
Figure 3.
hai1-2 has increased osmotic adjustment during soil drying, while neither it nor other HAI PP2Cs substantially affect leaf water loss. A and B, Ψs and RWC of the wild type (Col) and hai1-2 before water with holding (day 0) and 6 to 12 d after the start of water withholding. The two genotypes were grown together in the same pots to ensure that they were exposed to the same Ψw, and the inset shows the mean soil Ψw at various times after water withholding. Data are means ± se (n = 3–9) from two to three independent experiments. Significant differences between the mutant and the wild type (P ≤ 0.05) are indicated by asterisks. Photographs of representative plants during soil drying can be seen in Supplemental Figure S5. C and D, Water loss from detached leaves of the wild type (Col), HAI PP2C mutants, and an ABI1 T-DNA mutant (abi1td). Data are means ± se (n = 3–6) from two to three independent experiments. Significant differences between the mutant and the wild type (P ≤ 0.05) are indicated by asterisks. F.W., Fresh weight.
Figure 4.
Figure 4.
Abiotic stress-associated genes up-regulated and defense genes down-regulated in hai1-2. A, Cluster of coexpressed genes up-regulated in hai1-2. Coexpression-based clustering was performed using a database of 3,800 arrays (see “Materials and Methods”). Each edge connecting two genes represents a coexpression relationship having a Pearson correlation coefficient ≥ 0.75. See Supplemental Tables S3 and S5 for full lists of genes up-regulated in hai1-2 relative to the Col wild type under either control or low-Ψw conditions. UNK, Gene of unknown function. B, Quantitative RT-PCR verification of genes found to be more highly expressed in hai1-2 at low Ψw by microarray analysis. The genes analyzed along with gene descriptions are given in Supplemental Table S5. Gene expression analysis was performed for Col wild-type (w.t.) and hai1-2 seedlings under control conditions or 96 h after transfer to low Ψw (−1.2 MPa). Data are means ± se (n = 3) using samples collected from three independent experiments. All gene expression differences at −1.2 MPa were found to be significant (P ≤ 0.05) by one-sided t test. Note that XERO2, NAC19, and NAC40 are not part of the coexpression cluster shown in A. C, Cluster of coexpressed genes down-regulated in hai1-2. Analysis was performed as described for A. The full set of coexpressed clusters of genes down-regulated in hai1-2 can be seen in Supplemental Figure S6, and the full list of genes down-regulated in hai1-2 relative to the Col wild type is shown in Supplemental Tables S4 and S6. D, Quantitative RT-PCR verification of genes found to have reduced expression in hai1-2 at low Ψw by microarray analysis. Procedures and data presentation are as described for B. The genes analyzed along with gene descriptions are given in Supplemental Table S6.
Figure 5.
Figure 5.
HAI PP2C double and triple mutants have ABA-insensitive seed germination. Germination was scored based on radicle emergence 4 d after the end of stratification. Data are means ± se (n = 3–4) from independent experiments. Significant differences between the mutant and the wild type (P ≤ 0.05) are indicated by asterisks. For comparison, germination assays of the ABA signaling clade A PP2Cs conducted under the same conditions can be seen in Supplemental Figure S8.
Figure 6.
Figure 6.
HAI PP2C double and triple mutants have postgermination ABA hypersensitivity similar to that of single mutants of other clade A PP2Cs. A, Green cotyledon emergence of the wild type, HAI PP2C mutants, and ahg1-3, which is shown for comparison. Seeds of each genotype were plated on control medium or medium containing 0.5 μm ABA, and photographs were taken after 8 d of growth. B, Quantification of green cotyledon emergence after 5 d of growth for all genotypes shown in A. Data are means ± se (n = 3) combined from three independent experiments. Significant differences of the mutant versus the wild type are marked by asterisks. C, Four-day-old seedlings were transferred to the indicated ABA concentration, and root elongation of Col wild-type and mutant seedlings was measured over the subsequent 7 d. Data are means ± se (n = 10–15) combined from three independent experiments. Significant differences of the mutant versus the wild type at a particular ABA concentration are marked by asterisks. D, Photographs of representative mutant and wild-type seedlings 7 d after transfer to control (no ABA) plates (top panel) or plates containing 2 μm ABA (bottom panel). E, Root elongation of abi1td and abi2td assayed for comparison with HAI PP2C data in C. F, Expression of the ABA-responsive genes NCED3 and COR15A in the Col wild type, HAI PP2C mutants, and abi1td. Seven-day-old seedlings were transferred to control medium or medium containing 5 μm ABA for 10 h. Data are means ± se (n = 3) combined from two independent experiments. Significant differences of the mutant versus the wild type are marked by asterisks.
Figure 7.
Figure 7.
Differing PYL interactions of the HAI PP2Cs and the ABA signaling PP2C HAB1. A, Colony-lift β-galactosidase staining assay comparing the PYL interaction of HAI1 and ΔNHAB1 (N-terminal deletion construct) without ABA or with 10 μm ABA added to the yeast culture. Note that the colony lifts for HAB1 were incubated for 2 to 3 h while those of HAI1 were incubated longer (12 h or overnight) to allow the weaker HAI1 interactions to be seen with similar staining intensity. B, Quantitative yeast two-hybrid assay of PYL interactions of HAI1 (full length), ΔN-AIP1, and HAI3 (full length) either without ABA or with 10 μm ABA added to the yeast culture. Note the difference in scale between the top panel (HAI1) and the other two panels. Insets show selected data replotted using an expanded y axis scale for clarity. Data are means ± sd of β-galactosidase activity from three to four independent yeast colonies. C, Repeated quantitative yeast two-hybrid assays testing PYL5, PYL7, PYL8, or PYL10 interaction with all four PP2Cs in the same experiment. Data are means ± sd from three to four independent yeast colonies. Note the difference in scale between the different panels.
Figure 8.
Figure 8.
Differing patterns of PP2C and PYL expression at low Ψw. A, Effect of low Ψw on gene expression of clade A PP2Cs in the Col wild type. Data are from the microarray analysis described in Figure 4 and are shown as means ± sd from three experiments. B, Effect of low Ψw on PYL expression in the Col wild type from the microarray analysis. ND, Not detected. C, Quantitative RT-PCR was conducted on samples 0, 10, or 96 h after transfer of 7-d-old seedlings to −1.2 MPa low-Ψw treatment. Data are normalized to the expression level at time 0 for both the Col wild type and aba2-1 and are means ± se (n = 3–4) of samples collected from three or four independent experiments.
Figure 9.
Figure 9.
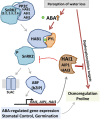
Model of HAI PP2C function during low-Ψw stress. Perception of water loss by the plant elicits ABA accumulation that causes the activity of clade A PP2Cs, such as HAB1, to be inhibited by ABA-stimulated PYL interaction. This, in turn, allows SnRK2 kinases to remain active and phosphorylate targets such as ABF transcription factors controlling ABA-dependent gene expression and guard cell slow anion channel (SLAC) ion channels influencing stomatal aperture. Expression of the HAI PP2Cs is induced in a partially ABA-dependent manner. Because of their highly induced expression and limited PYL interaction, the HAI PP2Cs can remain active and act in feedback regulation of ABA signaling, possibly through dephosphorylation of SnRK2s (Fujita et al., 2009; Antoni et al., 2012). However, the more prominent role of the HAI PP2Cs, particularly HAI1, is in attenuating the low-Ψw signaling controlling Pro and osmoregulatory solute accumulation. The specific PYL interaction pattern of HAI PP2Cs also suggests differences in their substrate recognition. Such differential recognition of substrates in low Ψw and ABA signaling may be a basis for cross talk between these two types of signaling mediated by the clade A PP2Cs.

References

    1. Alexa A, Rahnenführer J, Lengauer T. (2006) Improved scoring of functional groups from gene expression data by decorrelating GO graph structure. Bioinformatics 22: 1600–1607 - PubMed
    1. Antoni R, Gonzalez-Guzman M, Rodriguez L, Rodrigues A, Pizzio GA, Rodriguez PL. (2012) Selective inhibition of clade A phosphatases type 2C by PYR/PYL/RCAR abscisic acid receptors. Plant Physiol 158: 970–980 - PMC - PubMed
    1. Bates LS, Waldren RP, Teare ID. (1973) Rapid determination of free proline for water-stress studies. Plant Soil 39: 205–207
    1. Blum A. (2005) Drought resistance, water-use efficiency and yield potential\x{2014}are they compatible, dissonant, or mutually exclusive? Aust J Agric Res 56: 1159–1168
    1. Brandt B, Brodsky DE, Xue S, Negi J, Iba K, Kangasjärvi J, Ghassemian M, Stephan AB, Hu H, Schroeder JI. (2012) Reconstitution of abscisic acid activation of SLAC1 anion channel by CPK6 and OST1 kinases and branched ABI1 PP2C phosphatase action. Proc Natl Acad Sci USA 109: 10593–10598 - PMC - PubMed

Publication types

MeSH terms