

The fallacy of ratio correction to address confounding factors
- PMID: 22829707
- PMCID: PMC4152922
- DOI: 10.1258/la.2012.012003
The fallacy of ratio correction to address confounding factors
Abstract
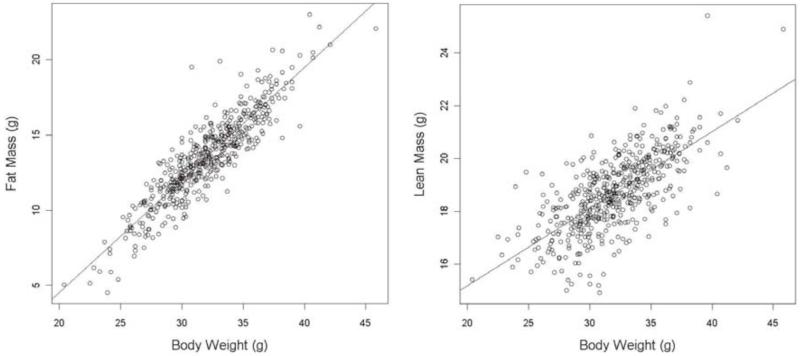
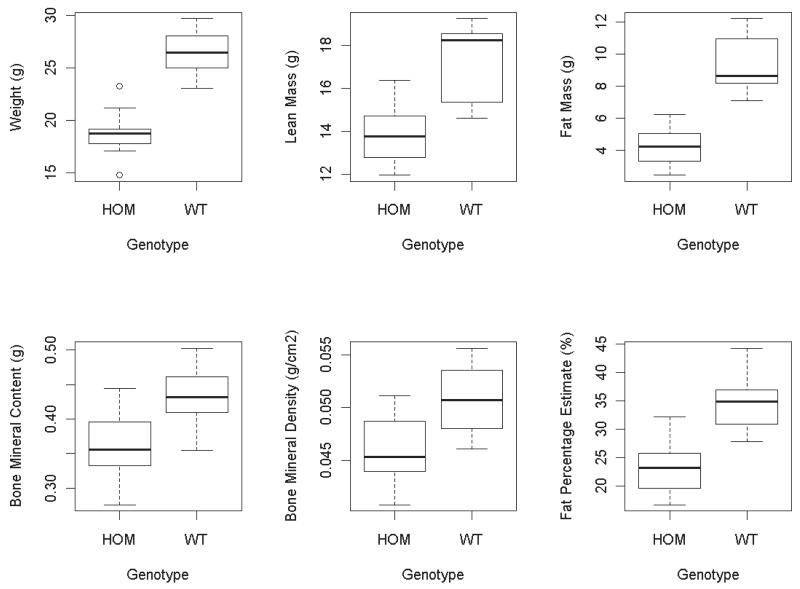
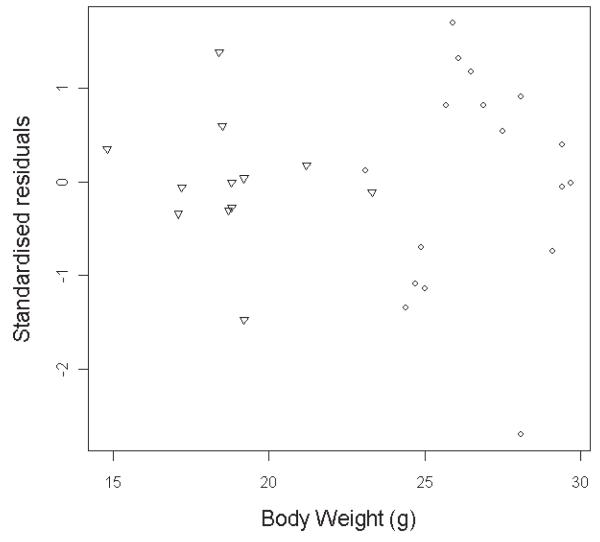
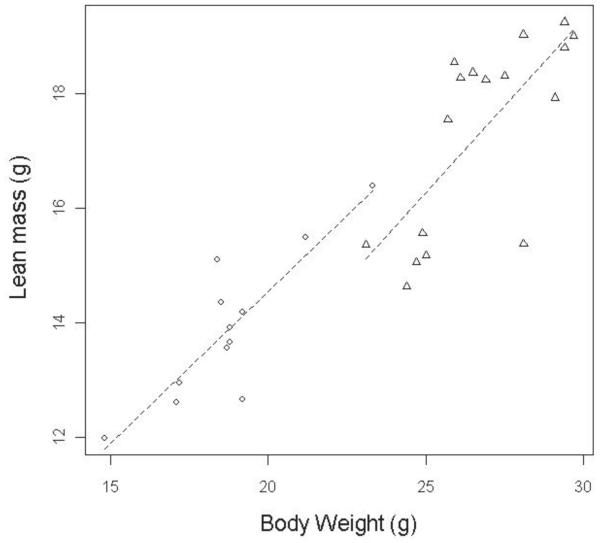
Scientists aspire to measure cause and effect. Unfortunately confounding variables, ones that are associated with both the probable cause and the outcome, can lead to an association that is true but potentially misleading. For example, altered body weight is often observed in a gene knockout; however, many other variables, such as lean mass, will also change as the body weight changes. This leaves the researcher asking whether the change in that variable is expected for that change in weight. Ratio correction, which is often referred to as normalization, is a method used commonly to remove the effect of a confounding variable. Although ratio correction is used widely in biological research, it is not the method recommended in the statistical literature to address confounding factors; instead regression methods such as the analysis of covariance (ANCOVA) are proposed. This method examines the difference in means after adjusting for the confounding relationship. Using real data, this manuscript demonstrates how the ratio correction approach is flawed and can result in erroneous calls of significance leading to inappropriate biological conclusions. This arises as some of the underlying assumptions are not met. The manuscript goes on to demonstrate that researchers should use ANCOVA, and discusses how graphical tools can be used readily to judge the robustness of this method. This study is therefore a clear example of why assumption testing is an important component of a study and thus why it is included in the Animal Research: Reporting of In Vivo Experiment (ARRIVE) guidelines.
Figures
References
-
- Wright DB. Comparing groups in a before-after design: When t test and ANCOVA produce different results. Brit J Educ Psychol. 2006;76:663–75. - PubMed
-
- Yin FC, Spurgeon HA, Rakusan K, Weisfeldt ML, Lakatta EG. Use of tibial length to quantify cardiac hypertrophy: application in the aging rat. The American journal of physiology. 1982;243(6):H941–7. - PubMed
-
- Whitnall M, Survo Rahmanto Y, Sutak R, Xu X, Becker EM, Mikhael MR, et al. The MCK mouse heart model of Friedreich’s ataxia: Alterations in iron-regulated proteins and cardiac hypertrophy are limited by iron chelation. Proceedings of the National Academy of Sciences of the United States of America. 2008;105(28):9757–62. - PMC - PubMed
Publication types
MeSH terms
Grants and funding
LinkOut - more resources
Full Text Sources
Molecular Biology Databases
Miscellaneous
