Meta-Analysis
. 2012;8(7):e1002655.
doi: 10.1371/journal.pgen.1002655. Epub 2012 Jul 19.

Evidence of inbreeding depression on human height

Ruth McQuillan  1 Niina EklundNicola PirastuMaris KuningasBrian P McEvoyTõnu EskoTanguy CorreGail DaviesMarika KaakinenLeo-Pekka LyytikäinenKati KristianssonAki S HavulinnaMartin GögeleVeronique VitartAlbert TenesaYurii AulchenkoCaroline HaywardAsa JohanssonMladen BobanSheila UliviAntonietta RobinoVesna BoraskaWilmar IglSarah H WildLina ZgagaNajaf AminEvropi TheodoratouOzren PolašekGiorgia GirottoLorna M LopezCinzia SalaJari LahtiTiina LaatikainenInga ProkopenkoMart KalsJorma ViikariJian YangAnneli PoutaKarol EstradaAlbert HofmanNelson FreimerNicholas G MartinMika KähönenLili MilaniMarkku HeliövaaraErkki VartiainenKatri RäikkönenCorrado MasciulloJohn M StarrAndrew A HicksLaura EspositoIvana KolčićSusan M FarringtonBen OostraTatijana ZemunikHarry CampbellMirna KirinMarina PehlicFlavio FaletraDavid PorteousGiorgio PistisElisabeth WidénVeikko SalomaaSeppo KoskinenKrista FischerTerho LehtimäkiAndrew HeathMark I McCarthyFernando RivadeneiraGrant W MontgomeryHenning TiemeierAnna-Liisa HartikainenPamela A F MaddenPio d'AdamoNicholas D HastieUlf GyllenstenAlan F WrightCornelia M van DuijnMalcolm DunlopIgor RudanPaolo GaspariniPeter P PramstallerIan J DearyDaniela TonioloJohan G ErikssonAntti JulaOlli T RaitakariAndres MetspaluMarkus PerolaMarjo-Riitta JärvelinAndré UitterlindenPeter M VisscherJames F WilsonROHgen Consortium
Affiliations
Meta-Analysis

Evidence of inbreeding depression on human height

Ruth McQuillan et al. PLoS Genet. 2012.

Abstract

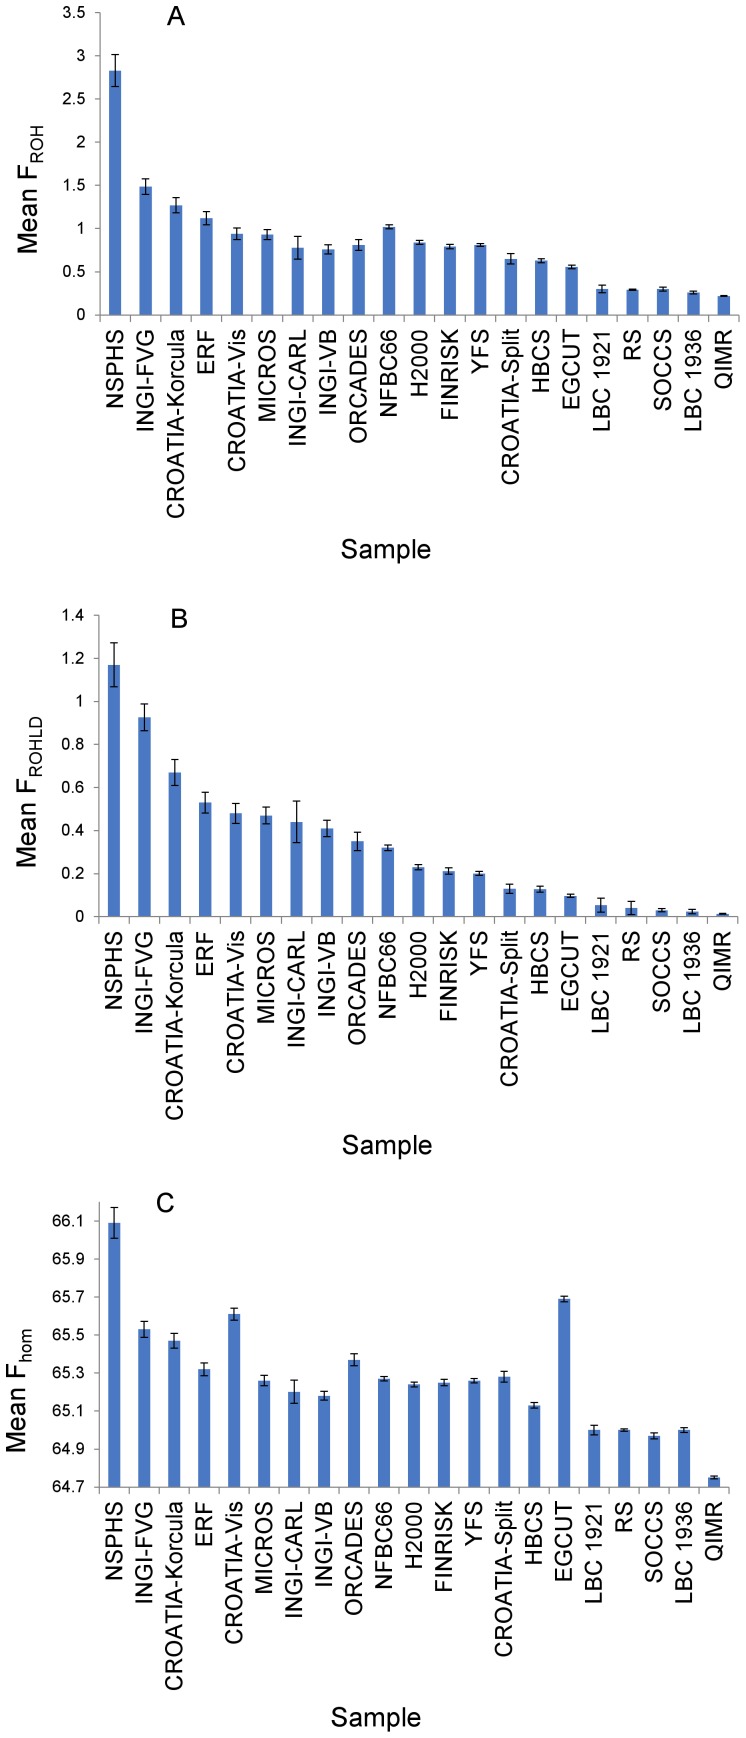
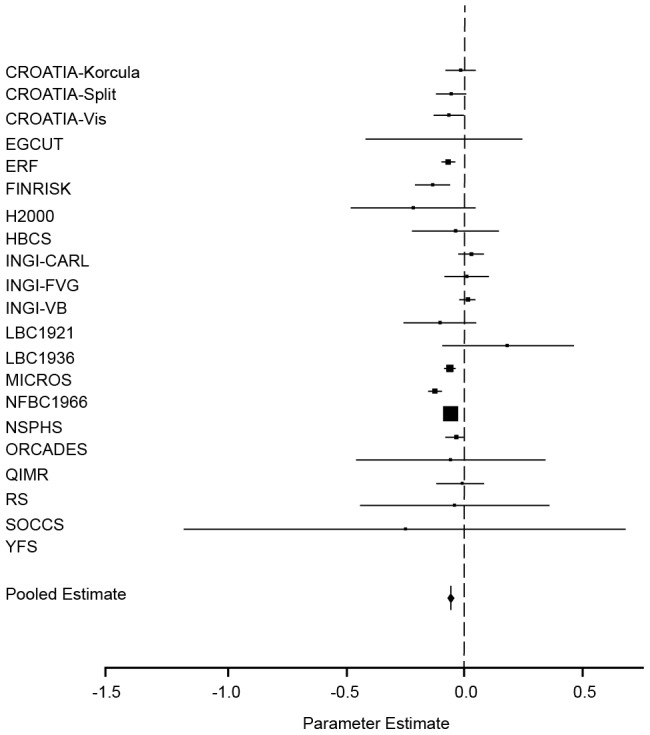
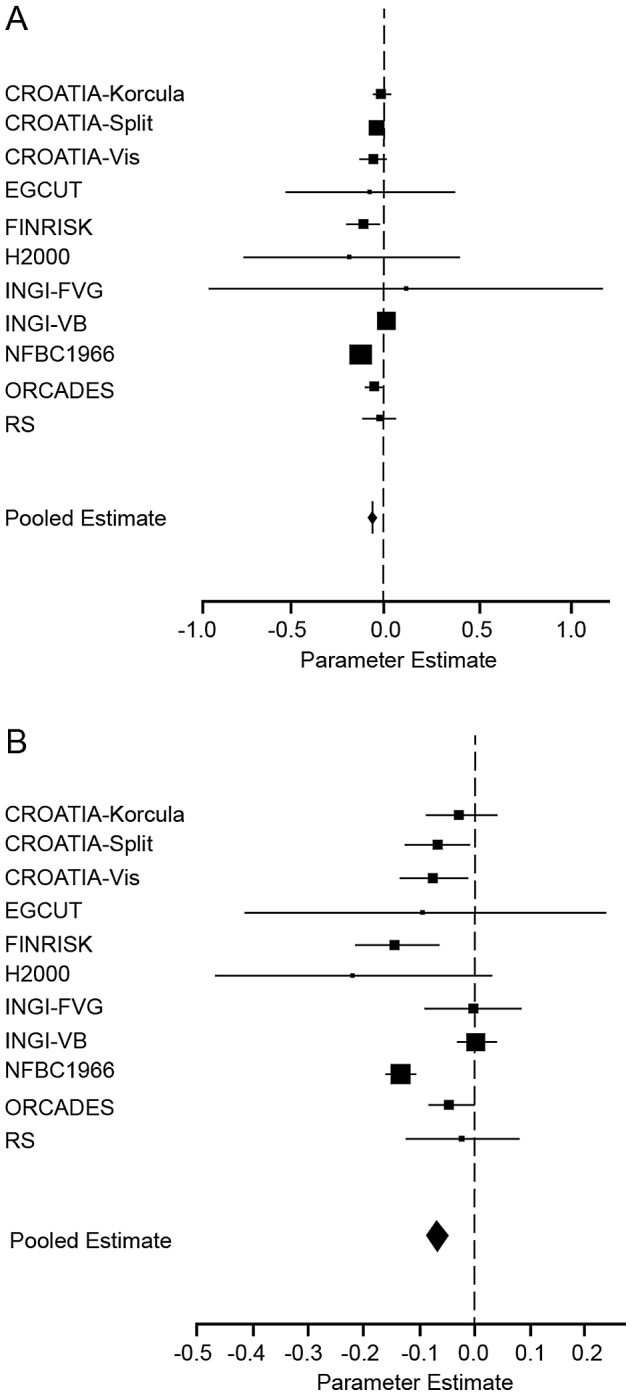
Stature is a classical and highly heritable complex trait, with 80%-90% of variation explained by genetic factors. In recent years, genome-wide association studies (GWAS) have successfully identified many common additive variants influencing human height; however, little attention has been given to the potential role of recessive genetic effects. Here, we investigated genome-wide recessive effects by an analysis of inbreeding depression on adult height in over 35,000 people from 21 different population samples. We found a highly significant inverse association between height and genome-wide homozygosity, equivalent to a height reduction of up to 3 cm in the offspring of first cousins compared with the offspring of unrelated individuals, an effect which remained after controlling for the effects of socio-economic status, an important confounder (χ(2) = 83.89, df = 1; p = 5.2 × 10(-20)). There was, however, a high degree of heterogeneity among populations: whereas the direction of the effect was consistent across most population samples, the effect size differed significantly among populations. It is likely that this reflects true biological heterogeneity: whether or not an effect can be observed will depend on both the variance in homozygosity in the population and the chance inheritance of individual recessive genotypes. These results predict that multiple, rare, recessive variants influence human height. Although this exploratory work focuses on height alone, the methodology developed is generally applicable to heritable quantitative traits (QT), paving the way for an investigation into inbreeding effects, and therefore genetic architecture, on a range of QT of biomedical importance.


Conflict of interest statement

The authors have declared that no competing interests exist.

Figures

Figure 1
Figure 1. Three alternative measures of mean homozygosity, with 95% confidence intervals, by population sample.
(A) shows mean FROH by population sample. FROH is defined as the percentage of the genotyped autosomal genome in ROH measuring at least 1.5 Mb. Mean values of FROH per population (with 95% confidence intervals) are: CROATIA-Korčula = 1.27 (1.18, 1.36); CROATIA-Split = 0.65 (0.59, 0.71); CROATIA-Vis = 0.94 (0.87,1.01); EGCUT = 0.56 (0.54, 0.58); ERF = 1.12 (1.04, 1.20); FINRISK = 0.79 (0.77, 0.82); HBCS = 0.63 (0.60, 0.65); H2000 = 0.84 (0.82, 0.86); INGI-CARL = 0.78 (0.65, 0.91); INGI-FVG = 1.49 (1.40, 1.58); INGI-VB = 0.76 (0.71, 0.81); LBC1921 = 0.30 (0.25, 0.35); LBC1936 = 0.26 (0.24, 0.28); MICROS = 0.93 (0.87, 0.99); NFBC1966 = 1.02 (1.00, 1.04); NSPHS = 2.83 (2.64, 3.02); ORCADES = 0.81 (0.75, 0.87); QIMR = 0.22 (0.21, 0.23); RS = 0.29 (0.28, 0.30); SOCCS = 0.30 (0.28, 0.32); YFS = 0.81 (0.79, 0.83). (B) shows mean FROHLD by population sample. FROHLD is defined as the percentage of the genotyped autosomal genome in ROH measuring at least 1.0 Mb, derived from a panel of independent SNPs. Mean values of FROHLD per population (with 95% confidence intervals) are: CROATIA-Korčula = 0.67 (0.61, 0.73); CROATIA-Split = 0.13 (0.11, 0.15); CROATIA-Vis = 0.48 (0.43, 0.53); EGCUT = 0.10 (0.09, 0.10); ERF = 0.53 (0.48, 0.58); FINRISK = 0.21 (0.20, 0.23); HBCS = 0.13 (0.11, 0.14); H2000 = 0.23 (0.22, 0.24); INGI-CARL = 0.44 (0.34, 0.54); INGI-FVG = 0.93 (0.86, 0.99); INGI-VB = 0.41 (037, 0.45); LBC1921 = 0.05 (0.02, 0.09); LBC1936 = 0.02 (0.01, 0.03); MICROS = 0.47 (0.43, 0.51); NFBC1966 = 0.32 (0.31, 0.33); NSPHS = 1.17 (1.07, 1.27); ORCADES = 0.35 (0.31, 0.39); QIMR = 0.013 (0.011, 0.015); RS = 0.04 (0.01, 0.07); SOCCS = 0.03 (0.02, 0.04); YFS = 0.20 (0.19, 0.21). (C) shows mean Fhom by population sample. Fhom is defined as the percentage of genotyped autosomal SNPs that are homozygous. Mean values of Fhom per population (with 95% confidence intervals) are: CROATIA-Korčula = 65.47 (65.43, 65.51); CROATIA-Split = 65.28 (65.25, 65.31); CROATIA-Vis = 65.61 (65.58, 65.64); EGCUT = 65.69 (65.68, 65.70); ERF = 65.32 (65.29, 65.35); FINRISK = 65.25 (65.23, 65.27); HBCS = 65.13 (65.12, 65.14); H2000 = 65.24 (65.23, 65.25); INGI-CARL = 65.20 (65.14, 65.26); INGI-FVG = 65.53 (65.49, 65.57); INGI-VB = 65.18 (65.16, 65.20); LBC1921 = 65.00 (64.97, 65.03); LBC1936 = 65.00 (64.99, 65.01); MICROS = 65.26 (65.23, 65.29); NFBC1966 = 65.27 (65.26, 65.28); NSPHS = 66.09 (66.01, 66.17); ORCADES = 65.37 (65.34, 65.40); QIMR = 64.75 (64.74, 64.76); RS = 65.00 (64.99, 65.01); SOCCS = 64.97 (64.95, 64.99); YFS = 65.26 (65.25, 65.27).
Figure 2
Figure 2. Forest plot of the effect of FROHLD on height.
Results of a meta-analysis of the association between FROHLD and height are shown for twenty-one population samples. The model was adjusted for age and sex in all samples. Additionally, it was adjusted for genomic kinship in samples with pairs of related individuals (CROATIA-Korčula, CROATIA-Split, CROATIA-Vis, ERF, FINRISK, HBCS, H2000, INGI-CARL, INGI-FVG, INGI-VB, MICROS, NFBC1966, NSPHS, ORCADES and YFS). The plot shows estimated effect sizes (solid squares) for each population, with 95% confidence intervals (horizontal lines). Each sample estimate is weighted by the inverse of the squared standard error of the regression coefficient, so that the smaller the standard error of the study, the greater the contribution it makes to the pooled regression coefficient. The area of the solid squares is proportional to the weighting given to each study in the meta-analysis. Effect sizes in z-score units (with 95% confidence intervals) are: CROATIA-Korčula = −0.02 (−0.09, 0.04); CROATIA-Split = −0.06 (−0.1, −0.002); CROATIA-Vis = −0.07 (−0.1, −0.01); EGCUT = −0.09 (−0.04, 0.2); ERF = −0.08 (−0.1, −0.05); FINRISK = −0.1 (−0.2, −0.07); HBCS = −0.04 (−0.2, 0.1); H2000 = −0.2 (−0.5, 0.04); INGI-CARL = 0.02 (−0.03, 0.07); INGI-FVG = −0.0001 (−0.08, 0.08); INGI-VB = 0.005 (−0.03, 0.04); LBC1921 = −0.1 (−0.3, 0.04); LBC1936 = 0.2 (−0.1, 0.4); MICROS = −0.06 (−0.08, −0.05); NFBC1966 = −0.1 (−0.2, −0.1); NSPHS = −0.07 (−0.07, −0.06); ORCADES = −0.04 (−0.08, 0.001); QIMR = −0.07 (−0.5, 0.3); RS = −0.02 (−0.1, 0.08); SOCCS = −0.05 (−0.4, 0.3); YFS = −0.3 (−1.2, 0.7).
Figure 3
Figure 3. Forest plot of the effect of FROHLD on height, adjusted for educational attainment.
Results of a meta-analysis of the association between FROHLD and height are shown for the eleven population samples which collected data on educational attainment. (A) shows the model adjusted for age, sex and educational attainment in all samples and additionally for genomic kinship in samples with pairs of related individuals (CROATIA-Korčula, CROATIA-Split, CROATIA-Vis, FINRISK, H2000, INGI-FVG, INGI-VB NFBC1966 and ORCADES). Effect sizes in z-score units (with 95% confidence intervals) are: CROATIA-Korčula = −0.02 (−0.07, 0.04); CROATIA-Split = −0.05 (−0.08, −0.01); CROATIA-Vis = −0.06 (−0.1, 0.02); EGCUT = −0.08 (−0.5, 0.4); FINRISK = −0.1 (−0.2, −0.03); H2000 = −0.2 (−0.8, 0.4); INGI-FVG = 0.1 (−1.0, 1.2); INGI-VB = 0.009 (−0.02, 0.04); NFBC1966 = −0.1 (−0.2, −0.1); ORCADES = −0.06 (−0.1, −0.007); RS = −0.02 (−0.1, 0.08). (B) shows the model adjusted for age and sex in all samples and additionally for genomic kinship in samples with pairs of related individuals (CROATIA-Korčula, CROATIA-Split, CROATIA-Vis, FINRISK, H2000, INGI-FVG, INGI-VB, NFBC1966 and ORCADES). Effect sizes and 95% confidence intervals are as in Figure 2. The plots show estimated effect sizes (solid squares) for each population, with 95% confidence intervals (horizontal lines). Each sample estimate is weighted by the inverse of the squared standard error of the regression coefficient, so that the smaller the standard error of the study, the greater the contribution it makes to the pooled regression coefficient. The area of the solid squares is proportional to the weighting given to each study in the meta-analysis.

References

    1. Cole TJ. The secular trend in human physical growth: a biological view. Econ Hum Biol. 2003;1:161–168. - PubMed
    1. Ogden CL, Fryar CD, Carroll MD, Flegal KM. Mean body weight, height, and body mass index, United States 1960–2002. Adv Data. 2004:1–17. - PubMed
    1. Macgregor S, Cornes BK, Martin NG, Visscher PM. Bias, precision and heritability of self-reported and clinically measured height in Australian twins. Hum Genet. 2006;120:571–580. - PubMed
    1. Preece MA. The genetic contribution to stature. Horm Res. 1996;45:56–58. - PubMed
    1. Silventoinen K, Kaprio J, Lahelma E, Koskenvuo M. Relative effect of genetic and environmental factors on body height: differences across birth cohorts among Finnish men and women. Am J Public Health. 2000;90:627–630. - PMC - PubMed

Publication types