. 2012;8(7):e1002825.
doi: 10.1371/journal.pgen.1002825. Epub 2012 Jul 19.

Histone H2B monoubiquitination facilitates the rapid modulation of gene expression during Arabidopsis photomorphogenesis

Affiliations

Histone H2B monoubiquitination facilitates the rapid modulation of gene expression during Arabidopsis photomorphogenesis

Clara Bourbousse et al. PLoS Genet. 2012.

Abstract

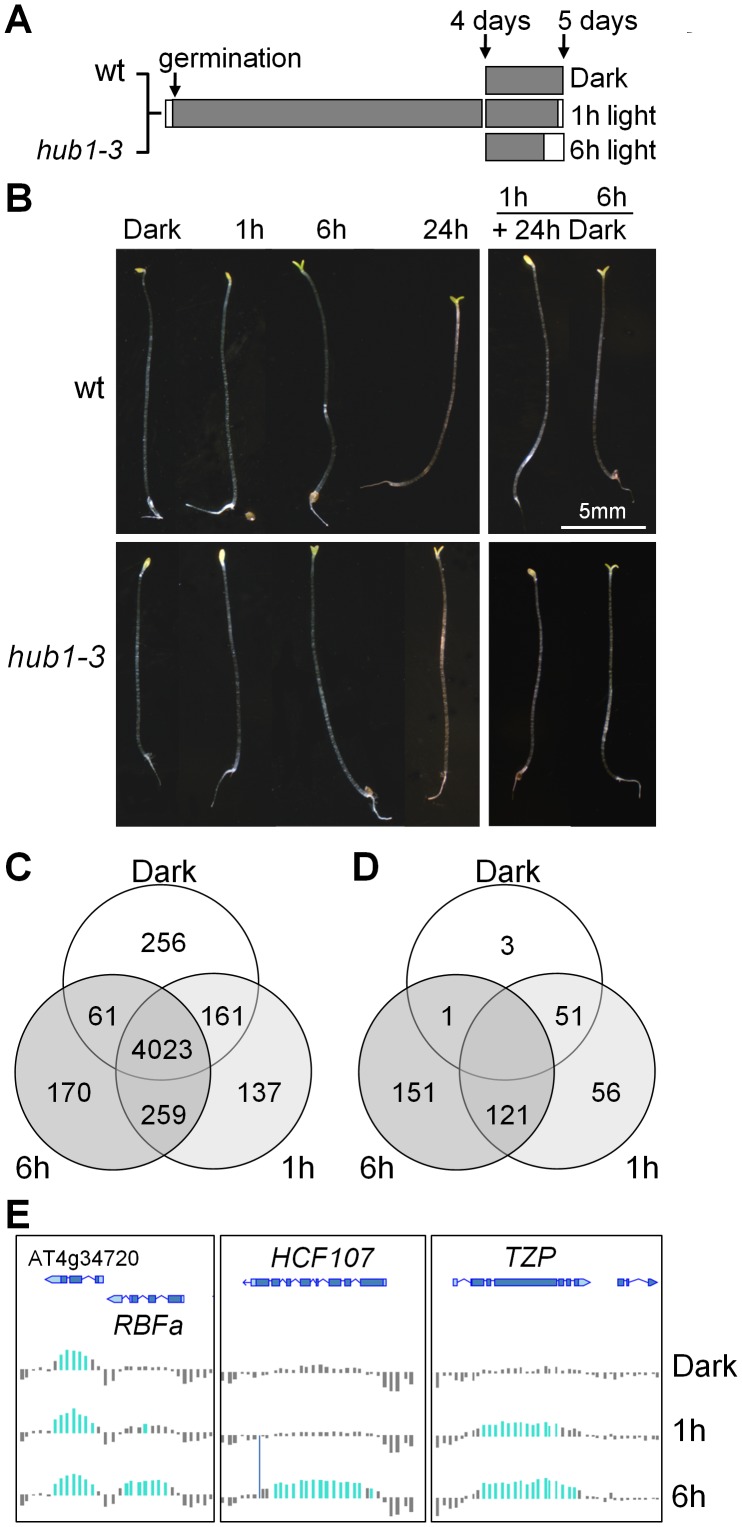
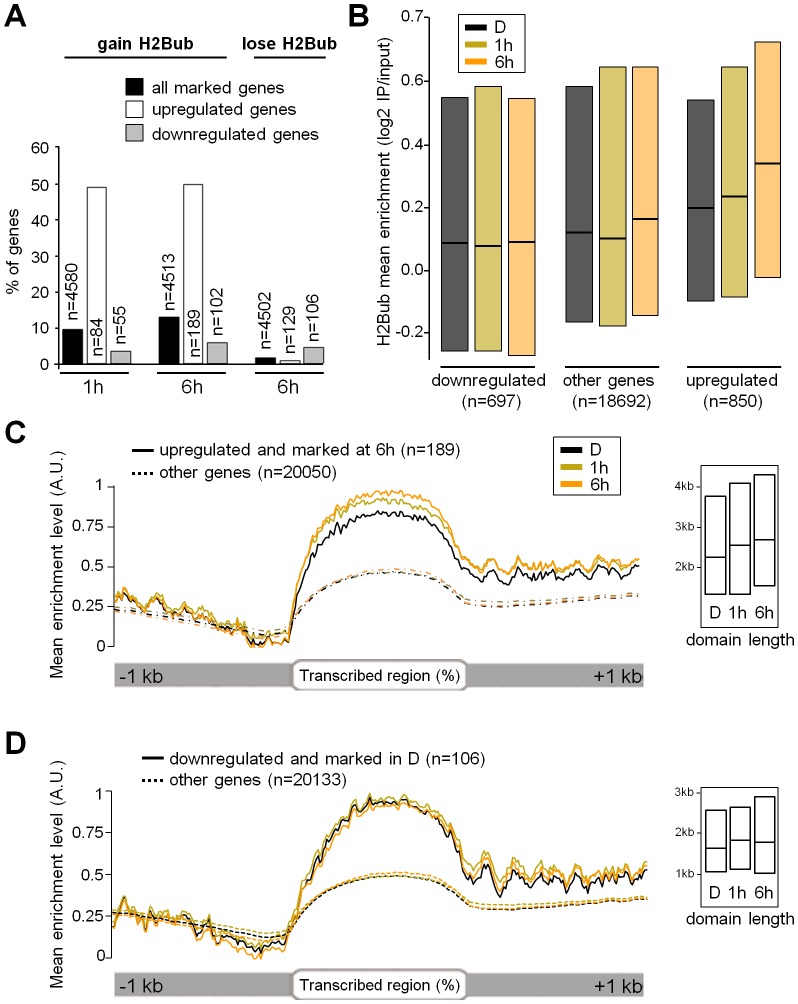
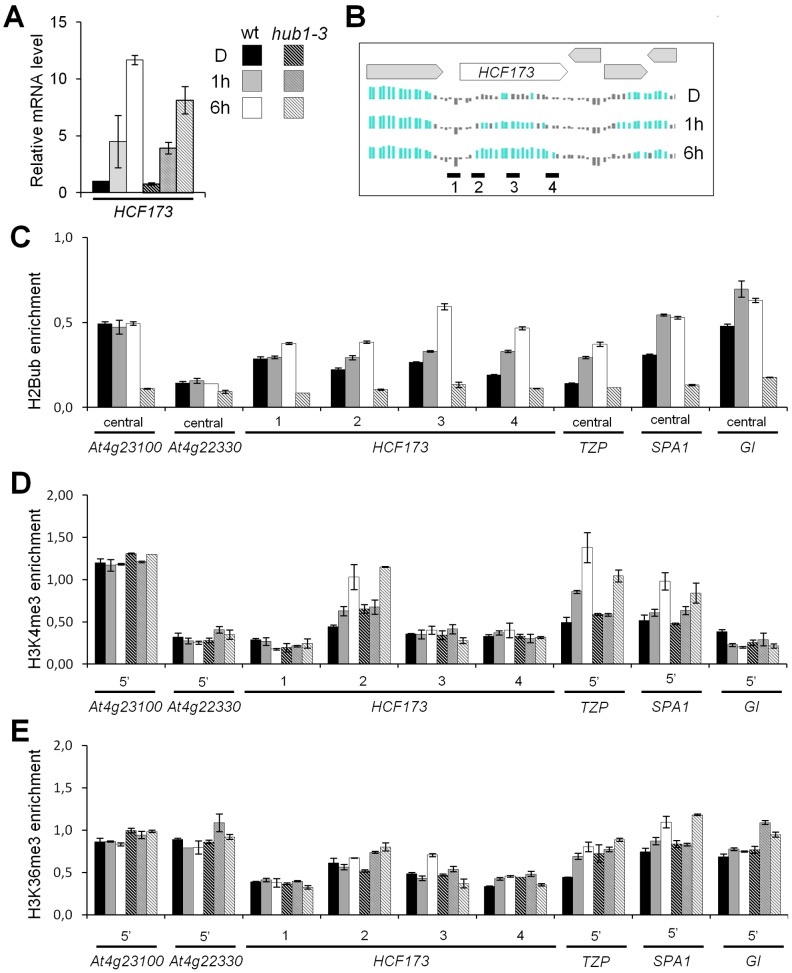
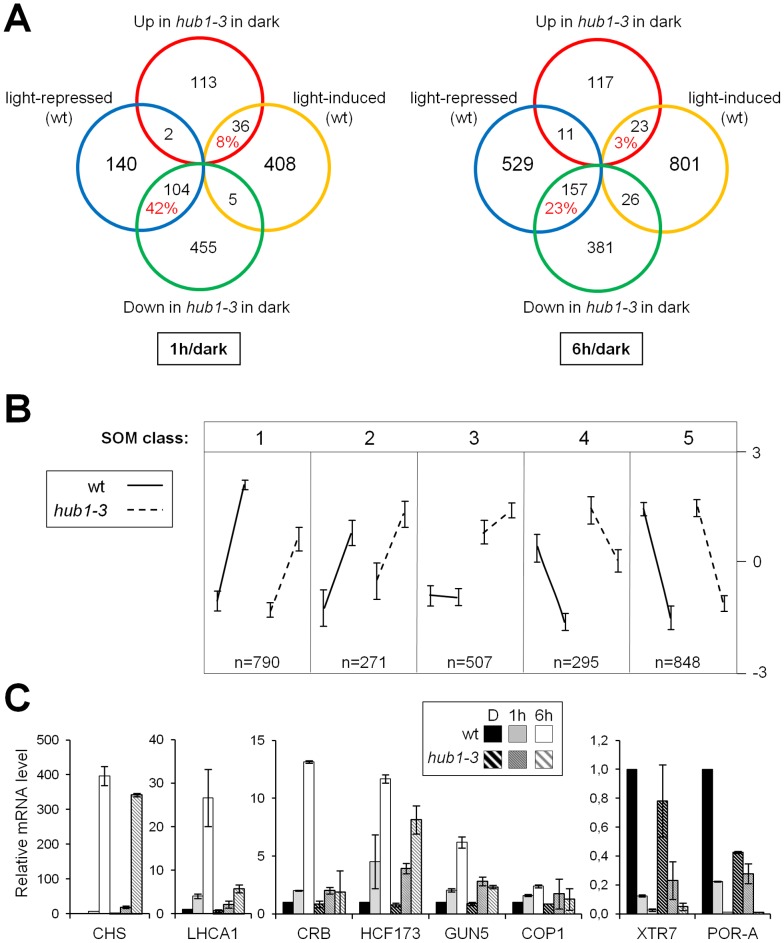
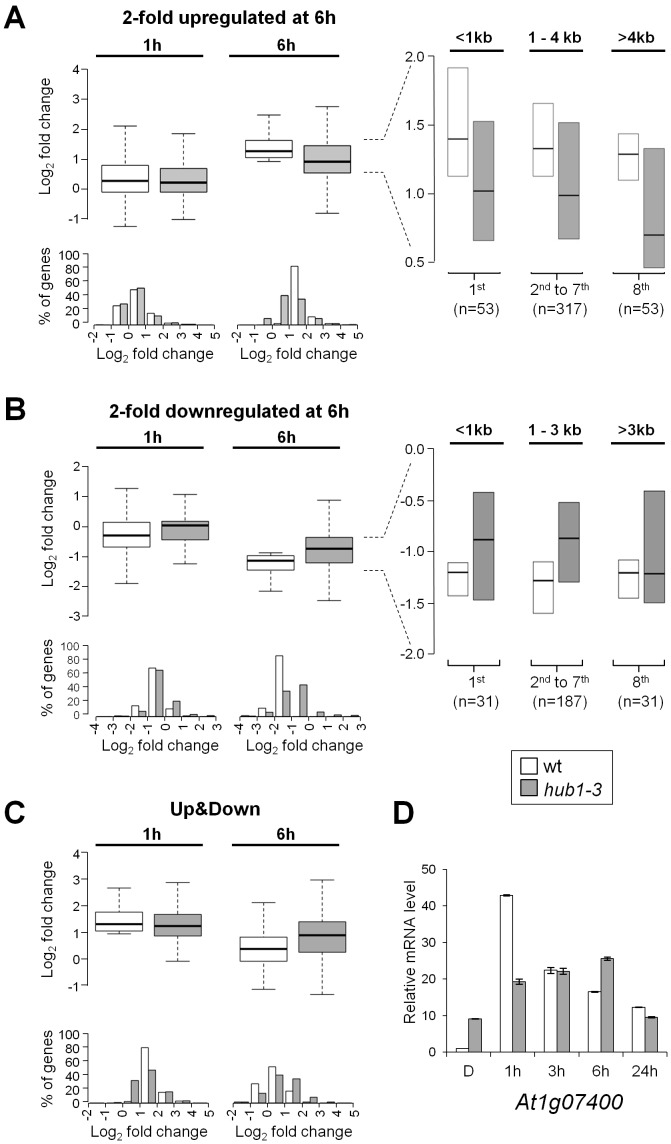
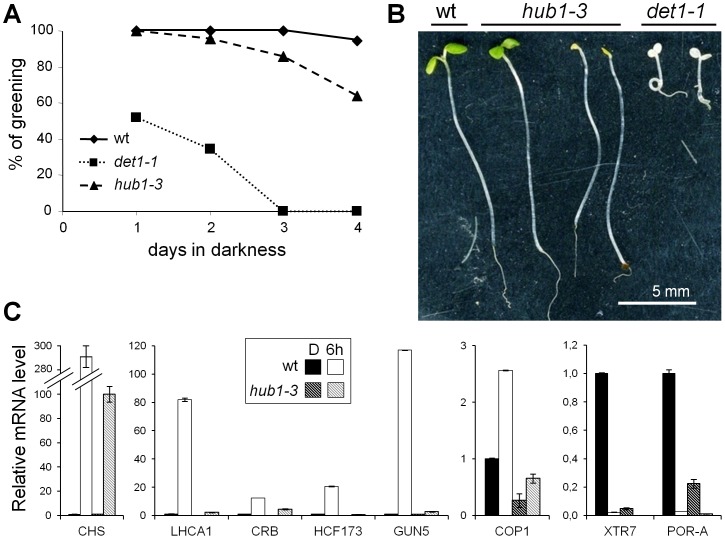
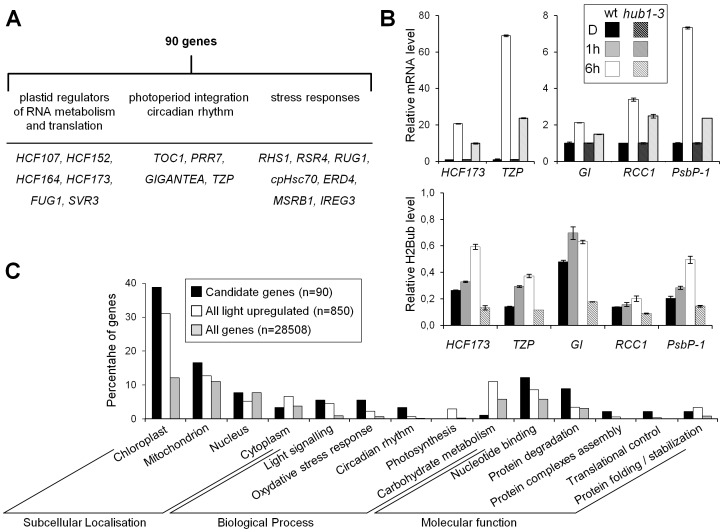
Profiling of DNA and histone modifications has recently allowed the establishment of reference epigenomes from several model organisms. This identified a major chromatin state for active genes that contains monoubiquitinated H2B (H2Bub), a mark linked to transcription elongation. However, assessment of dynamic chromatin changes during the reprogramming of gene expression in response to extrinsic or developmental signals has been more difficult. Here we used the major developmental switch that Arabidopsis thaliana plants undergo upon their initial perception of light, known as photomorphogenesis, as a paradigm to assess spatial and temporal dynamics of monoubiquitinated H2B (H2Bub) and its impact on transcriptional responses. The process involves rapid and extensive transcriptional reprogramming and represents a developmental window well suited to studying cell division-independent chromatin changes. Genome-wide H2Bub distribution was determined together with transcriptome profiles at three time points during early photomorphogenesis. This revealed de novo marking of 177 genes upon the first hour of illumination, illustrating the dynamic nature of H2Bub enrichment in a genomic context. Gene upregulation was associated with H2Bub enrichment, while H2Bub levels generally remained stable during gene downregulation. We further report that H2Bub influences the modulation of gene expression, as both gene up- and downregulation were globally weaker in hub1 mutant plants that lack H2Bub. H2Bub-dependent regulation notably impacted genes with fast and transient light induction, and several circadian clock components whose mRNA levels are tightly regulated by sharp oscillations. Based on these findings, we propose that H2B monoubiquitination is part of a transcription-coupled, chromatin-based mechanism to rapidly modulate gene expression.


Conflict of interest statement

The authors have declared that no competing interests exist.

Figures

Figure 1
Figure 1. Phenotypic and H2Bub epigenomic changes during de-etiolation.
(A) Experimental design for de-etiolation experiments. Wild-type and hub1-3 plants were grown in darkness for 5 days or shifted to light for the last 1 or 6 h for transcriptome and ChIP-chip analyses. (B) Representative phenotypes of plants grown in darkness and exposed to light for the indicated times (left panels). The right panels illustrate the phenotypes of seedlings transferred back to darkness for 24 h after 1 or 6 h of exposure to light. (C) Venn diagram giving the number of H2Bub-marked genes in each growth condition. (D) Venn diagram giving the number of genes that gain de novo or show a loss of the H2Bub mark during the 6 h window. Determination of the corresponding numbers is detailed in Figure S4. (E) Genome browser screenshot showing H2Bub levels at genomic loci displaying the light-induced genes HCF173, TZP and RBFa. Colored bars represent significant signals for H2Bub-enriched Nimblegen chip tiles normalized from two biological replicates.
Figure 2
Figure 2. Light-induced upregulation associates with H2Bub enrichment over transcribed regions.
(A) Histogram showing the percentage of genes gaining or losing the H2Bub mark for each indicated category of light-response (up– or downregulated). The analysis was restricted to the genes for which both epigenomic and transcriptomic data were available, and to the genes that were marked under the relevant condition (i.e., the genes marked at 6 h for H2Bub gain at 6 h) and their number is given in each bar. (B) Boxplot representation of mean H2Bub levels for all tiles corresponding to genes upregulated or downregulated by light at 6 h. Boxes show upper and lower quartiles of the data, and black lines represent the medians. Upregulated genes displayed increased levels of the H2Bub mark at 1 h (Wilcoxon rank-sum test; p-value = 2.757e-15) and 6 h (Wilcoxon rank-sum test; p-value<2.2e-16) compared to dark. Downregulated genes were poorly marked in darkness and showed no concomitant decrease in H2Bub level at 6 h (Wilcoxon rank-sum test; p-value = 0.2199). (C) Time-series distribution of H2Bub levels over genes that are upregulated by light and marked at 6 h (n = 189). Mean H2Bub levels from all tiles for genes in each category were plotted on a schematized gene scaled to accommodate different transcribed region lengths (represented from 0 to 100%). In each graph, the maximum value for the gene category with the highest peak is arbitrarily set to 1. The inset shows boxplot analyses for mean H2Bub domain length for each class of genes. (D) Time-series distribution of H2Bub levels over the genes that are marked in dark and downregulated by light (n = 106) represented as in (C).
Figure 3
Figure 3. Dynamics of H3K4me3 and H3K36me3 levels on genes exhibiting light-induced H2Bub enrichment.
(A) RT-qPCR analysis of HCF173 mRNA levels in wild-type and in hub1-3 mutant seedlings during de-etiolation. RNA levels are given relative to the wild-type dark sample (arbitrarily set to 1) and after normalization against At4g29130 and At2g36060 housekeeping genes. Error bars correspond to standard deviations from two biological replicates. (B) H2Bub levels at the HCF173 genomic locus on Nimblegen chip tiles normalized from two biological replicates. Neighboring genes are represented by grey boxes and qPCR amplicons along HCF173 gene promoter (1), 5′ end (2), central (3) and 3′ end (4) regions are represented by black dashes. (C–E) Relative enrichment of H2Bub, H3K4me3 and H3K36me3 on HCF173, TZP and SPA1 genes during de-etiolation. For each condition, ChIP-qPCR analyses were performed on the same chromatin extracts with the indicated antibodies and with anti-histone H3 to normalize levels to nucleosome occupancy. Because of the specific distribution of each histone mark, amplicons map the central domain of gene bodies for H2Bub analyses and map the 5′ part of gene bodies for H3K4me3 and H3K36me3. H2Bub ChIP analysis of hub1-3 extracts was used as a control for anti-H2Bub antibody specificity. GI (GIGANTEA) was used as control for a gene gaining H2Bub but not H3K4me3 during de-etiolation. Levels are given as percentages of IP/Input relative to the mean signals of two control genes (At4g23100 and At4g22330) with no changes in expression and in H2Bub levels in the three conditions.
Figure 4
Figure 4. Gene expression patterns in darkness and in response to light are affected in etiolated hub1-3 mutant seedlings.
(A) Genes misregulated in etiolated hub1-3 as compared to wild-type (at the dark time point) were compared with light-regulated gene sets defined in wild-type seedlings at 1 h or 6 h. For relevant comparisons, the percentage of genes for which the hub1-3 mutation mimics the effect of light on gene expression in darkness is given in red. (B) Clustering of gene expression data by Self Organizing Mapping (SOM). In each partition, the pattern reflects a general trend of expression gradient between 1 and 6 h of light for wild-type and hub1-3 seedlings. The four points in each partition represent the experimental conditions of the four microarrays (hub1-3/wild-type in dark not included in this analysis) and the vertical bars at each point show variance in the group. All genes are assigned to just a single class. (C) RT-qPCR validation of selected upregulated genes in SOM class 1 (left panels) or downregulated genes in SOM class 4 (right panel) during de-etiolation in wild-type and hub1-3 seedlings. RNA levels are given as in Figure 3A.
Figure 5
Figure 5. Expression kinetics of light-regulated genes are defective in hub1-3 mutant seedlings.
(A–C) Boxplot (upper panels) and histogram (lower panels) representation of expression changes of light-regulated genes at 1 and 6 h compared to dark. (A) Two-fold upregulated genes at 6 h (n = 423). (B) Two-fold downregulated genes at 6 h (n = 249). (C) Genes showing a rapid modulation of RNA levels, i.e., a 2-fold upregulation at 1 h followed by a downregulation at 6 h compared to 1 h (“Up&Down” genes, n = 162). Boxes show upper and lower quartiles of the data, and the medians are represented by black bars. Histograms show the frequency distribution of log2 expression ratios (x-axis) for wild-type (white) and hub1-3 (grey). The y-axis shows the percentage of genes corresponding to a given expression scale. The insets show genes differentially regulated by light at 6 h in wild-type and hub1-3 divided into 8 quantiles according to gene length, with the extreme groups (<1 kb, >3 kb or 4 kb) analyzed separately from the 6 mid-quantiles. (D) RT-qPCR analysis of a representative “Up&Down” class gene (At1g07400) during de-etiolation in wild-type and hub1-3 seedlings. Etiolated seedlings were harvested in darkness (D) or following the indicated time of illumination. RNA levels are given as in Figure 3A.
Figure 6
Figure 6. The hub1-3 mutant is affected in de-etiolation.
(A) Percentage of seedlings that undergo photomorphogenesis as a function of growth time in darkness prior to light exposure. Green and healthy plants were counted 3 days after constant illumination at 100 µm−2.m−2.s−1. (B) Representative phenotypes of bleached hub1-3 and det1-1 seedlings 3 days after transfer to light. (C) RT-qPCR analyses of selected upregulated (left and centre panels) and downregulated (right panel) genes in 2-day-old seedlings. Seedlings were harvested in darkness or 6 h after illumination. RNA levels are given as in Figure 3A.
Figure 7
Figure 7. Several genes potentially targeted for H2Bub selective regulation encode regulatory factors of light-driven responses.
(A) Candidate genes for H2Bub selective regulation. (B) Experimental validation of the selection criteria for HCF173, TZP, GIGANTEA (GI), RCC1 and PsbP-1 genes. RT-qPCR (upper panels) and ChIP-qPCR (lower panels) analyses show weak upregulation in the hub1-3 mutant and H2Bub enrichment in the wild-type upon 6 h of illumination. RNA levels at 6 h are given relative to the dark sample (arbitrarily set to 1) and after normalization against At4g29130 and At2g36060 housekeeping genes. For ChIP analyses, levels are given as in Figure 3C as percentages of IP/Input relative to the mean signals of two control genes (At4g23100 and At4g22330) and normalization to nucleosome occupancy determined by anti-H3 ChIPs. Error bars represent standard deviations from two replicates. The hub1-3 mutant serves as a control for antibody specificity. (C) Selected categories of Gene Ontology for the 90 candidates showing the over-representation of DNA-binding proteins, circadian clock components, and proteins involved in translational control, while components of the photosynthetic apparatus are under-represented.

Similar articles

Cited by

References

    1. Baker M. Making sense of chromatin states. Nat Methods. 2011;8:717–722. - PubMed
    1. Filion GJ, van Bemmel JG, Braunschweig U, Talhout W, Kind J, et al. Systematic protein location mapping reveals five principal chromatin types in Drosophila cells. Cell. 2010;143:212–224. - PMC - PubMed
    1. Liu T, Rechtsteiner A, Egelhofer TA, Vielle A, Latorre I, et al. Broad chromosomal domains of histone modification patterns in C. elegans. Genome Res. 2011;21:227–236. - PMC - PubMed
    1. Roudier F, Ahmed I, Berard C, Sarazin A, Mary-Huard T, et al. Integrative epigenomic mapping defines four main chromatin states in Arabidopsis. Embo J. 2011;30:1928–1938. - PMC - PubMed
    1. Greer EL, Maures TJ, Ucar D, Hauswirth AG, Mancini E, et al. Transgenerational epigenetic inheritance of longevity in Caenorhabditis elegans. Nature. 2011;479:365–371. - PMC - PubMed

Publication types

MeSH terms

Associated data