. 2012;7(7):e40573.
doi: 10.1371/journal.pone.0040573. Epub 2012 Jul 19.

Altered glucose homeostasis and hepatic function in obese mice deficient for both kinin receptor genes

Affiliations

Altered glucose homeostasis and hepatic function in obese mice deficient for both kinin receptor genes

Carlos C Barros et al. PLoS One. 2012.

Abstract

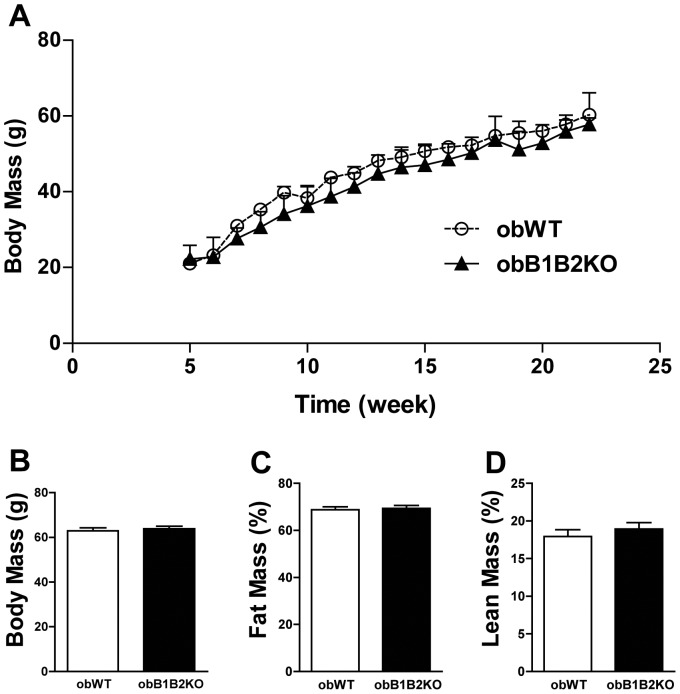
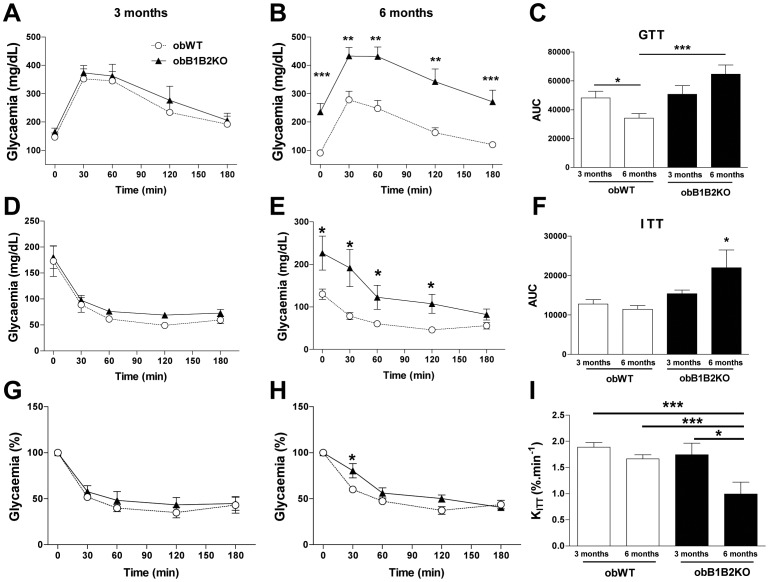
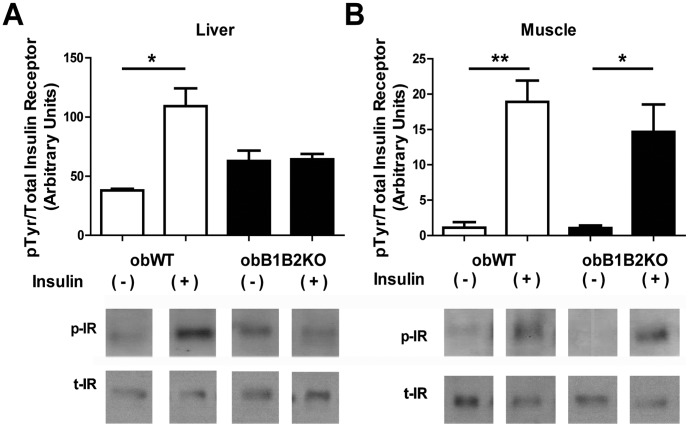
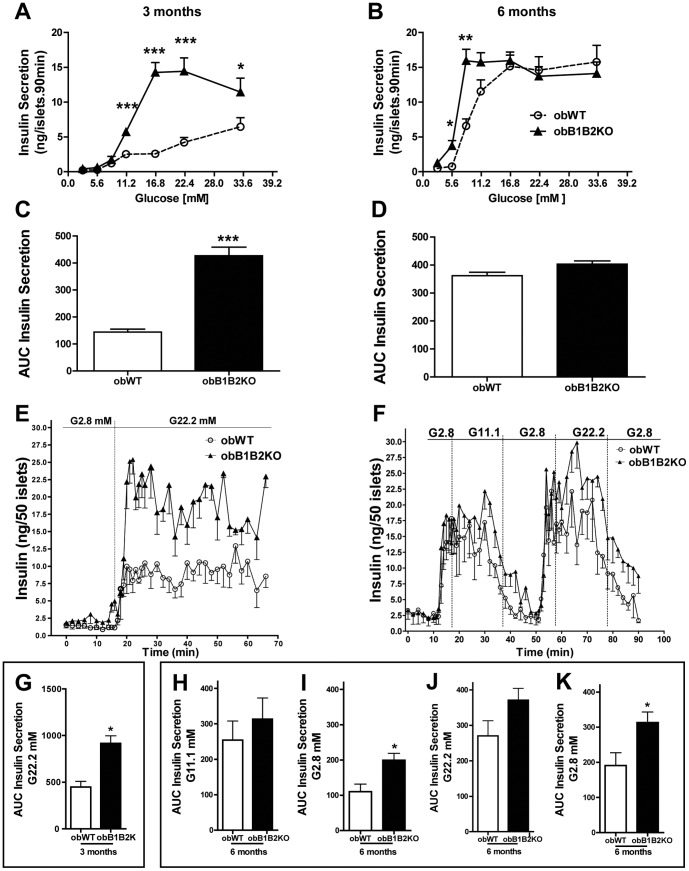
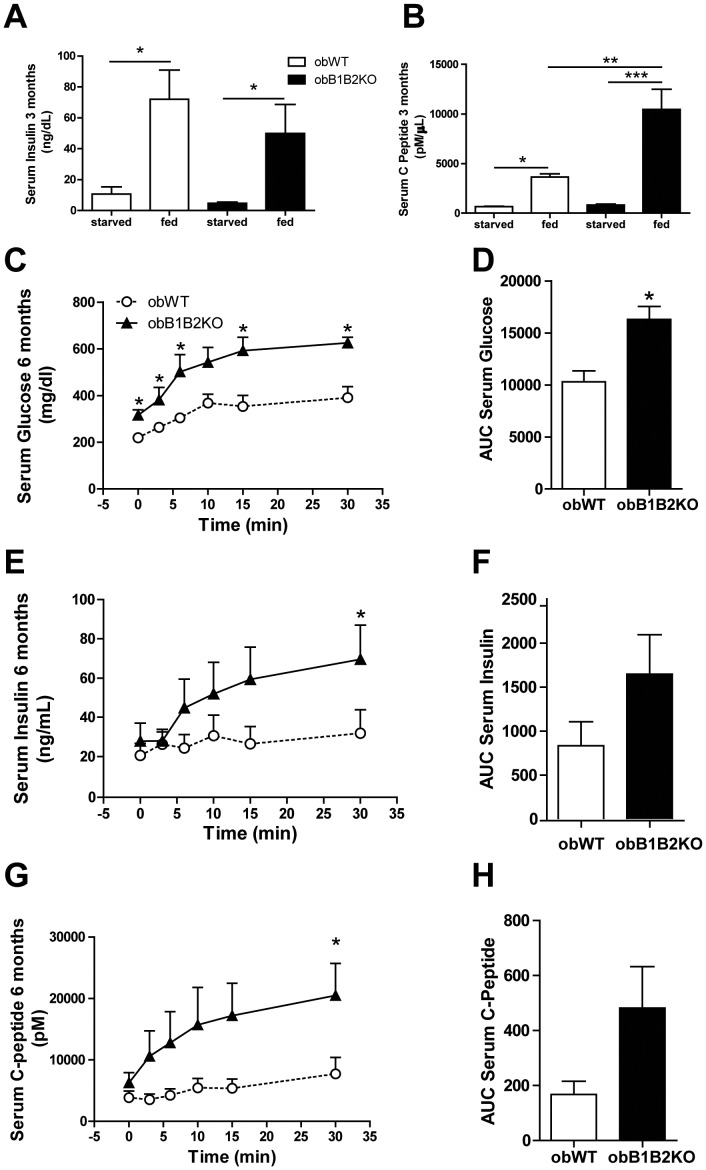
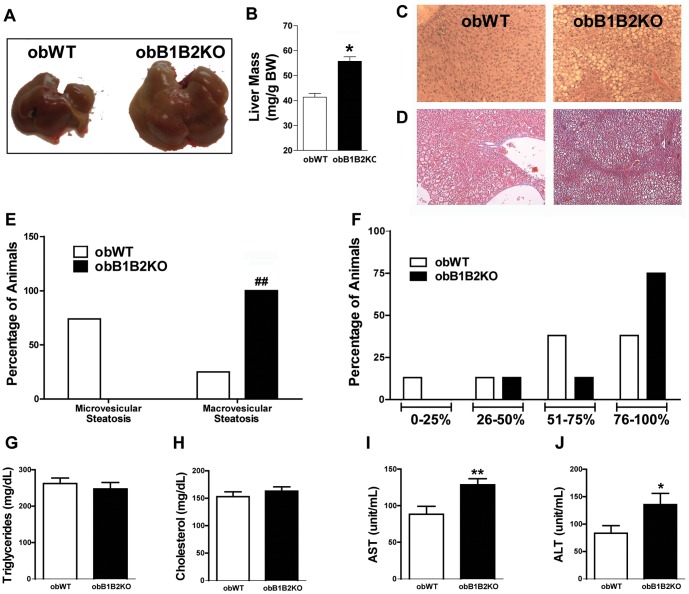
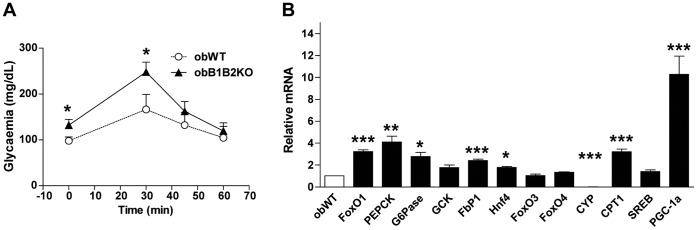
The Kallikrein-Kinin System (KKS) has been implicated in several aspects of metabolism, including the regulation of glucose homeostasis and adiposity. Kinins and des-Arg-kinins are the major effectors of this system and promote their effects by binding to two different receptors, the kinin B2 and B1 receptors, respectively. To understand the influence of the KKS on the pathophysiology of obesity and type 2 diabetes (T2DM), we generated an animal model deficient for both kinin receptor genes and leptin (obB1B2KO). Six-month-old obB1B2KO mice showed increased blood glucose levels. Isolated islets of the transgenic animals were more responsive to glucose stimulation releasing greater amounts of insulin, mainly in 3-month-old mice, which was corroborated by elevated serum C-peptide concentrations. Furthermore, they presented hepatomegaly, pronounced steatosis, and increased levels of circulating transaminases. This mouse also demonstrated exacerbated gluconeogenesis during the pyruvate challenge test. The hepatic abnormalities were accompanied by changes in the gene expression of factors linked to glucose and lipid metabolisms in the liver. Thus, we conclude that kinin receptors are important for modulation of insulin secretion and for the preservation of normal glucose levels and hepatic functions in obese mice, suggesting a protective role of the KKS regarding complications associated with obesity and T2DM.


Conflict of interest statement

Competing Interests: Dr. Araujo, Dr. Bacurau and Dr. Bader are PLoS ONE Editorial Board members. This does not alter the authors‘ adherence to all the PLoS ONE policies on sharing data and materials.

Figures

Figure 1
Figure 1. ObB1B2KO have similar body weight and body composition.
A) Growth curve showing the body weight of mice from 6 to 24 weeks of age; B) Average body weight of 30-week-old mice; C and D) Densitometry of obWT and obB1B2KO at the age of 25 weeks. Data are presented as means ± SEM; n >9.
Figure 2
Figure 2. Six-month-old obB1B2KO mice present higher glycemia and insulin resistance when compared to obWT.
A to C) Glucose tolerance test (GTT) of transgenic mice and controls; D to H) Absolute and relative values of the insulin tolerance test (ITT) of transgenic mice and controls. I) The constant rate of glucose disappearance (Kitt) calculated from “G” and “H”. Data are presented as means ± SEM. Student’s t-test: *, p<0.05; ***, p<0.001; n = 8.
Figure 3
Figure 3. Western blot analysis of liver and muscle insulin receptor phosphorylation.
Graphic and representative images of western blot analysis of phosphorylated insulin receptors (p-IR)/total insulin receptors (t-IR) of protein extracts from A) liver and B) muscle, after immunoprecipitation. Mice were starved for 12 hours overnight. After anesthesia with sodium thiopental, the abdomen was opened and insulin (+) or saline (−) were injected in the cava vein. Liver and muscle samples were collected 2 or 5 minutes after the injections. The data are presented as means ± SEM. *, p<0.05; **, p<0.01.
Figure 4
Figure 4. Islets from obB1B2KO mice release more insulin.
Insulin secretion and analysis of pancreatic islets from 3-month-old (A and C) and 6-month-old mice (B and D) when exposed to medium containing various concentrations of glucose (EC50 = 16.97+/−0.352 and 11.30+/−0.196; for 3-month-old obWT and obB1B2KO respectively (average +/− SD) and 8.41+/−0.217 and 6.29+/−0.651 for 6-month-old mice); E and G) Dynamic analysis of insulin secretion from islets of 3-month-old mice; F and H to K) Dynamic analyzes of insulin secretion from islets from 6-month-old mice. K and I) Analysis showing extended recovery time of basal insulin secretion levels from islets of obB1B2KO mice. Data present means ± SEM. *, p<0.05; n = 8×5 islets for static analyzes and n = 4×50 islets for dynamic analyzes.
Figure 5
Figure 5. Three-month-old obB1B2KO mice have 2-fold more C-peptide levels.
A) Serum insulin levels of starved and random fed mice at 3 months of age. B) Serum insulin C-peptide concentrations. C) Serum glucose after anesthesia with avertin and i.p. injection of 1 g glucose/kg body weight. D) Area under the curves of “C”. E and F) Serum insulin and, G and H) serum C-peptide from the same experiment in “C”. The data are presented as means ± SEM. *, p<0.05; **, p<0.01; ***, p<0.001, n = 8 for “A” and “B”, n = 4 for “C” to “H”.
Figure 6
Figure 6. KKS protects the liver against steatosis in obese mice.
A) Representative picture of the sizes of livers from 6-month-old mice; B) Averages of liver relative mass from 6-month-old mice; C) Representative picture comparing hematoxylin and eosin stained liver sections; D) Representative picture comparing Masson’s trichrome protocol; E) Percentage of the predominant type of non-alcoholic hepatic steatosis from histological analysis; F) Percentage of non-alcoholic hepatic steatosis levels from histological liver analysis; G and H) Serum lipid profile; I and J) Hepatic function analysis demonstrated by plasma transaminases measurements, aspartate aminotransferase (AST) and alanine aminotransferase (ALT). The data are presented as the means ± SEM. t student: *, p<0.05; **, p<0.01; Analysis of Contingency Table: # #, p<0.01; n = 8.
Figure 7
Figure 7. Increased gluconeogenesis and hepatic expression of FoxO1, PGC-1a and gluconeogenesis regulatory enzymes.
The experiments were performed in 6-month-old mice. A) Pyruvate challenge proceeded by intraperitoneal injection of 0.5 g/kg pyruvate; B) Quantitative real time PCR: The results are expressed as changes relative to the control obWT group. Forkhead box protein O1, 03 and 04 (FoxO1, O3 and O4), phosphoenolpyruvate carboxykinase (PEPCK), glucose-6-phosphatase (G6Pase), glucokinase (GCK), fructose-1,6-bisphosphatase 1 (FbP1), hepatocyte nuclear factor 4 alpha (Hnf4), 25-hydroxycholesterol 7-alpha-hydroxylase (CYP), carnitine palmitoyltransferase-1 (CPT1), Sterol regulatory element-binding protein 1 (SREB), peroxisome proliferator-activated receptor gamma coactivator 1-alpha (PGC-1a). Data are presented as the means ± SEM. Student’s t-test: *, p<0.05; **, p<0.01; ***, p<0.001; n = 5.

References

    1. Popkin BM. The shift in stages of the nutrition transition in the developing world differs from past experiences! Public Health Nutr. 2002;5:205–214. - PubMed
    1. Lenz M, Richter T, Muhlhauser I. The morbidity and mortality associated with overweight and obesity in adulthood: a systematic review. Dtsch Arztebl Int. 2009;106:641–648. - PMC - PubMed
    1. Ginsberg HN, Maccallum PR. The obesity, metabolic syndrome, and type 2 diabetes mellitus pandemic: II. Therapeutic management of atherogenic dyslipidemia. J Clin Hypertens (Greenwich) 2009;11:520–527. - PMC - PubMed
    1. Kahn SE, Hull RL, Utzschneider KM. Mechanisms linking obesity to insulin resistance and type 2 diabetes. Nature. 2006;444:840–846. - PubMed
    1. Samuel VT, Beddow SA, Iwasaki T, Zhang XM, Chu X, et al. Fasting hyperglycemia is not associated with increased expression of PEPCK or G6Pc in patients with Type 2 Diabetes. Proc Natl Acad Sci U S A. 2009;106:12121–12126. - PMC - PubMed

Publication types

MeSH terms

LinkOut - more resources