. 2012;7(7):e41374.
doi: 10.1371/journal.pone.0041374. Epub 2012 Jul 19.

Comprehensive identification and annotation of cell type-specific and ubiquitous CTCF-binding sites in the human genome

Affiliations

Comprehensive identification and annotation of cell type-specific and ubiquitous CTCF-binding sites in the human genome

Hebing Chen et al. PLoS One. 2012.

Abstract

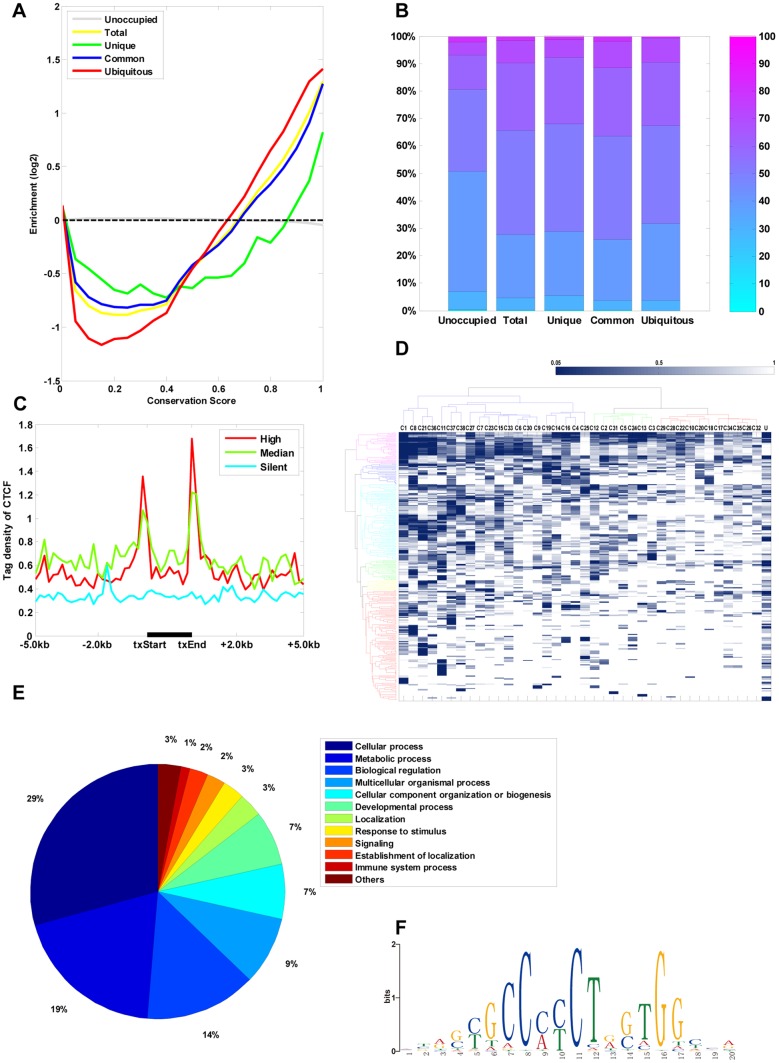
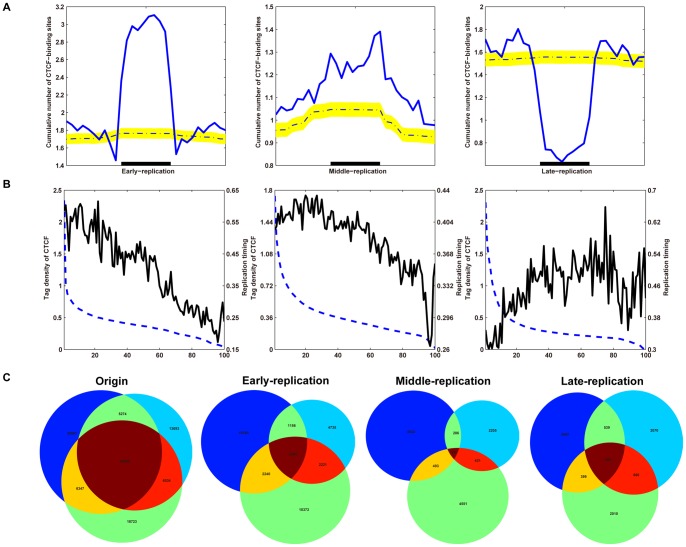
Chromatin insulators are DNA elements that regulate the level of gene expression either by preventing gene silencing through the maintenance of heterochromatin boundaries or by preventing gene activation by blocking interactions between enhancers and promoters. CCCTC-binding factor (CTCF), a ubiquitously expressed 11-zinc-finger DNA-binding protein, is the only protein implicated in the establishment of insulators in vertebrates. While CTCF has been implicated in diverse regulatory functions, CTCF has only been studied in a limited number of cell types across human genome. Thus, it is not clear whether the identified cell type-specific differences in CTCF-binding sites are functionally significant. Here, we identify and characterize cell type-specific and ubiquitous CTCF-binding sites in the human genome across 38 cell types designated by the Encyclopedia of DNA Elements (ENCODE) consortium. These cell type-specific and ubiquitous CTCF-binding sites show uniquely versatile transcriptional functions and characteristic chromatin features. In addition, we confirm the insulator barrier function of CTCF-binding and explore the novel function of CTCF in DNA replication. These results represent a critical step toward the comprehensive and systematic understanding of CTCF-dependent insulators and their versatile roles in the human genome.


Conflict of interest statement

Competing Interests: The authors have declared that no competing interests exist.

Figures

Figure 1
Figure 1. Identification and Characterization of CTCF-binding sites across 38 cell types.
(A) Genome-wide distribution of CTCF-binding sites relative to cell type. Total number of CTCF-binding sites in the K562 cell is shown. The proportions of cell type-specific, common, and ubiquitous CTCF sites are indicated. (B) Genome-wide saturation analysis of CTCF-binding sites across 38 cell types. Cumulative number of cell types covered by CTCF-binding sites from increasing numbers of cell lines (x-axis). Cumulative number covered by all (red), cell type-specific (green), and ubiquitous (blue) CTCF-binding sites from any cell line. Each point represents an averaged value of all possible cell line combinations. (C) Line graph depicting the number of each type of CTCF-binding site and the genes on each chromosome. The points plotted on the x-axis represent the number of genes per 2 Mbp, and points on the y-axes represent the number of CTCF-binding sites per 2 Mbp. (D) Chart presenting the genome-wide distribution of CTCF-binding sites in proximal promoters (defined as 1 kb upstream and downstream of TSSs) (red), exonic regions (green), intrinsic regions (cyan), and intergenic regions (purple) of K562 cells. The total number of CTCF-binding sites in K562 cell was 67,986.
Figure 2
Figure 2. Evolutionary and functional features of CTCF-binding sites.
(A) Conservation profiles for each type of CTCF-binding site in 38 cell types. The x-axis indicates the PhastCons score of bases covered by the binding sites ranging from 0 (no conservation) to 1.0 (perfect conservation). The y-axis represents the log ratio between the number of bases with the given score covered by different types of CTCF-binding sites relative to what would be expected by random site placement and the number of bases with the given score covered by the human genome relative to what would be expected by random site placement. The categories are: Unoccupied, unoccupied CTCF-binding sites that were used as control; Total, all CTCF-binding sites across the 38 cell types; Unique, cell type-specific CTCF-binding sites across the 38 cell types; Common, common CTCF-binding sites across the 38 cell types; and Ubiquitous, ubiquitous CTCF-binding sites across 38 cell types. (B) Distribution of GC content within each type of CTCF-binding site across the 38 cell types. The y-axis represents the percentage of CTCF–binding sites with GC content of different ranges (bar on right). The categories are the same as indicated in (A). (C) Normalized tag density of CTCF-binding sites of the most active, median, or most silent genes (n = 2,000 per group) across the gene bodies. The plots extend 5 kb 5′ and 3′ of the genic regions. RNA expression was determined in gene bodies for each cell type and exons displaying significantly high or low expression levels relative to the median expression for all cell types were identified. txStart, transcription start site; txEnd, transcription end. (D) GO analysis of cell type-specific and ubiquitous proximal CTCF-binding sites. Clustering of 38 cell types based on common GO nodes. Hierarchical clustering of both the cell types and the common GO nodes was performed based on the calculated EASE scores using the software Cluster 3.0 with average linkage. The relationship between the color intensity and EASE score is illustrated by the color bar. Gray indicates that an EASE score was not calculated for that GO node. The cell type is denoted by the letter and number combination at the top of every column. C1–C38  =  CTCF-binding sites of the 38 cell types (see Figure S1 for details), U  =  ubiquitous CTCF-binding site. (E) Summary of the biological processes regulated by genes related to the cell type-specific and ubiquitous proximal CTCF-binding sites. Annotations were obtained from the Gene Ontology database. (F) Significantly enriched CTCF consensus motifs within ubiquitous CTCF-binding sites graphically depicted using WebLogo.
Figure 3
Figure 3. Nucleosome positioning near the CTCF-binding sites in K562 cells.
Nucleosome (blue lines) and CTCF-binding sites (red lines) profiles around cell type-specific (A), common (B), and ubiquitous (C) CTCF-binding sites are illustrated. Distances from the CTCF-binding sites are plotted along the x-axis. Left and right y-axes represent the normalized tag densities of the nucleosome and CTCF-binding sites, respectively. In (C), cyan ovals depict hypothetical nucleosome positions across the site with color intensities reflecting their positioning strength. The CTCF-binding site is indicated by the yellow rectangle. Left inset, linear fit to the positions of the phase peaks within 3 kb downstream of the CTCF-binding sites (slope  = 185.2 bp; 95% confidence interval (CI)  =  [184.6 bp, 185.7 bp]). Right inset, linear fit to the positions of the phase peaks within 3 kb upstream of CTCF-binding sites (slope  = 185.3 bp; 95% CI  =  [184.2 bp, 186.5 bp]).
Figure 4
Figure 4. Chromatin features of CTCF-binding sites.
(A) Open chromatin proximal to CTCF-binding sites in K562 cells. DNaseI HS, DNaseI DGF, and FAIRE profiles of cell type-specific (left), common (middle), and ubiquitous (right) CTCF-binding sites. The tag density for open chromatin is shown across the CTCF-binding sites and extending 3 kb upstream and downstream of the CTCF-binding sites. (B) Histone modifications proximal to the CTCF-binding sites in K562 cells. Histone modification profiles of cell type-specific (left), common (middle), and ubiquitous (right) CTCF-binding sites. The tag density for modifications is shown across the CTCF-binding sites and extending 3 kb upstream and downstream of the CTCF-binding sites. (C) The smoothed distributions of CpG methylation levels within different types of CTCF-binding sites in K562 cells (for CpGs with ≥10-fold coverage). The distributions of methylation levels (%) across all CpGs identified in all, unique, common, and ubiquitous CTCF-binding sites are illustrated as a smooth approximation of probability density, which was estimated based on a normal kernel function. The x-axis represents the density of the methylation levels. The median methylation levels of different types of CTCF sites are illustrated as vertical, dashed lines. (D, E) CTCF-binding sites colocalize with strong enhancers (D) and gene expression (E) in a cell type-specific manner. (D) Cell-type specific CTCF-binding sites (x-axis) are mapped relative to cell-specific enhancer binding regions (y-axis) in six different cell types. (E) Cell type-specific CTCF-binding sites (x-axis) are mapped relative to transcription start sites of genes with cell type-specific expression (y-axis). Bubble size represents the level of enrichment.
Figure 5
Figure 5. CTCF-binding sites demarcate euchromatin and heterochromatin.
(A) Circos map of the whole-genome chromatin domains, associated CTCF-binding sites, DNaseI HS, and histone modifications of chromosome 11 generated using the Circos software package. Chromatin domains were identified in K562 cells using HMMSeg, with DNaseI HS and histone modifications as inputs. The outermost circle (circle 1) represents the chromosome band (scale in kb). Circles 2 and 3 represent the peaks and tag density profile of CTCF-binding sites, respectively. Circle 4 represents the DNaseI HS profile. Circles 5–11 represent the histone modifications H3K27ac, H3K27me3, H3K36me3, H3K4me1, H3K4me2, H3K4me3, and H3K9ac, respectively. Circle 12 represents the euchromatin (medium blue) and heterochromatin (light cyan) domains. Intrachromosomal interactions are drawn in the innermost ring with color intensities (from white to gray) reflecting interaction strength (low to high). (B–D) Number profiles of cell type-specific (B), common (C), and ubiquitous (D) CTCF-binding sites centered on boundaries of different chromatin domains and extended 320 kb upstream of and 320 kb downstream of the boundary at 1 kb resolution. The area to the left of the vertical dash-dot line and all negative coordinates represent heterochromatin domains; the area to the right of the vertical dash-dot line and all positive coordinates represent euchromatin domains. Plotted on the y-axis is the normalized number of CTCF-binding sites and on the x-axis is distance from the chromatin boundary. Blue lines show moving-window averages with window sizes of 16 kb. The yellow strip represents the region of 5th and 95th percentiles for the number profile of the corresponding 10,000 shuffled CTCF-binding sites. The horizontal dashed line represents the median number profile of the corresponding 10,000 shuffled CTCF-binding sites. (E) Percentage of the cell type-specific, common, and ubiquitous barrier CTCF-binding sites that overlapped with each other within all CTCF and barrier CTCF across five cell types. (F) Chromatin domains are mediated by CTCF loops. Bar chart representing the median intrachromosomal interactions across the human genome (blue bar), and the median intrachromosomal interactions between any CTCF-binding sites (cyan bar), any barrier CTCF-binding sites (yellow bar), and barriers of adjacent chromatin domains (red bar) in K562 cells.
Figure 6
Figure 6. Characteristics of CTCF-binding sites within DNA replication zones.
(A) Cumulative number of CTCF-binding sites within replicating zones. The cumulative normalized number of CTCF-binding sites within early-replicating zones (left), middle-replicating zones (middle) and late-replicating zones (right) was plotted to allow comparison of the densities of CTCF-binding sites and shuffled CTCF-binding sites within replicating zones. The intensity plots show the significantly different patterns of the CTCF-binding sites and shuffled CTCF-binding sites. The yellow strip represents the region of 5th and 95th percentiles for the intensity profile of the 10,000 shuffled CTCF-binding sites. The dash-dot line represents the median intensity profile corresponding to the 10,000 shuffled CTCF-binding sites. (B) Correlation between CTCF and replication time. Early-replicating zones (left), middle-replicating zones (middle) and late-replicating zones (right) were grouped into 100 sets (dotted line) based on their levels (from high to low, left to right on the x-axis). The average tag density of CTCF was calculated for each group and plotted according to the average tag density of CTCF (right y-axis) and the replicating time (left y-axis). (C) CTCF-binding sites within replicating zones are cell type-specific. The origin Venn-diagram represents the overlap of all the CTCF-binding sites between the BJ, GM06990, and K562 cells. The Early-, Middle-, and Late-replication Venn-diagram respectively represents the overlap of the CTCF-binding sites that located within Early-, Middle-, and Late-replicating zones between the BJ, GM06990, and K562 cells.

Similar articles

Cited by

References

    1. Gerasimova TI, Corces VG. Chromatin insulators and boundaries: effects on transcription and nuclear organization. Annu Rev Genet. 2001;35:193–208. - PubMed
    1. Bartkuhn M, Straub T, Herold M, Herrmann M, Rathke C, et al. Active promoters and insulators are marked by the centrosomal protein 190. EMBO J. 2009;28:877–888. - PMC - PubMed
    1. Bushey AM, Ramos E, Corces VG. Three subclasses of a Drosophila insulator show distinct and cell type-specific genomic distributions. Genes Dev. 2009;23:1338–1350. - PMC - PubMed
    1. Jiang N, Emberly E, Cuvier O, Hart CM. Genome-wide mapping of boundary element-associated factor (BEAF) binding sites in Drosophila melanogaster links BEAF to transcription. Mol Cell Biol. 2009;29:3556–3568. - PMC - PubMed
    1. Negre N, Brown CD, Shah PK, Kheradpour P, Morrison CA, et al. A comprehensive map of insulator elements for the Drosophila genome. PLoS Genet. 2010;6:e1000814. - PMC - PubMed

Publication types