. 2012 Jul 25:5:376.
doi: 10.1186/1756-0500-5-376.

Luminal A and luminal B (HER2 negative) subtypes of breast cancer consist of a mixture of tumors with different genotype

Affiliations

Luminal A and luminal B (HER2 negative) subtypes of breast cancer consist of a mixture of tumors with different genotype

Masumi Yanagawa et al. BMC Res Notes. .

Abstract

Background: The St Gallen International Expert Consensus 2011 has proposed a new classification system for breast cancer. The purpose of this study was to elucidate the relationship between the breast cancer subtypes determined by the new classification system and genomic characteristics.

Methods: Invasive breast cancers (n = 363) were immunohistochemically classified as follows: 111 (30.6%) as luminal A, 95 (26.2%) as luminal B (HER2 negative), 69 (19.0%) as luminal B (HER2 positive), 41 (11.3%) as HER2, and 47 (12.9%) as basal-like subtypes.

Results: The high expression of Ki-67 antigen was detected in 236 tumors; no cases of luminal A subtype showed high expression of the Ki-67 antigen, but more than 85% of tumors of the other subtypes showed high expression. In addition, DNA ploidy and chromosomal instability (CIN) were assessed using imaging cytometry and FISH, respectively. In this series, 336 (92.6%) tumors consisted of 129 diploid/CIN- and 207 aneuploid/CIN + tumors. Diploid/CIN- and aneuploid/CIN+ features were detected in 64.9% and 27.9% of luminal A, 41.1% and 49.5% of luminal B (HER2-), 11.6% and 81.2% of luminal B (HER2+), 4.9% and 90.2% of HER2, and 17.0% and 76.6% of basal-like subtypes, respectively. Unlike the luminal B (HER2+), HER2 and basal-like subtypes, the luminal A and luminal B (HER2-) subtypes were heterogeneous in terms of DNA ploidy and CIN.

Conclusions: It is reasonable to propose that the luminal A and luminal B (HER2-) subtypes should be further divided into two subgroups, diploid/CIN- and aneuploid/CIN+, based on their underlying genomic status.


Figures
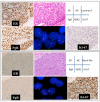
Figure 1
Figure 1
The results of the immunohistochemical analysis evaluating the expression status of the ER, PgR, and Ki-67 antigens, FISH detecting HER2 amplification, and the histological features in conventional tissue sections stained with hematoxylin-eosin. Upper rows: A case of invasive ductal carcinoma classified into the luminal A subtype. The ER was expressed in 100% of the tumor cells, and the PgR was expressed in 90% of them. No HER2 amplification was detected (green and red spots indicate chromosome 17 centromeres and HER2). The Ki-67 antigen was expressed in 1% of the cells in this tumor (Ki-67 index = 1%). Lower rows: A medullary carcinoma was classified into the basal-like subtype. The ER and PgR are apparently not expressed in any of the tumor cells. No HER2 amplification was detected. The Ki-67 antigen was expressed in 70% of the tumor cells (Ki-67 index = 70%).
Figure 2
Figure 2
The relationship between the Ki-67 indices and subtypes. The high expression (Ki-67 index≧14%) of the Ki-67 antigen was detected in 237 of the 363 breast cancers. The average Ki-67 index was 5.8% (±3.6 standard deviation) for the luminal A subtype, 24.3% (±9.8) for the luminal B (HER2-) subtype, 31.0% (±15.8) for the luminal B (HER2+) subtype, 43.0% (±19.6) for the HER2 subtype, and 46.4% (±23.1) for the basal-like subtype. The difference in the average Ki-67 index was statistically significant between the luminal A and other subtypes (P = 7.366×10⁻¹², P = 4.662×10⁻¹², P = 4.061×10⁻¹⁰, and P = 7.779×10⁻⁴ between luminal A subtype and luminal B (HER2- & HER2+), HER2, and basal-like subtypes, respectively).
Figure 3
Figure 3
The relationship of subtypes to the DNA ploidy and CIN. The diploid/CIN- status was detected in 72 (64.9%) of the 111 luminal A carcinomas, 39 (41.1%) of the 95 luminal B (HER2-) carcinomas, 8 (11.6%) of the 69 lumminal B (HER2+) carcinomas, 2 (4.9%) of the 41 HER2 carcinomas, and 8 (17.0%) of the 26 basal-like carcinomas. In contrast, the aneuploid/CIN + status was detected in 31 (27.9%) of the 111 luminal A, 47 (49.5%) of the luminal B (HER2-), 56 (81.2%) of the 69 luminal B (HER2+), 37 (90.2%) of the 41 HER2, and 36 (86.6%) of the 47 basal-like subtype tumors. The incidence of diploid/CIN- and aneuploid/CIN+ status was different between the luminal A subtype and luminal B (HER2-), luminal B (HER2+), HER2, and basal-like subtypes (p = 0.0006, p = 5E-13, p = 5E10-12, and p = 8E10-9). In addition, the incidence of diploid/CIN- and aneuploid/CIN+ status was statistically different between the luminal B (HER2-) subtype and luminal B (HER2+), HER2, and basal-like subtypes (p = 0.00002, p = 0.000009, and p = 0.002). Black bar; diploid/CIN- tumors, gray bar; aneuploid/CIN+ tumors, white column; others.
Figure 4
Figure 4
The relationship between the nuclear grade and subtypes. Grade 1 tumors were detected in 47.7% of the 111 luminal A subtype tumors, 15.8% of the 95 luminal B (HER2-) subtypes, 8.7% of the 69 luminal B (HER2+) subtypes, 0% of the 41 HER2 subtypes, and 8.5% of the 47 basal-like subtype tumors. Of the grade1 tumors 67.9% were categorized as part of the luminal A subtype. Grade 3 tumors were detected in 18.0% of luminal A tumors, 58.9% of luminal B (HER2-), 75.4% of luminal B (HER2+), 92.7% of HER2, and 85.1% of basal-like tumors. In the HER2 and basal-like subtypes, grade3 tumors were common but grade 1 tumors are rare. In contrast, the luminal A and luminal B (HER2-) subtypes consisted of heterogeneous populations with different grade. Solid square; grade 1 tumors, cross; grade 2 tumors, and solid circle; grade 3 tumors.
Figure 5
Figure 5
The differences in the nuclear grades between diploid/CIN- and aneuploid/CIN+ breast cancers. Grade 1 tumors were more frequently seen in diploid/CIN- carcinomas than in aneuploid/CIN+ carcinomas (p = 1.601×10⁻¹²). In contrast, grade 3 tumors were much more common in aneuploid/CIN+ tumors than in diploid/CIN- tumors (p = 5.285×10⁻²⁰). The incidence of grade 2 tumors was significantly different between these two types of tumors with different genomic characteristics (P = 2.281×10⁻³). White column; grade 1 tumors, gray column; grade 2 tumors, and black column; grade 2 tumors.

References

    1. Reis-Filho JS, Simpson PT, Gale T, Lakhani SR. Molecular evolution of breast cancer. J Pathol. 2005;205:248–254. doi: 10.1002/path.1691. - DOI - PubMed
    1. Oakman C, Bessi S, Zatarana E, Galardi F, Biganzoli L, Di Leo A. Recent adavances in systemic therapy new diagnostics and biological predictors of outcome in early breast cancer. Breast Cancer Res. 2009;11:205. doi: 10.1186/bcr2238. - DOI - PMC - PubMed
    1. Rose ANN, Siegel PM. Emerging therapeutic targets in breast cancer bone metastasis. Future Oncol. 2010;6:55–74. doi: 10.2217/fon.09.138. - DOI - PubMed
    1. Raica M, Jung I, Cimpean AM, Suciu C, Muresan AM. From conventional pathologic diagnosis to the molecular classification of breast carcinoma: are we ready for the change? Rpm J Mrphol Embryol. 2009;50:5–13. - PubMed
    1. Goldhirsch A, Wood WC, Coates AS, Gelber RD, Thürlimann B, Senn HJ. Panel members. Strategies for subtypes--dealing with the diversity of breast cancer: highlights of the St. Gallen international expert consensus on the primary therapy of early breast cancer 2011. Ann Oncol. 2011;22:1736–1747. doi: 10.1093/annonc/mdr304. - DOI - PMC - PubMed

Publication types

MeSH terms