. 2012 Jul 25;13(7):R65.
doi: 10.1186/gb-2012-13-7-r65.

Developmental features of DNA methylation during activation of the embryonic zebrafish genome

Developmental features of DNA methylation during activation of the embryonic zebrafish genome

Ingrid S Andersen et al. Genome Biol. .

Abstract

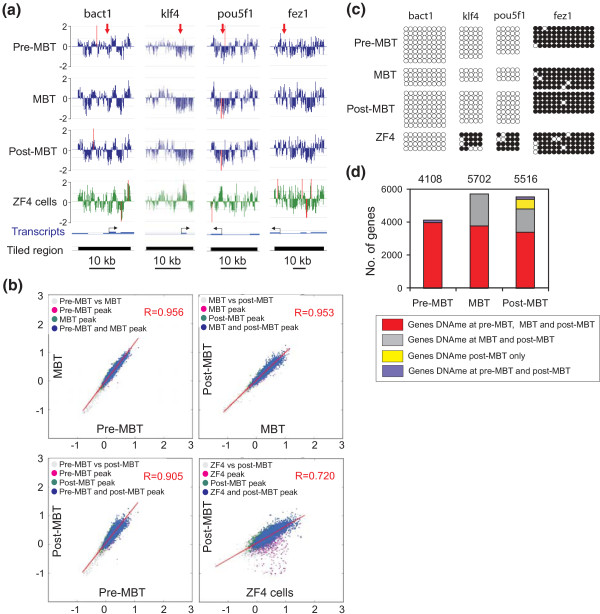
Background: Zygotic genome activation (ZGA) occurs at the mid-blastula transition (MBT) in zebrafish and is a period of extensive chromatin remodeling. Genome-scale gametic demethylation and remethylation occurs after fertilization, during blastula stages, but how ZGA relates to promoter DNA methylation states is unknown. Using methylated DNA immunoprecipitation coupled to high-density microarray hybridization, we characterize genome-wide promoter DNA methylation dynamics before, during and after ZGA onset, in relation to changes in post-translational histone modifications and gene expression.

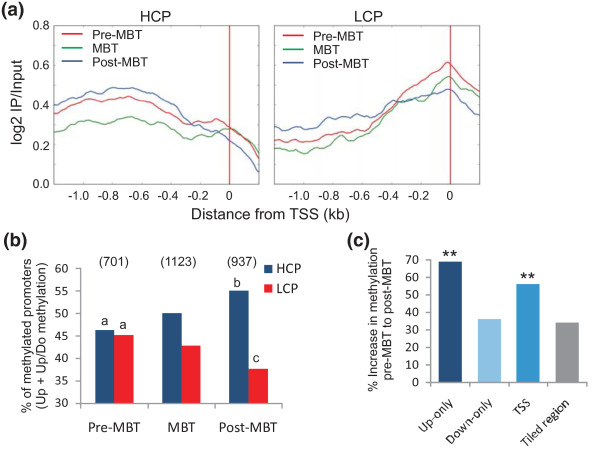
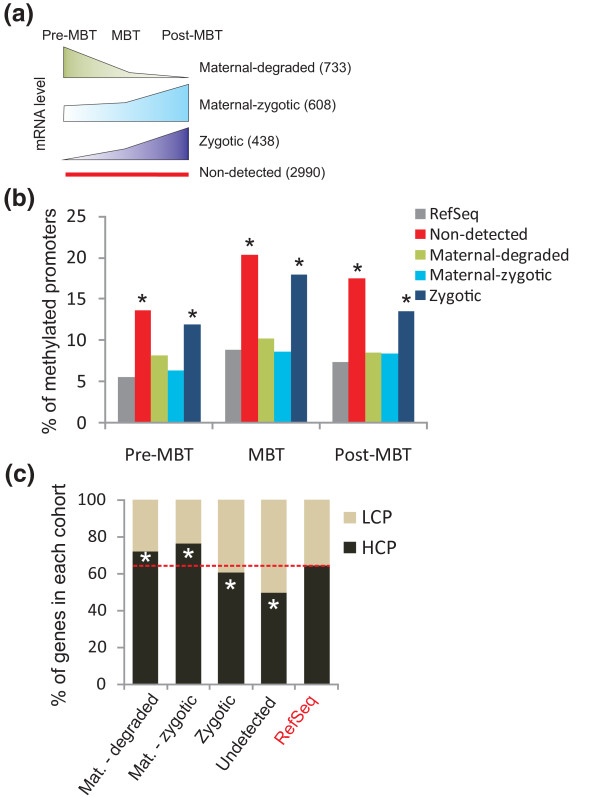
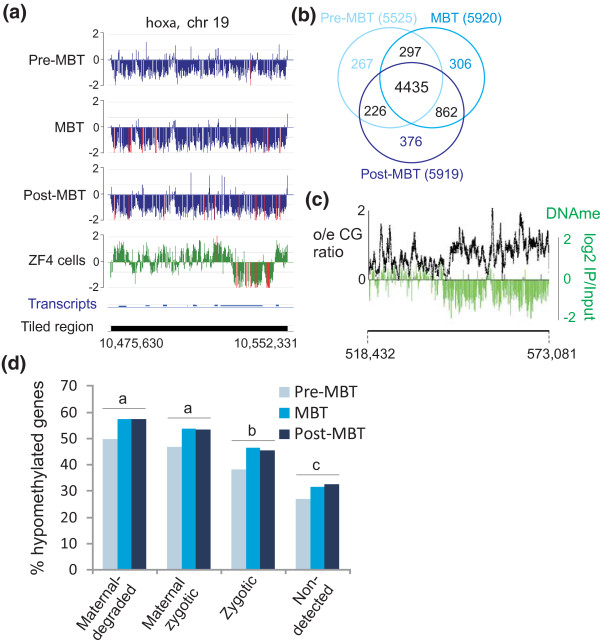
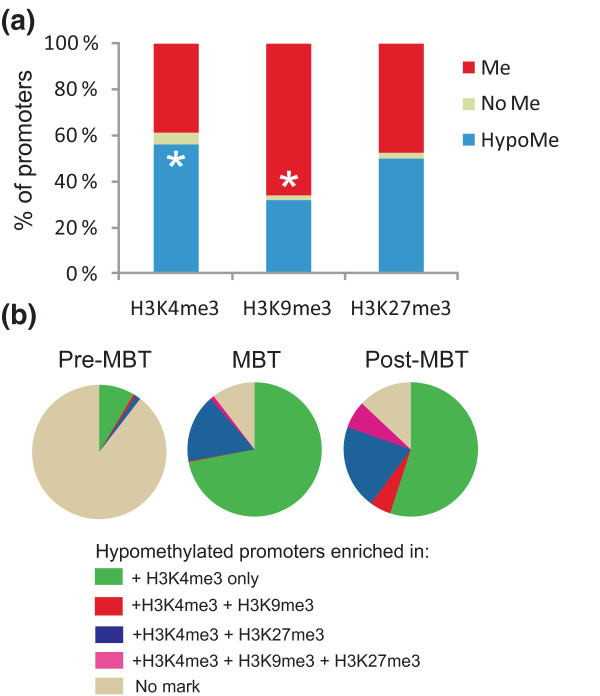
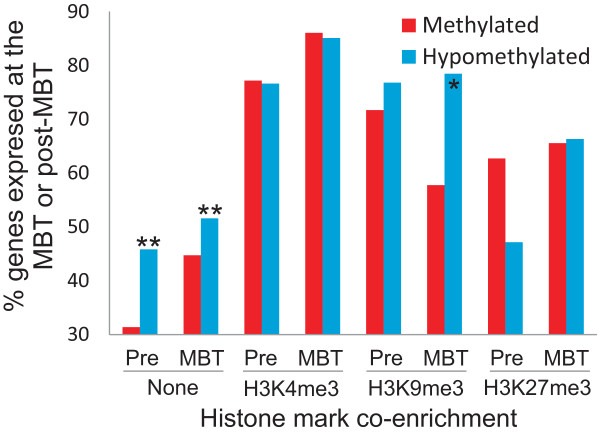
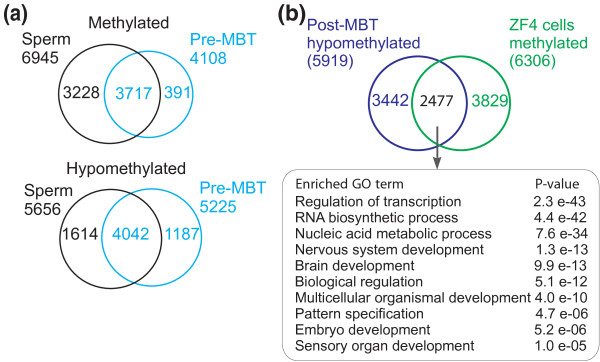
Results: We show methylation of thousands of promoters before ZGA and additional methylation after ZGA, finding more dynamic methylation -1 to 0 kb upstream of the transcription start site than downstream. The MBT is marked by differential methylation of high and low CpG promoters, and we identify hypomethylated promoters that are mostly CG-rich and remain hypomethylated through the MBT. Hypomethylated regions constitute a platform for H3K4me3, whereas H3K9me3 preferentially associates with methylated regions. H3K27me3 associates with either methylation state depending on its coincidence with H3K4me3 or H3K9me3. Cohorts of genes differentially expressed through the MBT period display distinct promoter methylation patterns related to CG content rather than transcriptional fate. Lastly, although a significant proportion of genes methylated in sperm are unmethylated in embryos, over 90% of genes methylated in embryos are also methylated in sperm.

Conclusions: Our results suggest a pre-patterning of developmental gene expression potential by a combination of DNA hypomethylation and H3K4 trimethylation on CG-rich promoters, and are consistent with a transmission of DNA methylation states from gametes to early embryos.


Figures

Figure 1
Figure 1
Promoter DNA methylation states during the transition through the MBT period. (a) MeDIP-chip profiles of DNA methylation in tiled regions spanning a housekeeping gene (bact1) and developmentally regulated genes (klf4, pou5f1, fez1) (log2 MeDIP/input ratios), in pre-MBT, MBT, and post-MBT embryos and in the ZF4 fibroblast cell line. Red arrows in the upper track point to regions analyzed by bisulfite sequencing in (b). (b) Two-dimensional scatter plots of MaxSixty values for MeDIP log2 signal intensities at indicated developmental stages (pairwise) and in ZF4 cells. Average MaxSixty values for both MeDIP replicates are plotted for each stage. Data points are colored to indicate classification according to peak calling algorithm, to show methylated promoters in one only (purple, green) or both (blue) stages. (c) Bisulfite sequencing validation of MeDIP-chip data shown in (a); 5' to 3' orientation; filled circles indicate methylated cytosine; empty circles indicate unmethylated cytosine. (d) Numbers of methylated genes pre-MBT, MBT and post-MBT. Color reflects genes whose methylation is maintained between stages.
Figure 2
Figure 2
Characterization of promoter DNA methylation patterns during development through the MBT. (a) Average methylation profiles of HCPs and LCPs at pre-MBT, MBT and post-MBT stages. (b) Proportions of methylated HCPs and LCPs at pre-MBT, MBT and post-MBT stages; methylation is defined by detection of a methylation peak in the -1/0 kb window upstream of the TSS irrespective of downstream methylation (upstream (Up) and upstream/downstream (Up/Do) methylation; y-axis). a,bP = 0.0005; a,cP = 0.0027 (Fisher's test). (c) Percent increase in the numbers of genes methylated upstream of the TSS (Up-only; -1 to 0 kb), downstream of the TSS (Down-only; 0 to +1 kb), and both upstream and downstream (TSS), from pre-MBT to post-MBT. **P < 0.001 (Fisher) relative to increase in methylation in the whole regions analyzed (-5 to +1 kb).
Figure 3
Figure 3
Relationship between promoter DNA methylation and embryonic gene expression. (a) Schematic representation of the developmental gene expression cohorts previously identified by RNA-seq [10] (numbers of genes encoding the corresponding transcripts). (b) Proportions of genes with a methylated promoter (-1/0 kb) in each cohort at the pre-MBT, MBT and post-MBT stages. *P < 10-4 relative to RefSeq genes (Fisher). (c) Proportions of LCPs and HCPs in each gene cohort. *P < 10-4 relative to RefSeq genes (Fisher).
Figure 4
Figure 4
Maternal genes are preferentially hypomethylated relative to zygotic or non-expressed genes. (a) Hypomethylated domain over the hoxa locus in embryos and ZF4 cells. (b) Venn diagram analysis of hypomethylated genes at pre-MBT, MBT and post-MBT stages. (c) Domains of high o/e CG ratios exhibit hypomethylation, exemplified in a 51-kb region of chromosome 11 in pre-MBT embryos. (d) Proportions of hypomethylated genes in developmental gene cohorts. a,b/a,c/b,cP < 10-4 within developmental stage (Fisher).
Figure 5
Figure 5
Enrichment of hypomethylated and methylated genes in, respectively, H3K4me3 and H3K9me3. (a) Post-MBT proportions of H3K4me3, H3K9me3 and H3K27me3 enrichment on methylated promoters, hypomethylated promoters and promoters with genome-average methylation (that is, neither statistically hypomethylated nor methylated; 'No Me'). *P < 10-4 relative to the opposite methylation state (Fisher). Histone methylation data are from our laboratory [13]. (b) Proportions of hypomethylated promoters not marked by H3K4me3 (or any other histone modification), or co-enriched in H3K4me3 only or with a repressive mark (H3K9me3, or H3K27me3, or both).
Figure 6
Figure 6
Promoter marking by modified histones before ZGA onset is associated with enhanced gene expression potential after ZGA. Graph shows the percentage of expressed genes (≥5 RNA-seq reads) at or after the MBT (post-ZGA) as a function of promoter DNA methylation state and marking by H3K4me3, H4K9me3 or H3K27me3 at the pre-MBT or MBT stages. **P < 10-5; *P < 0.001; -P = 0.058 (Chi-square test with Yate's correction).
Figure 7
Figure 7
Relationship between promoter methylation in sperm and embryos. (a) Venn diagram analyses of methylated and hypomethylated genes in sperm and in pre-MBT embryos. (b) Venn diagram analysis of genes hypomethylated in post-MBT embryos and methylated in ZF4 cells. Top 10 enriched GO terms for these genes are shown.

References

    1. Reik W. Stability and flexibility of epigenetic gene regulation in mammalian development. Nature. 2007;447:425–432. doi: 10.1038/nature05918. - DOI - PubMed
    1. Borgel J, Guibert S, Li Y, Chiba H, Schubeler D, Sasaki H, Forne T, Weber M. Targets and dynamics of promoter DNA methylation during early mouse development. Nat Genet. 2010;42:1093–1100. doi: 10.1038/ng.708. - DOI - PubMed
    1. Smallwood SA, Tomizawa S, Krueger F, Ruf N, Carli N, Segonds-Pichon A, Sato S, Hata K, Andrews SR, Kelsey G. Dynamic CpG island methylation landscape in oocytes and preimplantation embryos. Nat Genet. 2011;43:811–814. doi: 10.1038/ng.864. - DOI - PMC - PubMed
    1. Stancheva I, El-Maarri O, Walter J, Niveleau A, Meehan RR. DNA methylation at promoter regions regulates the timing of gene activation in Xenopus laevis embryos. Dev Biol. 2002;243:155–165. doi: 10.1006/dbio.2001.0560. - DOI - PubMed
    1. Veenstra GJ, Wolffe AP. Constitutive genomic methylation during embryonic development of Xenopus. Biochim Biophys Acta. 2001;1521:39–44. doi: 10.1016/S0167-4781(01)00280-9. - DOI - PubMed

Publication types

LinkOut - more resources