

Noise spatial nonuniformity and the impact of statistical image reconstruction in CT myocardial perfusion imaging
- PMID: 22830741
- PMCID: PMC3382258
- DOI: 10.1118/1.4722983
Noise spatial nonuniformity and the impact of statistical image reconstruction in CT myocardial perfusion imaging
Abstract
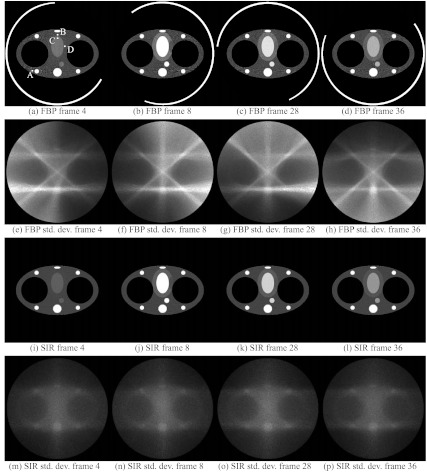
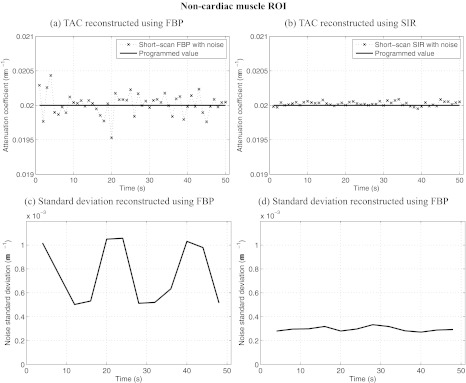
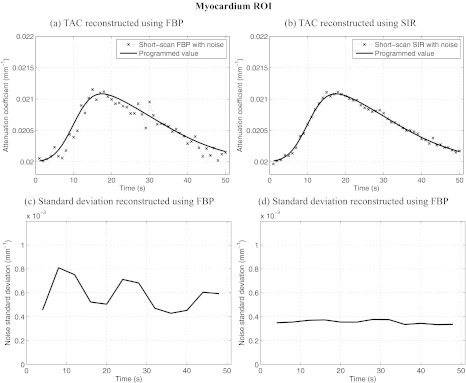
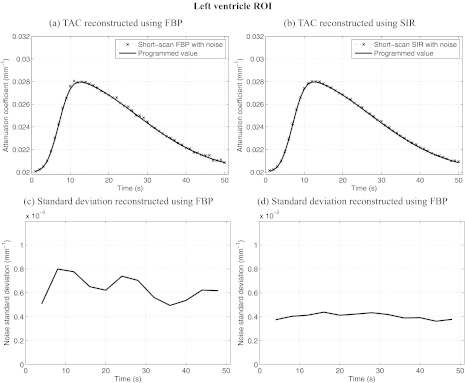
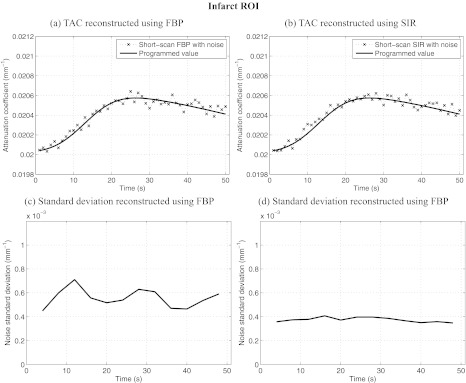
Purpose: To achieve high temporal resolution in CT myocardial perfusion imaging (MPI), images are often reconstructed using filtered backprojection (FBP) algorithms from data acquired within a short-scan angular range. However, the variation in the central angle from one time frame to the next in gated short scans has been shown to create detrimental partial scan artifacts when performing quantitative MPI measurements. This study has two main purposes. (1) To demonstrate the existence of a distinct detrimental effect in short-scan FBP, i.e., the introduction of a nonuniform spatial image noise distribution; this nonuniformity can lead to unexpectedly high image noise and streaking artifacts, which may affect CT MPI quantification. (2) To demonstrate that statistical image reconstruction (SIR) algorithms can be a potential solution to address the nonuniform spatial noise distribution problem and can also lead to radiation dose reduction in the context of CT MPI.
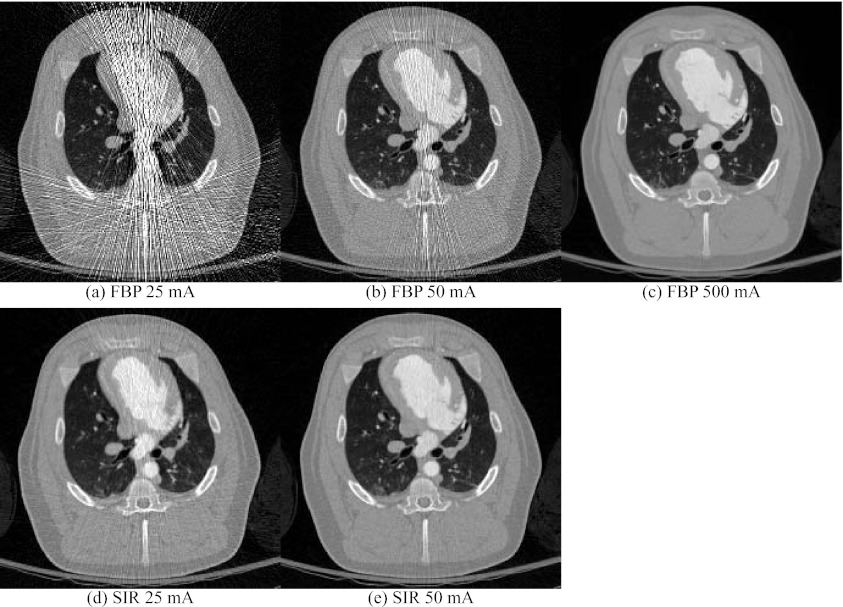
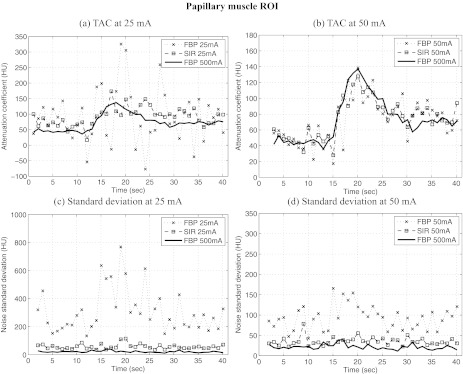
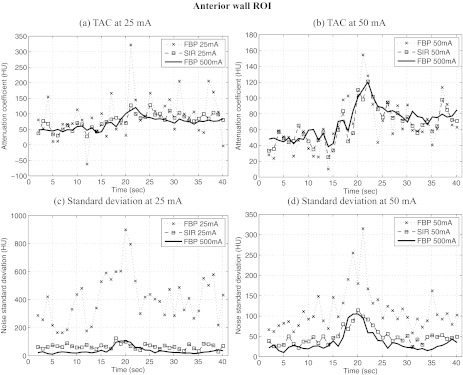
Methods: Projection datasets from a numerically simulated perfusion phantom and an in vivo animal myocardial perfusion CT scan were used in this study. In the numerical phantom, multiple realizations of Poisson noise were added to projection data at each time frame to investigate the spatial distribution of noise. Images from all datasets were reconstructed using both FBP and SIR reconstruction algorithms. To quantify the spatial distribution of noise, the mean and standard deviation were measured in several regions of interest (ROIs) and analyzed across time frames. In the in vivo study, two low-dose scans at tube currents of 25 and 50 mA were reconstructed using FBP and SIR. Quantitative perfusion metrics, namely, the normalized upslope (NUS), myocardial blood volume (MBV), and first moment transit time (FMT), were measured for two ROIs and compared to reference values obtained from a high-dose scan performed at 500 mA.
Results: Images reconstructed using FBP showed a highly nonuniform spatial distribution of noise. This spatial nonuniformity led to large fluctuations in the temporal direction. In the numerical phantom study, the level of noise was shown to vary by as much as 87% within a given image, and as much as 110% between different time frames for a ROI far from isocenter. The spatially nonuniform noise pattern was shown to correlate with the source trajectory and the object structure. In contrast, images reconstructed using SIR showed a highly uniform spatial distribution of noise, leading to smaller unexpected noise fluctuations in the temporal direction when a short scan angular range was used. In the numerical phantom study, the noise varied by less than 37% within a given image, and by less than 20% between different time frames. Also, the noise standard deviation in SIR images was on average half of that of FBP images. In the in vivo studies, the deviation observed between quantitative perfusion metrics measured from low-dose scans and high-dose scans was mitigated when SIR was used instead of FBP to reconstruct images.
Conclusions: (1) Images reconstructed using FBP suffered from nonuniform spatial noise levels. This nonuniformity is another manifestation of the detrimental effects caused by short-scan reconstruction in CT MPI. (2) Images reconstructed using SIR had a much lower and more uniform noise level and thus can be used as a potential solution to address the FBP nonuniformity. (3) Given the improvement in the accuracy of the perfusion metrics when using SIR, it may be desirable to use a statistical reconstruction framework to perform low-dose dynamic CT MPI.
Figures

Similar articles
-
Low dose dynamic CT myocardial perfusion imaging using a statistical iterative reconstruction method.Med Phys. 2014 Jul;41(7):071914. doi: 10.1118/1.4884023. Med Phys. 2014. PMID: 24989392 Free PMC article.
-
A strategy to decrease partial scan reconstruction artifacts in myocardial perfusion CT: phantom and in vivo evaluation.Med Phys. 2012 Jan;39(1):214-23. doi: 10.1118/1.3665767. Med Phys. 2012. PMID: 22225290 Free PMC article.
-
Spatial resolution improvement and dose reduction potential for inner ear CT imaging using a z-axis deconvolution technique.Med Phys. 2013 Jun;40(6):061904. doi: 10.1118/1.4802730. Med Phys. 2013. PMID: 23718595
-
Iterative reconstruction for coronary CT angiography: finding its way.Int J Cardiovasc Imaging. 2012 Mar;28(3):613-20. doi: 10.1007/s10554-011-9832-3. Epub 2011 Feb 27. Int J Cardiovasc Imaging. 2012. PMID: 21359835 Review.
-
Regularization strategies in statistical image reconstruction of low-dose x-ray CT: A review.Med Phys. 2018 Oct;45(10):e886-e907. doi: 10.1002/mp.13123. Epub 2018 Sep 10. Med Phys. 2018. PMID: 30098050 Free PMC article. Review.
Cited by
-
Characterization of statistical prior image constrained compressed sensing. I. Applications to time-resolved contrast-enhanced CT.Med Phys. 2012 Oct;39(10):5930-48. doi: 10.1118/1.4748323. Med Phys. 2012. PMID: 23039632 Free PMC article.
-
Robust dynamic myocardial perfusion CT deconvolution for accurate residue function estimation via adaptive-weighted tensor total variation regularization: a preclinical study.Phys Med Biol. 2016 Nov 21;61(22):8135-8156. doi: 10.1088/0031-9155/61/22/8135. Epub 2016 Oct 26. Phys Med Biol. 2016. PMID: 27782004 Free PMC article.
-
Statistical model based iterative reconstruction (MBIR) in clinical CT systems: experimental assessment of noise performance.Med Phys. 2014 Apr;41(4):041906. doi: 10.1118/1.4867863. Med Phys. 2014. PMID: 24694137 Free PMC article.
-
Cardiac CT for myocardial ischaemia detection and characterization--comparative analysis.Br J Radiol. 2014 Nov;87(1043):20140159. doi: 10.1259/bjr.20140159. Epub 2014 Aug 19. Br J Radiol. 2014. PMID: 25135617 Free PMC article. Review.
-
Myocardial perfusion imaging with cardiac computed tomography: state of the art.J Cardiovasc Transl Res. 2013 Oct;6(5):695-707. doi: 10.1007/s12265-013-9499-3. Epub 2013 Aug 21. J Cardiovasc Transl Res. 2013. PMID: 23963959 Review.
References
-
- Shaw L. J. et al., “Optimal medical therapy with or without percutaneous coronary intervention to reduce ischemic burden: Results from the clinical outcomes utilizing revascularization and aggressive drug evaluation (COURAGE) trial nuclear substudy,” Circulation 117(10), 1283–1291 (2008).10.1161/CIRCULATIONAHA.107.743963 - DOI - PubMed
-
- Mahnken A. H. and Buecker A., “Imaging of myocardial viability and infarction,” in Computed Tomography of the Cardiovascular System (Informa Healthcare, London, 2007), 429–440.
Publication types
MeSH terms
Grants and funding
LinkOut - more resources
Full Text Sources
Other Literature Sources
Medical
Miscellaneous
