

Decision support system for localizing prostate cancer based on multiparametric magnetic resonance imaging
- PMID: 22830742
- PMCID: PMC3390048
- DOI: 10.1118/1.4722753
Decision support system for localizing prostate cancer based on multiparametric magnetic resonance imaging
Abstract
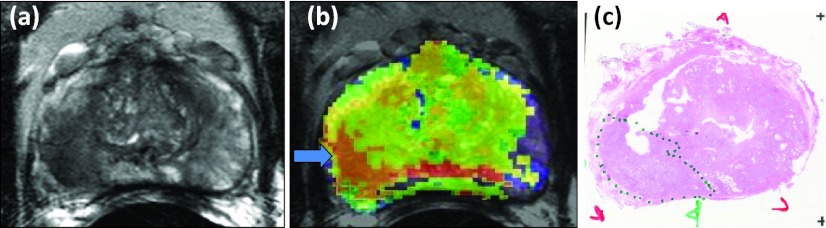
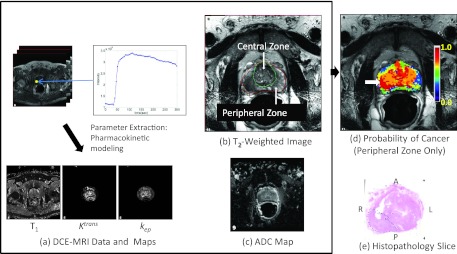
Purpose: There is a growing need to localize prostate cancers on magnetic resonance imaging (MRI) to facilitate the use of image guided biopsy, focal therapy, and active surveillance follow up. Our goal was to develop a decision support system (DSS) for detecting and localizing peripheral zone prostate cancers by using machine learning approach to calculate a cancer probability map from multiparametric MR images (MP-MRI).
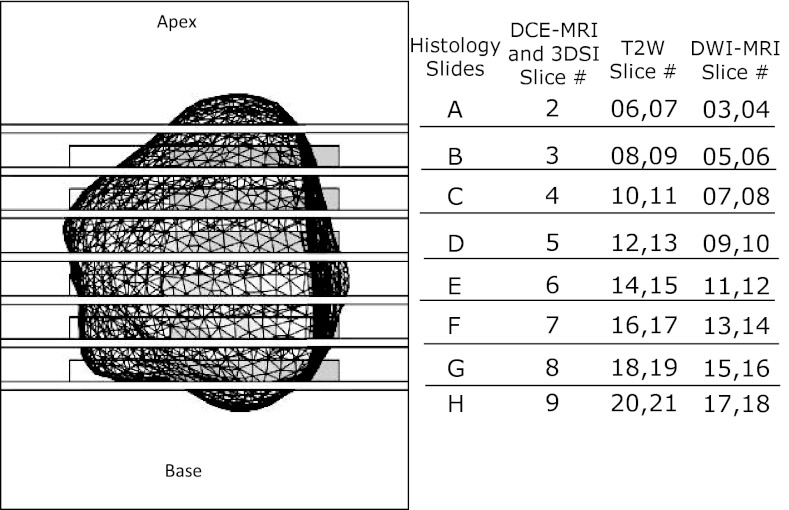
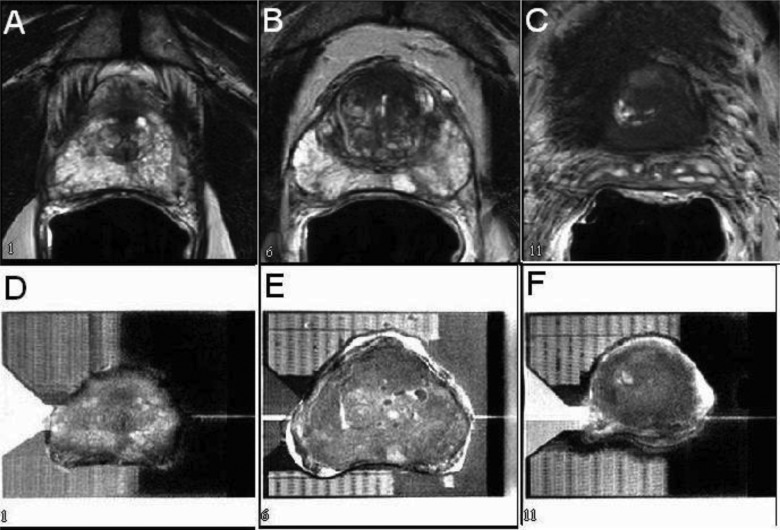
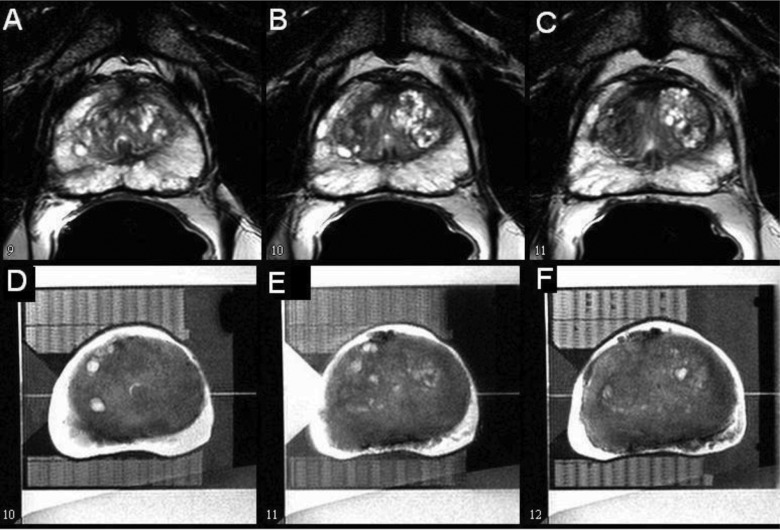
Methods: This IRB approved Health Insurance Portability and Accountability Act compliant retrospective study consisted of 31 patients (mean age and serum prostate specific antigen of 60.4 and 6.62 ng∕ml, respectively) who had MP-MRI at 3 T followed by radical prostatectomy. Seven patients were excluded due to technical issues with their MP-MRI (e.g., motion artifact, failure to perform all sequences). Cancer and normal regions were identified in the peripheral zone by correlating them to whole mount histology slides of the excised prostatectomy specimens. To facilitate the correlation, tissue blocks matching the MR slices were obtained using a MR-based patient-specific mold. Segmented regions on the MP-MRI were correlated to histopathology and used as training sets for the learning system that generated the cancer probability maps. Leave-one-patient-out cross-validation on the cancer and normal regions was performed to determine the learning system's efficacy, an evolutionary strategies approach (also known as a genetic algorithm) was used to find the optimal values for a set of parameters, and finally a cancer probability map was generated.
Results: For the 24 patients that were used in the study, 225 cancer and 264 noncancerous regions were identified from the region maps. The efficacy of DSS was first determined without optimizing support vector machines (SVM) parameters, where a region having a cancer probability greater than or equal to 50% was considered as a correct classification. The nonoptimized system had an f-measure of 85% and the Kappa coefficient of 71% (Rater's agreement, where raters are DSS and ground truth histology). The efficacy of the DSS after optimizing SVM parameters using a genetic algorithm had an f-measure of 89% and a Kappa coefficient of 80%. Thus, after optimization of the DSS there was a 4% increase in the f-measure and a 9% increase in the Kappa coefficient.
Conclusions: This DSS provides a cancer probability map for peripheral zone prostate tumors based on endorectal MP-MRI. These cancer probability maps can potentially aid radiologists in accurately localizing peripheral zone prostate cancers for planning targeted biopsies, focal therapy, and follow up for active surveillance.
Figures


References
-
- See http://www.cancer.org/ for American Cancer Society. Last accessed December 8, 2011.
-
- Ocak I., Bernardo M., Metzger G., Barrett T., Pinto P., Albert P. S., and Choyke P. L., “Dynamic contrast-enhanced MRI of prostate cancer at 3 T: A study of pharmacokinetic parameters,” AJR, Am. J. Roentgenol. 189, 849 (2007). - PubMed
-
- Turkbey B., Pinto P. A., Mani H., Bernardo M., Pang Y., McKinney Y. L., Khurana K., Ravizzini G. C., Albert P. S., Merino M. J., and Choyke P. L., “Prostate cancer: Value of multiparametric MR imaging at 3 T for detection–histopathologic correlation,” Radiology 255, 89–99 (2010).10.1148/radiol.09090475 - DOI - PMC - PubMed
-
- Langer D. L., van der Kwast T. H., Evans A. J., Trachtenberg J., Wilson B. C., and Haider M. A., “Prostate cancer detection with multi-parametric MRI: Logistic regression analysis of quantitative T2, diffusion-weighted imaging, and dynamic contrast-enhanced MRI,” J. Magn. Reson. Imaging 30, 327–334 (2009).10.1002/jmri.21824 - DOI - PubMed
Publication types
MeSH terms
Grants and funding
LinkOut - more resources
Full Text Sources
Other Literature Sources
Medical
