. 2012 Oct;10(5):432-56.
doi: 10.1089/adt.2012.456. Epub 2012 Jul 25.

Development and validation of a high-content screening assay to identify inhibitors of cytoplasmic dynein-mediated transport of glucocorticoid receptor to the nucleus

Affiliations

Development and validation of a high-content screening assay to identify inhibitors of cytoplasmic dynein-mediated transport of glucocorticoid receptor to the nucleus

Paul A Johnston et al. Assay Drug Dev Technol. 2012 Oct.

Abstract

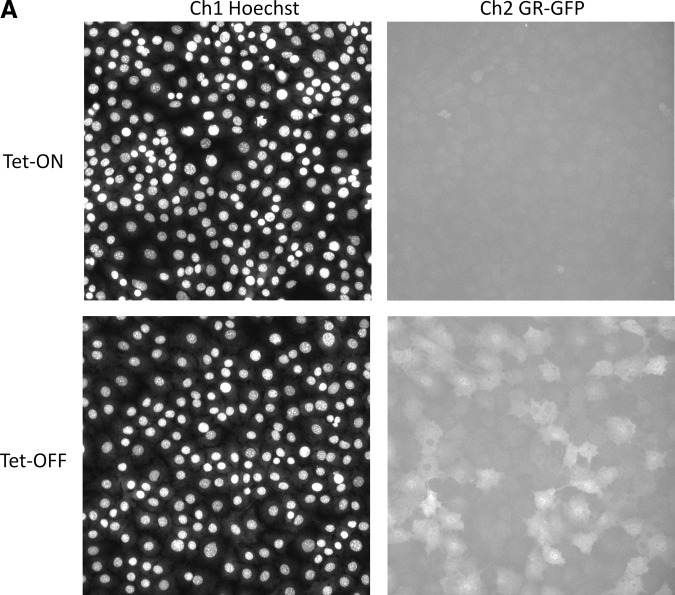
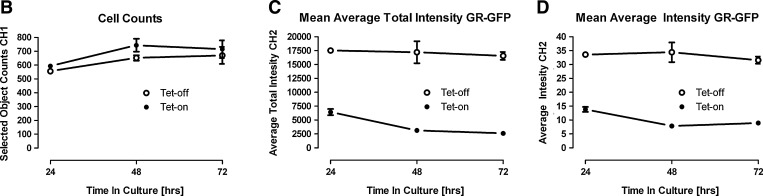
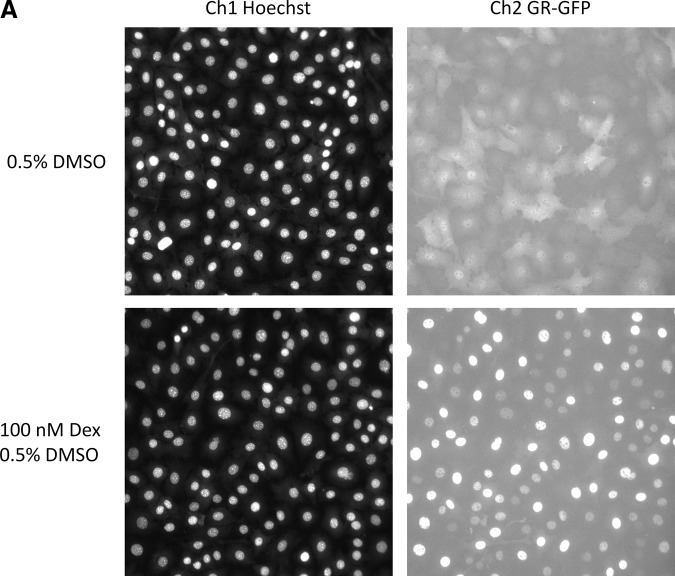
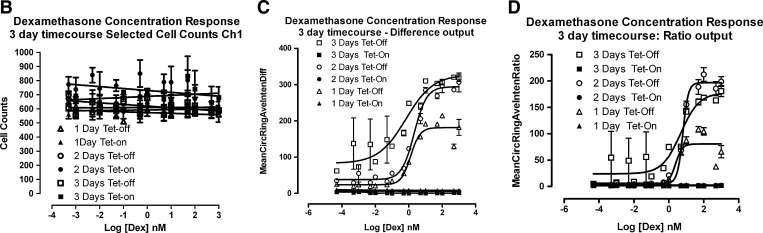
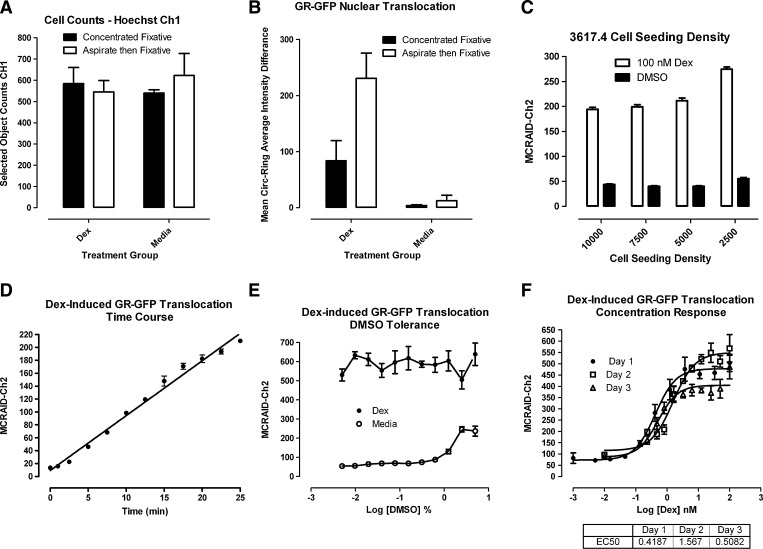
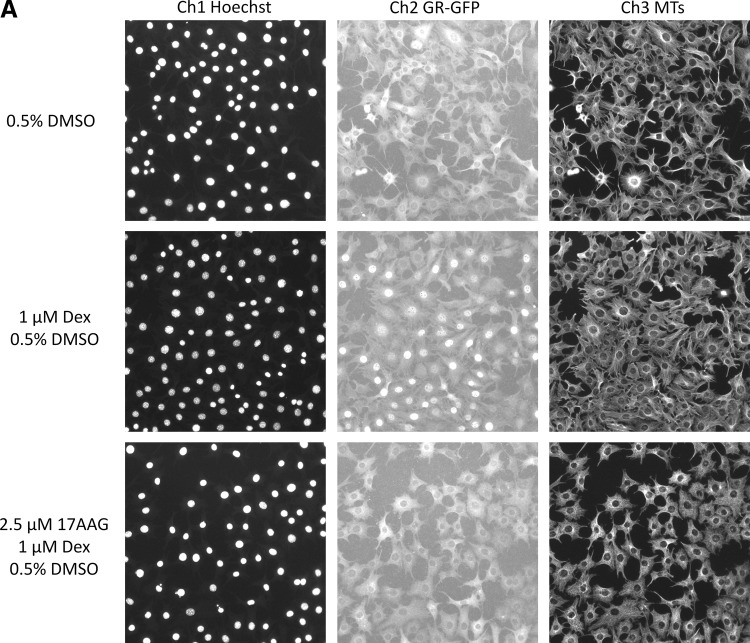
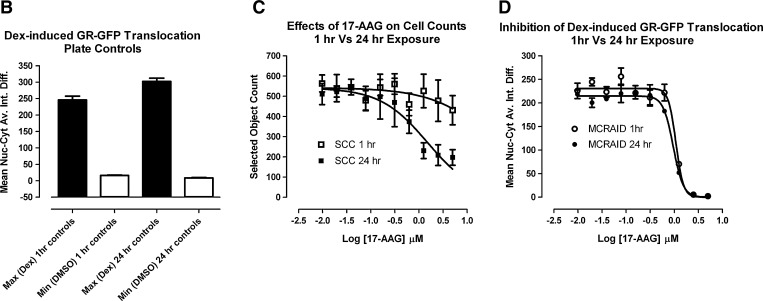
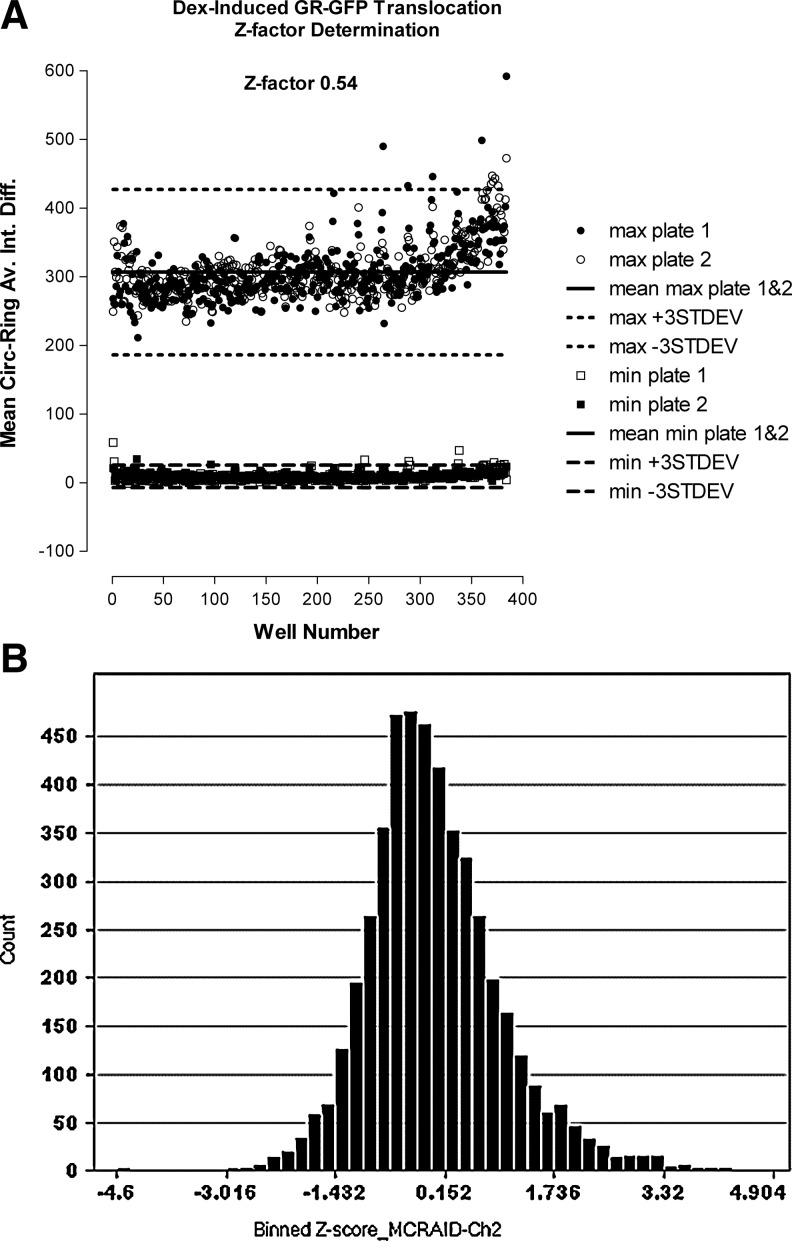
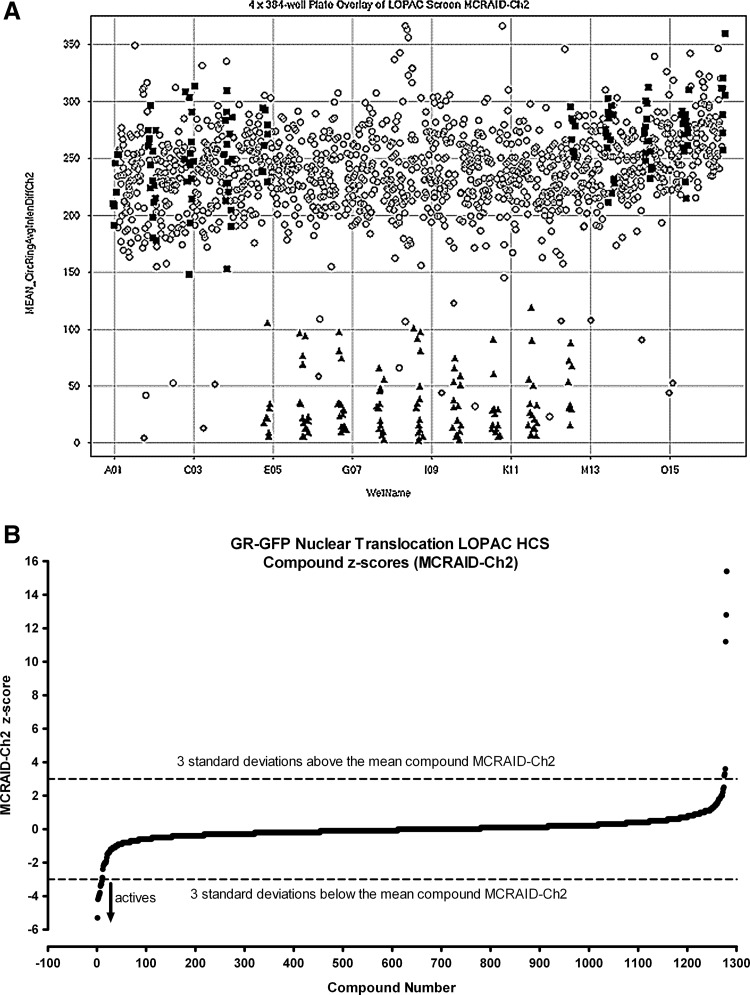
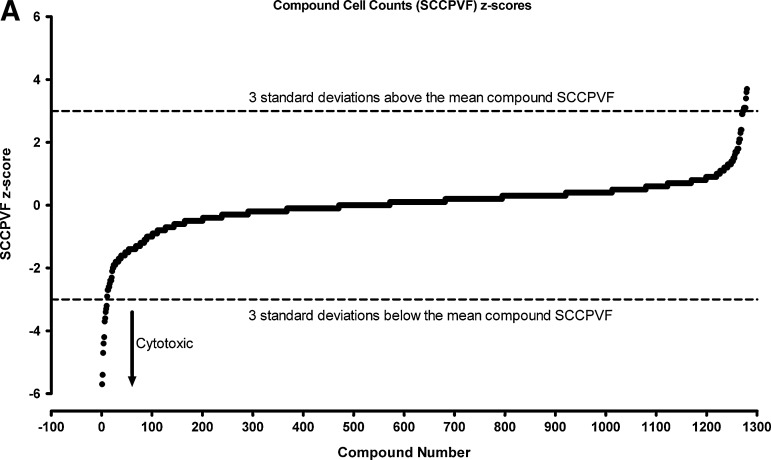
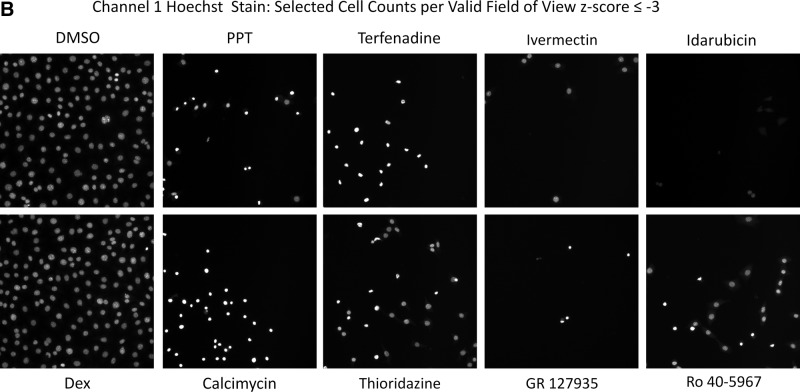
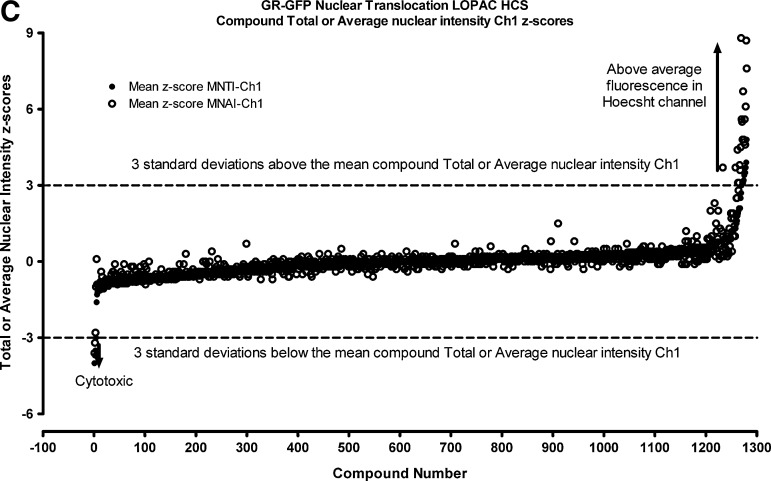
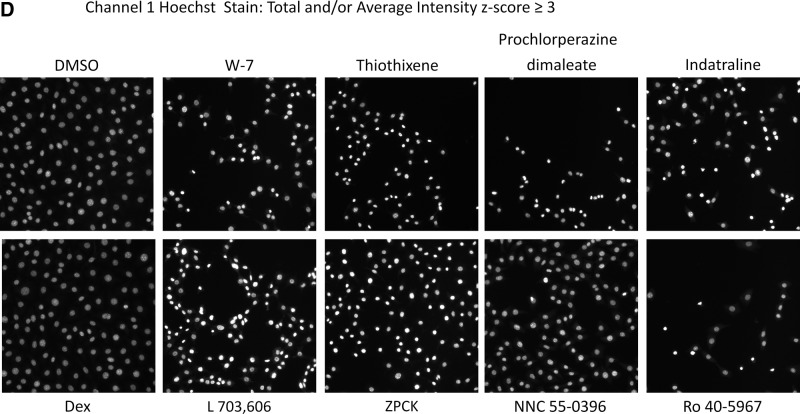
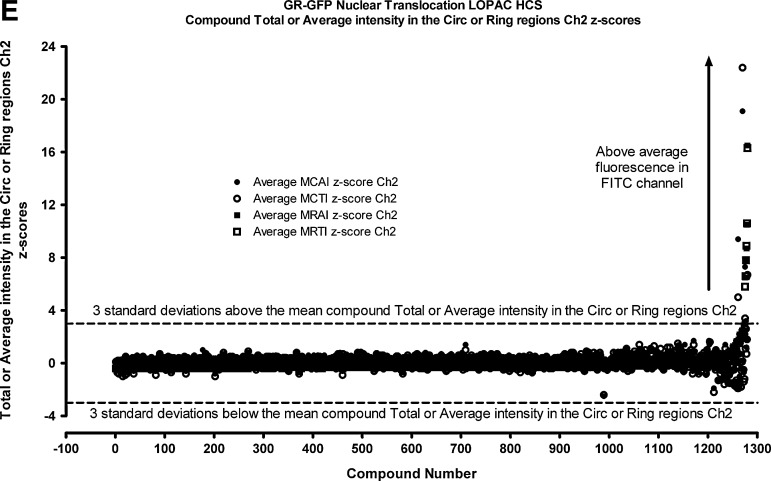
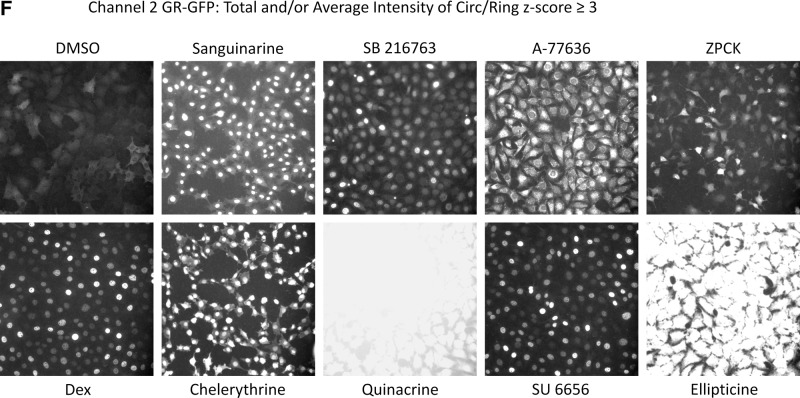
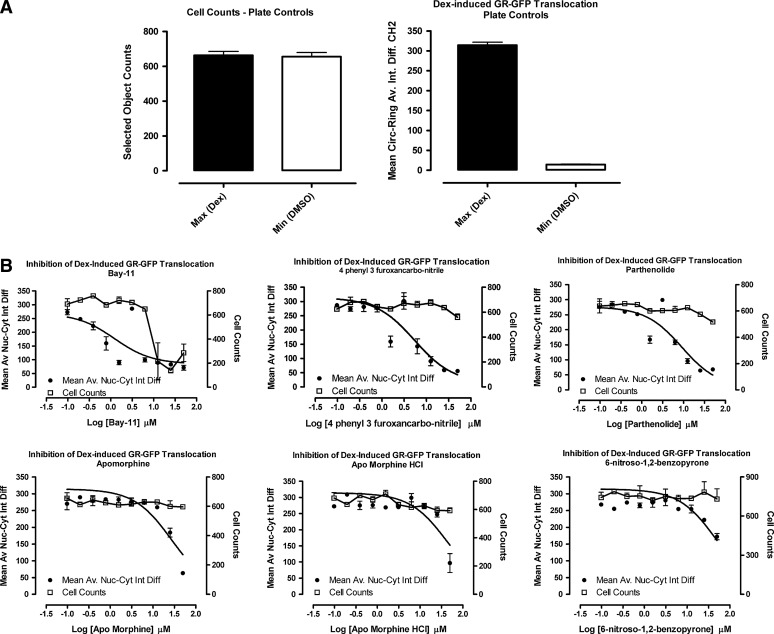
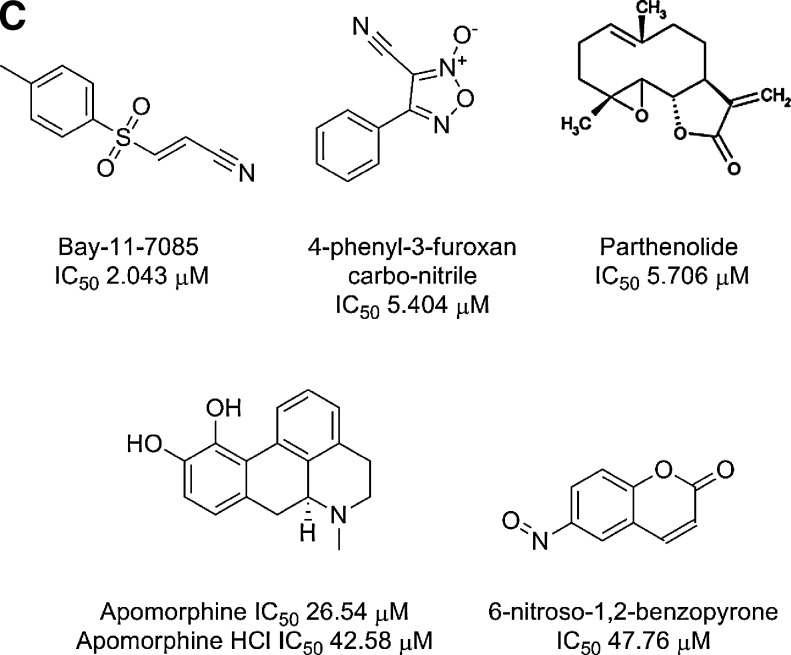
Rapid ligand-induced trafficking of glucocorticoid nuclear hormone receptor (GR) from the cytoplasm to the nucleus is an extensively studied model for intracellular retrograde cargo transport employed in constructive morphogenesis and many other cellular functions. Unfortunately, potent and selective small-molecule disruptors of this process are lacking, which has restricted pharmacological investigations. We describe here the development and validation of a 384-well high-content screening (HCS) assay to identify inhibitors of the rapid ligand-induced retrograde translocation of cytoplasmic glucocorticoid nuclear hormone receptor green fluorescent fusion protein (GR-GFP) into the nuclei of 3617.4 mouse mammary adenocarcinoma cells. We selected 3617.4 cells, because they express GR-GFP under the control of a tetracycline (Tet)-repressible promoter and are exceptionally amenable to image acquisition and analysis procedures. Initially, we investigated the time-dependent expression of GR-GFP in 3617.4 cells under Tet-on and Tet-off control to determine the optimal conditions to measure dexamethasone (Dex)-induced GR-GFP nuclear translocation on the ArrayScan-VTI automated imaging platform. We then miniaturized the assay into a 384-well format and validated the performance of the GR-GFP nuclear translocation HCS assay in our 3-day assay signal window and dimethylsulfoxide validation tests. The molecular chaperone heat shock protein 90 (Hsp90) plays an essential role in the regulation of GR steroid binding affinity and ligand-induced retrograde trafficking to the nucleus. We verified that the GR-GFP HCS assay captured the concentration-dependent inhibition of GR-GFP nuclear translocation by 17-AAG, a benzoquinone ansamycin that selectively blocks the binding and hydrolysis of ATP by Hsp90. We screened the 1280 compound library of pharmacologically active compounds set in the Dex-induced GR-GFP nuclear translocation assay and used the multi-parameter HCS data to eliminate cytotoxic compounds and fluorescent outliers. We identified five qualified hits that inhibited the rapid retrograde trafficking of GR-GFP in a concentration-dependent manner: Bay 11-7085, 4-phenyl-3-furoxancarbonitrile, parthenolide, apomorphine, and 6-nitroso-1,2-benzopyrone. The data presented here demonstrate that the GR-GFP HCS assay provides an effective phenotypic screen and support the proposition that screening a larger library of diversity compounds will yield novel small-molecule probes that will enable the further exploration of intracellular retrograde transport of cargo along microtubules, a process which is essential to the morphogenesis and function of all cells.


Figures

Fig. 1.
Fig. 1.
Time-dependent induction of GR-GFP expression in 3617.4 cells and quantitative data output by the TA image analysis algorithm. (A) Representative images of Hoechst-stained nuclei (Ch1) and GR-GFP (Ch2) from 1×10⁴ 3617.4 cells that were plated in 96-well Packard View plates and cultured for 48 h under Tet-on and Tet-off conditions. Cells were fixed with 3.7% formaldehyde containing 2 μg/mL Hoechst 33342, and individual gray-scale images of the two fluorescence channels (Hoechst and FITC) were sequentially acquired on the AS-VTI using a 20×0.4 NA objective with the XF100 excitation and emission filter sets. Images from a single representative experiment of numerous experiments are presented. (B) Hoechst-stained objects in Ch1 that exhibited the appropriate fluorescence intensities above background and morphological size characteristics (width, length, and area) were identified and classified by the TA image segmentation as nuclei, and the total number of selected Hoechst-stained objects (cell counts) identified are presented. (C) The nuclear mask derived from Ch1 was dilated five pixels to cover as much of the nuclear and cytoplasm regions as possible without going outside the cell boundary to create a target channel (Ch2) mask for each selected nuclear object identified in Ch1. The target masks were then used to segment the images from Ch2 and quantify the GR-GFP fluorescence within the nuclear and cytoplasm areas contained within the target regions of the 3617.4 cells. The well-averaged total fluorescence intensities of the GR-GFP signals within the target mask area of Ch2 are presented. (D) The well-averaged average fluorescence intensities of the GR-GFP signals within the target mask area of Ch2 are presented. The quantitative data derived by the TA image analysis from images of 3617.4 cells that were cultured for the indicated time points under Tet-on (•) and Tet-off (○) conditions represent the mean values±SD from six wells (n=6). The data from a single representative experiment of several experiments are presented. AS-VTI, ArrayScan VTI; Ch1, channel 1; Ch2, channel 2; GR-GFP, glucocorticoid nuclear hormone receptor green fluorescent fusion protein; NA, numerical aperture; SD, standard deviation of the mean; Tet, tetracycline; TA, target activation.
Fig. 1.
Fig. 1.
Time-dependent induction of GR-GFP expression in 3617.4 cells and quantitative data output by the TA image analysis algorithm. (A) Representative images of Hoechst-stained nuclei (Ch1) and GR-GFP (Ch2) from 1×10⁴ 3617.4 cells that were plated in 96-well Packard View plates and cultured for 48 h under Tet-on and Tet-off conditions. Cells were fixed with 3.7% formaldehyde containing 2 μg/mL Hoechst 33342, and individual gray-scale images of the two fluorescence channels (Hoechst and FITC) were sequentially acquired on the AS-VTI using a 20×0.4 NA objective with the XF100 excitation and emission filter sets. Images from a single representative experiment of numerous experiments are presented. (B) Hoechst-stained objects in Ch1 that exhibited the appropriate fluorescence intensities above background and morphological size characteristics (width, length, and area) were identified and classified by the TA image segmentation as nuclei, and the total number of selected Hoechst-stained objects (cell counts) identified are presented. (C) The nuclear mask derived from Ch1 was dilated five pixels to cover as much of the nuclear and cytoplasm regions as possible without going outside the cell boundary to create a target channel (Ch2) mask for each selected nuclear object identified in Ch1. The target masks were then used to segment the images from Ch2 and quantify the GR-GFP fluorescence within the nuclear and cytoplasm areas contained within the target regions of the 3617.4 cells. The well-averaged total fluorescence intensities of the GR-GFP signals within the target mask area of Ch2 are presented. (D) The well-averaged average fluorescence intensities of the GR-GFP signals within the target mask area of Ch2 are presented. The quantitative data derived by the TA image analysis from images of 3617.4 cells that were cultured for the indicated time points under Tet-on (•) and Tet-off (○) conditions represent the mean values±SD from six wells (n=6). The data from a single representative experiment of several experiments are presented. AS-VTI, ArrayScan VTI; Ch1, channel 1; Ch2, channel 2; GR-GFP, glucocorticoid nuclear hormone receptor green fluorescent fusion protein; NA, numerical aperture; SD, standard deviation of the mean; Tet, tetracycline; TA, target activation.
Fig. 2
Fig. 2
GR-GFP nuclear translocation induced by Dex treatment of 3617.4 cells and quantified by the CA image analysis algorithm. 3617.4 cells were seeded at 1×10⁴ cells per well in 96-well Packard View plates and cultured for 24, 48, or 72 h under Tet-on and Tet-off conditions, and then treated with the indicated concentrations of Dex for 30 min to evaluate and compare the Dex-induced concentration-dependent translocation of GR-GFP into the nucleus. After a 30 min exposure to Dex, 3617.4 cells were then fixed, and images of Hoechst-stained nuclei (Ch1) and GR-GFP (Ch2) were acquired on the AS-VTI using a 20×0.4 NA objective with the XF100 excitation and emission filter sets. (A) Representative images of Hoechst-stained nuclei (Ch1) and GR-GFP (Ch2) from 3617.4 cells that had been plated and cultured for 48 h under Tet-off conditions and were then treated with either 0.5% DMSO or 100 nM Dex and 0.5% DMSO for 30 min are presented. CA, compartmental analysis; Dex, dexamethasone; DMSO, dimethylsulfoxide. (B) Hoechst-stained objects in Ch1 that exhibited the appropriate fluorescent intensities above background and morphological size characteristics (width, length, and area) were identified and classified by the image segmentation as nuclei. The CA image analysis algorithm outputs the total number of selected Hoechst-stained objects/cell counts from Ch1, and the data presented are the mean selected object counts at the indicated concentrations of Dex (30 min) after 24 h (▲), 48 h (○), or 72 h (□) under Tet-on conditions, and after 24 h (▴), 48 h (•), or 72 h (■) under Tet-off conditions. (C) To quantify the relative distribution of the GR-GFP within the nucleus and the cytoplasm regions of the 3617.4 cells, the CA image analysis algorithm outputs a mean average intensity difference calculated by subtracting the average GR-GFP intensity in the ring (cytoplasm) region from the average GR-GFP intensity in the circ (nuclear) region of Ch2 to produce a mean circ–ring average intensity difference (MCRAID-Ch2). The data presented are the MCRAID-Ch2 at the indicated concentrations of Dex (30 min) after 24 h (▲), 48 h (○), or 72 h (□) under Tet-on conditions, and after 24 h (▴), 48 h (•), or 72 h (■) under Tet-off conditions. (D) The CA image analysis algorithm also provides an alternate method to quantify the relative distribution of the GR-GFP within the nucleus and the cytoplasm regions of the 3617.4 cells. The mean average intensity ratio is calculated by dividing the average GR-GFP intensity in the ring (cytoplasm) region into the average GR-GFP intensity in the circ (nuclear) region of Ch2 to produce a mean circ–ring average intensity ratio (MCRAR-Ch2). The data presented are the MCRAIR-Ch2 at the indicated concentrations of Dex (30 min) after 24 h (▲), 48 h (○), or 72 h (□) under Tet-on conditions, and after 24 h (▴), 48 h (•), or 72 h (■) under Tet-off conditions. The mean values±SD from triplicate wells (n=3) of a single representative experiment from three experiments are presented. The MCRAID-Ch2 and MCRAIR-Ch2 Dex concentration response data from 3617.4 cells cultured for 24, 48, or 72 h under Tet-off conditions were transformed and analyzed using Graphpad Prism software 4.03, and the resulting nonlinear regression curve was derived from the sigmoidal dose response variable slope equation Y=Bottom+(Top−Bottom)/(1+10^[(LogEC50−X) × HillSlope]).
Fig. 2
Fig. 2
GR-GFP nuclear translocation induced by Dex treatment of 3617.4 cells and quantified by the CA image analysis algorithm. 3617.4 cells were seeded at 1×10⁴ cells per well in 96-well Packard View plates and cultured for 24, 48, or 72 h under Tet-on and Tet-off conditions, and then treated with the indicated concentrations of Dex for 30 min to evaluate and compare the Dex-induced concentration-dependent translocation of GR-GFP into the nucleus. After a 30 min exposure to Dex, 3617.4 cells were then fixed, and images of Hoechst-stained nuclei (Ch1) and GR-GFP (Ch2) were acquired on the AS-VTI using a 20×0.4 NA objective with the XF100 excitation and emission filter sets. (A) Representative images of Hoechst-stained nuclei (Ch1) and GR-GFP (Ch2) from 3617.4 cells that had been plated and cultured for 48 h under Tet-off conditions and were then treated with either 0.5% DMSO or 100 nM Dex and 0.5% DMSO for 30 min are presented. CA, compartmental analysis; Dex, dexamethasone; DMSO, dimethylsulfoxide. (B) Hoechst-stained objects in Ch1 that exhibited the appropriate fluorescent intensities above background and morphological size characteristics (width, length, and area) were identified and classified by the image segmentation as nuclei. The CA image analysis algorithm outputs the total number of selected Hoechst-stained objects/cell counts from Ch1, and the data presented are the mean selected object counts at the indicated concentrations of Dex (30 min) after 24 h (▲), 48 h (○), or 72 h (□) under Tet-on conditions, and after 24 h (▴), 48 h (•), or 72 h (■) under Tet-off conditions. (C) To quantify the relative distribution of the GR-GFP within the nucleus and the cytoplasm regions of the 3617.4 cells, the CA image analysis algorithm outputs a mean average intensity difference calculated by subtracting the average GR-GFP intensity in the ring (cytoplasm) region from the average GR-GFP intensity in the circ (nuclear) region of Ch2 to produce a mean circ–ring average intensity difference (MCRAID-Ch2). The data presented are the MCRAID-Ch2 at the indicated concentrations of Dex (30 min) after 24 h (▲), 48 h (○), or 72 h (□) under Tet-on conditions, and after 24 h (▴), 48 h (•), or 72 h (■) under Tet-off conditions. (D) The CA image analysis algorithm also provides an alternate method to quantify the relative distribution of the GR-GFP within the nucleus and the cytoplasm regions of the 3617.4 cells. The mean average intensity ratio is calculated by dividing the average GR-GFP intensity in the ring (cytoplasm) region into the average GR-GFP intensity in the circ (nuclear) region of Ch2 to produce a mean circ–ring average intensity ratio (MCRAR-Ch2). The data presented are the MCRAIR-Ch2 at the indicated concentrations of Dex (30 min) after 24 h (▲), 48 h (○), or 72 h (□) under Tet-on conditions, and after 24 h (▴), 48 h (•), or 72 h (■) under Tet-off conditions. The mean values±SD from triplicate wells (n=3) of a single representative experiment from three experiments are presented. The MCRAID-Ch2 and MCRAIR-Ch2 Dex concentration response data from 3617.4 cells cultured for 24, 48, or 72 h under Tet-off conditions were transformed and analyzed using Graphpad Prism software 4.03, and the resulting nonlinear regression curve was derived from the sigmoidal dose response variable slope equation Y=Bottom+(Top−Bottom)/(1+10^[(LogEC50−X) × HillSlope]).
Fig. 3.
Fig. 3.
Optimization of the 384-well Dex-induced GR-GFP nuclear translocation high-content screening assay. Images of Hoechst-stained nuclei (Ch1) and GR-GFP (Ch2) were acquired on the AS-VTI using a 20×0.4 NA objective with the XF100 excitation and emission filter sets, and the MCRAID-Ch2 output of CA image analysis algorithm was used to quantify the relative distribution of the GR-GFP within the nucleus and cytoplasm of the 3617.4 cells. (A) Effects of fixation method on cell counts: 3617.4 cells were seeded into 384-well assay plates at 2.5×10³ cells per well and cultured under Tet-off conditions for 48 h at 37°C, 5% CO2 and 95% humidity. The cells were then treated for 30 min with either 0.5% DMSO or 100 nM Dex in 0.5% DMSO before fixation. The cells were either fixed by adding concentrated fixative directly to wells containing cells and media to achieve a final concentration of 3.7% formaldehyde containing 2 μg/mL Hoechst 33342 (■), or the media were aspirated first and 3.7% formaldehyde containing 2 μg/mL Hoechst 33342 was added directly to the cells (□). The mean values±SD from eight wells (n=8) of a single representative experiment from two experiments are presented. (B) Effects of fixation method on Dex-induced GR-GFP nuclear translocation assay signal window: 3617.4 cells were seeded into 384-well assay plates at 2.5×10³ cells per well and cultured under Tet-off conditions for 48 h at 37°C, 5% CO2, and 95% humidity. The cells were then treated for 30 min with either 0.5% DMSO or 100 nM Dex in 0.5% DMSO before fixation. The cells were either fixed by adding concentrated fixative directly to wells containing cells and media to achieve a final concentration of 3.7% formaldehyde containing 2 μg/mL Hoechst 33342 (■), or the media were aspirated first, and 3.7% formaldehyde containing 2 μg/mL Hoechst 33342 was added directly to the cells (□). The mean values±SD from eight wells (n=8) of a single representative experiment from two experiments are presented. (C) Cell seeding density: 3617.4 cells were seeded into 384-well assay plates at the indicated cell densities ranging between 2.5×10³ and 10×103 cells per well and cultured under Tet-off conditions for 48 h at 37 °C, 5% CO2, and 95% humidity. Cells were then treated for 30 min with either 0.5% DMSO (■) or 100 nM Dex in 0.5% DMSO (□) before fixation with 3.7% formaldehyde containing 2 μg/mL Hoechst 33342. The mean values±SD from 12 wells (n=12) of a single representative experiment from three experiments are presented. (D) Dex-induced GR-GFP nuclear translocation time course: 2.5×10³ 3617.4 cells were seeded into the wells of 384-well assay plates and cultured for 48 h under Tet-off conditions at 37°C, 5% CO2, and 95% humidity. Cells were then exposed to 100 nM Dex in 0.5% DMSO (•) for the indicated time periods before fixation with 3.7% formaldehyde containing 2 μg/mL Hoechst 33342. The mean values±SD from three wells (n=3) of a single representative experiment from two experiments are presented. The line represents a linear regression of these data that produced an r2 correlation coefficient of 0.98. (E) DMSO tolerance: 2.5×10³ 3617.4 cells were seeded into the wells of 384-well assay plates and cultured for 48 h under Tet-off conditions at 37°C, 5% CO2, and 95% humidity. Cells were then exposed to either 100 nM Dex (•) or medium (○) at the indicated concentrations of DMSO for 30 min before fixation with 3.7% formaldehyde containing 2 μg/mL Hoechst 33342. The mean values±SD from four wells (n=4) of a single representative experiment from two experiments are presented. (F) Dex-induced GR-GFP nuclear translocation concentration responses: 2.5×10³ 3617.4 cells were seeded into the wells of 384-well assay plates and cultured for 48 h under Tet-off conditions at 37°C, 5% CO2, and 95% humidity. Cells were then exposed to the indicated concentration of Dex for 30 min before fixation with 3.7% formaldehyde containing 2 μg/mL Hoechst 33342. The mean values±SD of four wells (n=4) from three representative experiments are presented: Day 1 (•), Day 2 (□), and Day 3 (△).
Fig. 4.
Fig. 4.
Inhibition of Dex-induced GR-GFP translocation by 17-AAG: 2.5×10³ 3617.4 cells were cultured in Tet-free media for 48 h and exposed to 17-(allylamino)-17-demethoxy-geldanamycin (17-AAG) concentrations ranging from 0.01 to 5.0 μM either 24 or 1 h before the addition of 1 μM Dex for 30 min. (A) Representative images of Hoechst-stained nuclei (Ch1), GR-GFP (Ch2) and antibody stained microtubules (Ch3) from treated 3617.4 cells. Images of three fluorescent channels were sequentially acquired on the AS-VTI using a 20×0.4 NA objective with the XF53 (Hoechst and FITC) and the XF32 (TRITC) excitation and emission filter sets to obtain images of Hoechst-stained nuclei, GR-GFP, and anti-α-tubulin antibody stained microtubules. Images are presented from 3617.4 cells exposed to three different treatment conditions: 0.5% DMSO for 30 min, 1 μM Dex in 0.5% DMSO for 30 min, and cells pretreated with 2.5 μM 17-AAG for 1 h before 1 μM Dex in 0.5% DMSO for 30 min. Ch3, channel 3. (B) DMSO and Dex plate controls for 1 and 24 h treatment conditions. The MCRAID-Ch2 output of CA image analysis algorithm was used to quantify the relative distribution of the GR-GFP within the nucleus and cytoplasm of the 3617.4 cells and the data from the twenty-four 0.5% DMSO (□) MIN plate control wells and the thirty-two 1 μM Dex + 0.5% DMSO (■) MAX plate control wells from the 1 and 24 h 17-AAG exposure plates are presented. The mean MCRAID-Ch2 values±SD from one representative experiment of three are presented. (C) Concentration-dependent effects of 1 and 24 h 17-AAG exposure on cell counts. The selected object counts derived from the Hoechst-stained nuclei by the CA image analysis algorithm from 2.5×10³ 3617.4 cells that were cultured in Tet-free media for 48 h and exposed to the indicated concentrations of 17-AAG for either 24 h (■) or 1 h (□) before the addition of 1 μM Dex for 30 min are presented. The mean SCCPVF values±SD of four wells (n=4) from one representative experiment of three are presented. (D) Concentration-dependent effects of 1 and 24 h 17-AAG exposure on GR-GFP nuclear translocation. The MCRAID-Ch2 output of the CA image analysis algorithm from 2.5×10³ 3617.4 cells that were cultured in Tet-free media for 48 h and exposed to the indicated concentrations of 17-AAG for either 24 h (■) or 1 h (□) before the addition of 1 μM Dex for 30 min are presented. The mean MCRAID-Ch2 values±SD of four wells (n=4) from one representative experiment of three are presented. MAX, maximum; MIN, minimum; SCCPVF, selected cell (object) counts per valid field of view.
Fig. 4.
Fig. 4.
Inhibition of Dex-induced GR-GFP translocation by 17-AAG: 2.5×10³ 3617.4 cells were cultured in Tet-free media for 48 h and exposed to 17-(allylamino)-17-demethoxy-geldanamycin (17-AAG) concentrations ranging from 0.01 to 5.0 μM either 24 or 1 h before the addition of 1 μM Dex for 30 min. (A) Representative images of Hoechst-stained nuclei (Ch1), GR-GFP (Ch2) and antibody stained microtubules (Ch3) from treated 3617.4 cells. Images of three fluorescent channels were sequentially acquired on the AS-VTI using a 20×0.4 NA objective with the XF53 (Hoechst and FITC) and the XF32 (TRITC) excitation and emission filter sets to obtain images of Hoechst-stained nuclei, GR-GFP, and anti-α-tubulin antibody stained microtubules. Images are presented from 3617.4 cells exposed to three different treatment conditions: 0.5% DMSO for 30 min, 1 μM Dex in 0.5% DMSO for 30 min, and cells pretreated with 2.5 μM 17-AAG for 1 h before 1 μM Dex in 0.5% DMSO for 30 min. Ch3, channel 3. (B) DMSO and Dex plate controls for 1 and 24 h treatment conditions. The MCRAID-Ch2 output of CA image analysis algorithm was used to quantify the relative distribution of the GR-GFP within the nucleus and cytoplasm of the 3617.4 cells and the data from the twenty-four 0.5% DMSO (□) MIN plate control wells and the thirty-two 1 μM Dex + 0.5% DMSO (■) MAX plate control wells from the 1 and 24 h 17-AAG exposure plates are presented. The mean MCRAID-Ch2 values±SD from one representative experiment of three are presented. (C) Concentration-dependent effects of 1 and 24 h 17-AAG exposure on cell counts. The selected object counts derived from the Hoechst-stained nuclei by the CA image analysis algorithm from 2.5×10³ 3617.4 cells that were cultured in Tet-free media for 48 h and exposed to the indicated concentrations of 17-AAG for either 24 h (■) or 1 h (□) before the addition of 1 μM Dex for 30 min are presented. The mean SCCPVF values±SD of four wells (n=4) from one representative experiment of three are presented. (D) Concentration-dependent effects of 1 and 24 h 17-AAG exposure on GR-GFP nuclear translocation. The MCRAID-Ch2 output of the CA image analysis algorithm from 2.5×10³ 3617.4 cells that were cultured in Tet-free media for 48 h and exposed to the indicated concentrations of 17-AAG for either 24 h (■) or 1 h (□) before the addition of 1 μM Dex for 30 min are presented. The mean MCRAID-Ch2 values±SD of four wells (n=4) from one representative experiment of three are presented. MAX, maximum; MIN, minimum; SCCPVF, selected cell (object) counts per valid field of view.
Fig. 5.
Fig. 5.
(A) Three-day assay signal window and Z-factor determination, and (B) DMSO validation tests. (A) The assay signal window and Z-factor determination consists of three independent experiments of two full plates, each of the MIN (0.5% DMSO) and MAX (1 μM Dex in 0.5% DMSO) plate controls conducted on three separate days (Table 3). Four 384-well plates per day were seeded at 2.5×10³ 3617.4 cells per well and were cultured under Tet-off conditions for 48 h at 37°C, 5% CO2, and 95% humidity. Cells were then treated for 30 min with either 0.5% DMSO (MIN) or 100 nM Dex in 0.5% DMSO (MAX) before fixation with 3.7% formaldehyde containing 2 μg/mL Hoechst 33342. Scatter plot of the raw GR-GFP MCRAID-Ch2 data from the two full 384-well plates each of MAX (• plate 1, ○ plate 2) and MIN (□ plate 1, ■ plate 2) controls performed on day two of the 3-day test. The mean MCRAID-Ch2 data for the of MAX (n=768) and MIN (n=768) controls (solid lines)±3 SD (dashed lines) are presented. (B) The 3-day 5-plate DMSO validation test mimics 3 days of automated screening operations with a total of fifteen 384-well plates tested (Table 2). A results frequency distribution plot of the calculated z-score data for the 4,800 DMSO wells of the 15 plates is presented. The z-score data closely approximated a normal distribution with only two wells exhibiting z-scores ≤−3, producing an estimated false-positive rate of 0.042%.
Fig. 6.
Fig. 6.
Dex-induced GR-GFP nuclear translocation LOPAC high-content screen. Four 384-well plates were seeded at 2.5×10³ 3617.4 cells per well that were cultured under Tet-off conditions for 48 h at 37°C, 5% CO2, and 95% humidity. Diluted compounds were then transferred from the 4×384-well LOPAC daughter plates to the GR-GFP nuclear translocation assay plates to provide a final screening concentration of 50 μM and then incubated at 37°C, 5% CO2, and 95% humidity for 60 min. Compound-treated wells and MAX plate controls then received 100 nM Dex in 0.5% DMSO, MIN controls received 0.5% DMSO, and assay plates were then incubated at 37°C, 5% CO2, and 95% humidity for 30 min before fixation with 3.7% formaldehyde containing 2 μg/mL Hoechst 33342. Images of Hoechst-stained nuclei and GR-GFP were then acquired on the AS-VTI platform and analyzed with the CA image analysis algorithm as just described. (A) Overlay scatter plot of the raw GR-GFP MCRAID-Ch2 data from the 4×384-well assay plates of the LOPAC screen; MAX (■) controls, MIN (▴) controls, and compound-treated wells (○). (B) The MCRAID-Ch2 values of the 320 compound wells on each assay plate were processed through an ActivityBase® template to calculate individual z-scores, which are presented for the 1280 LOPAC compounds (■). Dashed lines are plotted for z-scores of −3 and +3 and represent thresholds for compound responses that deviated by ±3SD of the average compound response (n=320) on each plate. LOPAC, library of pharmacologically active compounds.
Fig. 7.
Fig. 7.
Cytotoxic and fluorescent outlier analysis for the GR-GFP nuclear translocation LOPAC high-content screen. (A) The SCCPVF values of the 320 compound wells on each assay plate were processed through an ActivityBase template to calculate individual z-scores, which are presented for the 1,280 LOPAC compounds (■). Dashed lines are plotted for z-scores of −3 and +3 and represent thresholds for compound-treated 3617.4 cell counts that deviated by ±3SD of the average compound response (n=320) on each plate. (B) Representative individual gray-scale images (Ch1) of the Hoechst-stained nuclei of 3617.4 cells from MIN (0.5% DMSO) or MAX (1 μM Dex in 0.5% DMSO) control wells or from the indicated compound-treated wells with SCCPVF z-scores <−3. (C) The MNTI-Ch1 (•) and MNAI-Ch1 (○) values of the 320 compound wells on each assay plate were processed through an ActivityBase template to calculate individual z-scores, which are presented for the 1,280 LOPAC compounds. Dashed lines are plotted for z-scores of −3 and +3 and represent thresholds for compound-treated 3617.4 Hoechst-stained nuclear fluorescent intensities that deviated by ±3SD of the average compound response (n=320) on each plate. (D) Representative individual gray-scale images (Ch1) of the Hoechst-stained nuclei of 3617.4 cells from MIN (0.5% DMSO) or MAX (1 μM Dex in 0.5% DMSO) control wells or from the indicated compound-treated wells with MNTI-Ch1 or MNAI-Ch1 z scores >3. MNAI-Ch1, mean nuclear average intensity channel 1; MNTI-Ch1, mean nuclear total intensity channel 1. (E) The MCTI-Ch2 (○), MCAI-Ch2 (•), MRTI-Ch2 (□), and MRAI-Ch2 (■) values of the 320 compound wells on each assay plate were processed through an ActivityBase template to calculate individual z scores, which are presented for the 1,280 LOPAC compounds. Dashed lines are plotted for z scores of −3 and +3 and represent thresholds for compound-treated 3617.4 Hoechst-stained nuclear fluorescent intensities that deviated by ±3SD of the average compound response (n=320) on each plate. (F) Representative individual gray-scale images (Ch2) of the GR-GFP of 3617.4 cells from MIN (0.5% DMSO) or MAX (1 μM Dex in 0.5% DMSO) control wells or from the indicated compound-treated wells with MCTI, MCAI, MRTI, or MRAI z scores in Ch2 >3. MCAI-Ch2, mean circ (nuclear) average intensity in channel 2; MCTI-Ch2, mean circ (nuclear) total intensity in channel 2; MRAI-Ch2, mean ring (cytoplasm) average intensity channel 2; MRTI-Ch2, mean ring (cytoplasm) total intensity in channel 2.
Fig. 7.
Fig. 7.
Cytotoxic and fluorescent outlier analysis for the GR-GFP nuclear translocation LOPAC high-content screen. (A) The SCCPVF values of the 320 compound wells on each assay plate were processed through an ActivityBase template to calculate individual z-scores, which are presented for the 1,280 LOPAC compounds (■). Dashed lines are plotted for z-scores of −3 and +3 and represent thresholds for compound-treated 3617.4 cell counts that deviated by ±3SD of the average compound response (n=320) on each plate. (B) Representative individual gray-scale images (Ch1) of the Hoechst-stained nuclei of 3617.4 cells from MIN (0.5% DMSO) or MAX (1 μM Dex in 0.5% DMSO) control wells or from the indicated compound-treated wells with SCCPVF z-scores <−3. (C) The MNTI-Ch1 (•) and MNAI-Ch1 (○) values of the 320 compound wells on each assay plate were processed through an ActivityBase template to calculate individual z-scores, which are presented for the 1,280 LOPAC compounds. Dashed lines are plotted for z-scores of −3 and +3 and represent thresholds for compound-treated 3617.4 Hoechst-stained nuclear fluorescent intensities that deviated by ±3SD of the average compound response (n=320) on each plate. (D) Representative individual gray-scale images (Ch1) of the Hoechst-stained nuclei of 3617.4 cells from MIN (0.5% DMSO) or MAX (1 μM Dex in 0.5% DMSO) control wells or from the indicated compound-treated wells with MNTI-Ch1 or MNAI-Ch1 z scores >3. MNAI-Ch1, mean nuclear average intensity channel 1; MNTI-Ch1, mean nuclear total intensity channel 1. (E) The MCTI-Ch2 (○), MCAI-Ch2 (•), MRTI-Ch2 (□), and MRAI-Ch2 (■) values of the 320 compound wells on each assay plate were processed through an ActivityBase template to calculate individual z scores, which are presented for the 1,280 LOPAC compounds. Dashed lines are plotted for z scores of −3 and +3 and represent thresholds for compound-treated 3617.4 Hoechst-stained nuclear fluorescent intensities that deviated by ±3SD of the average compound response (n=320) on each plate. (F) Representative individual gray-scale images (Ch2) of the GR-GFP of 3617.4 cells from MIN (0.5% DMSO) or MAX (1 μM Dex in 0.5% DMSO) control wells or from the indicated compound-treated wells with MCTI, MCAI, MRTI, or MRAI z scores in Ch2 >3. MCAI-Ch2, mean circ (nuclear) average intensity in channel 2; MCTI-Ch2, mean circ (nuclear) total intensity in channel 2; MRAI-Ch2, mean ring (cytoplasm) average intensity channel 2; MRTI-Ch2, mean ring (cytoplasm) total intensity in channel 2.
Fig. 8
Fig. 8
Concentration-dependent inhibition of Dex-induced GR-GFP nuclear translocation by selected LOPAC actives. 384-well plates were seeded with 2.5×10³ 3617.4 cells per well and cultured under Tet-off conditions for 48 h at 37°C, 5% CO2, and 95% humidity. Diluted compounds were then transferred to the GR-GFP nuclear translocation assay plates to provide the indicated concentrations and then incubated at 37°C, 5% CO2, and 95% humidity for 60 min. Compound-treated wells and MAX plate controls then received 100 nM Dex in 0.5% DMSO, MIN controls received 0.5% DMSO, and assay plates were then incubated at 37°C, 5% CO2, and 95% humidity for 30 min before fixation with 3.7% formaldehyde containing 2 μg/mL Hoechst 33342. Images of Hoechst-stained nuclei and GR-GFP were then acquired on the AS-VTI platform and analyzed with the CA image analysis algorithm as just described. (A) The SCCPFV and the MCRAID-Ch2 outputs of CA image analysis algorithm were used to quantify the number of cells analyzed and the relative distribution of the GR-GFP within the nucleus and cytoplasm of the 3617.4 cells, respectively, and the data from the twenty-four 0.5% DMSO (□) MIN plate control wells and the thirty two 1 μM Dex and 0.5% DMSO (■) MAX plate control wells from the IC50 plates are presented. The mean SCCPFV and MCRAID-Ch2 values±SD from one representative experiment of three are presented. (B) The SCCPFV (□, right Y-axis) and the MCRAID-Ch2 (•, left Y-axis) outputs of CA image analysis algorithm were used to quantify the number of cells analyzed and the relative distribution of the GR-GFP within the nucleus and cytoplasm of the 3617.4 cells, respectively, and the data for the five hit compounds tested at the indicated concentrations are presented. Data for both R-(−)-Apomorphine hydrochloride hemihydrate (apomorphine) and (S)-(+)-Apomorphine hydrochloride hydrate (apomorphine-HCl) are presented.The mean SCCPFV and MCRAID-Ch2 values±SD from one representative experiment of three are presented. The concentration response data from triplicate wells (n=3) at each compound concentration along with their resulting nonlinear regression curves were plotted using the sigmoidal dose response variable slope equation Y=Bottom+(Top−Bottom)/(1+10^[(LogEC50−X) × HillSlope]) using Graphpad Prism software 4.03. (C) The chemical structures of the five concentration-dependent inhibitors of Dex-induced GR-GFP nuclear translocation are presented. A single structure is presented for R-(−)-apomorphine hydrochloride hemihydrate (apomorphine) and (S)-(+)-apomorphine hydrochloride hydrate (apomorphine-HCl).
Fig. 8
Fig. 8
Concentration-dependent inhibition of Dex-induced GR-GFP nuclear translocation by selected LOPAC actives. 384-well plates were seeded with 2.5×10³ 3617.4 cells per well and cultured under Tet-off conditions for 48 h at 37°C, 5% CO2, and 95% humidity. Diluted compounds were then transferred to the GR-GFP nuclear translocation assay plates to provide the indicated concentrations and then incubated at 37°C, 5% CO2, and 95% humidity for 60 min. Compound-treated wells and MAX plate controls then received 100 nM Dex in 0.5% DMSO, MIN controls received 0.5% DMSO, and assay plates were then incubated at 37°C, 5% CO2, and 95% humidity for 30 min before fixation with 3.7% formaldehyde containing 2 μg/mL Hoechst 33342. Images of Hoechst-stained nuclei and GR-GFP were then acquired on the AS-VTI platform and analyzed with the CA image analysis algorithm as just described. (A) The SCCPFV and the MCRAID-Ch2 outputs of CA image analysis algorithm were used to quantify the number of cells analyzed and the relative distribution of the GR-GFP within the nucleus and cytoplasm of the 3617.4 cells, respectively, and the data from the twenty-four 0.5% DMSO (□) MIN plate control wells and the thirty two 1 μM Dex and 0.5% DMSO (■) MAX plate control wells from the IC50 plates are presented. The mean SCCPFV and MCRAID-Ch2 values±SD from one representative experiment of three are presented. (B) The SCCPFV (□, right Y-axis) and the MCRAID-Ch2 (•, left Y-axis) outputs of CA image analysis algorithm were used to quantify the number of cells analyzed and the relative distribution of the GR-GFP within the nucleus and cytoplasm of the 3617.4 cells, respectively, and the data for the five hit compounds tested at the indicated concentrations are presented. Data for both R-(−)-Apomorphine hydrochloride hemihydrate (apomorphine) and (S)-(+)-Apomorphine hydrochloride hydrate (apomorphine-HCl) are presented.The mean SCCPFV and MCRAID-Ch2 values±SD from one representative experiment of three are presented. The concentration response data from triplicate wells (n=3) at each compound concentration along with their resulting nonlinear regression curves were plotted using the sigmoidal dose response variable slope equation Y=Bottom+(Top−Bottom)/(1+10^[(LogEC50−X) × HillSlope]) using Graphpad Prism software 4.03. (C) The chemical structures of the five concentration-dependent inhibitors of Dex-induced GR-GFP nuclear translocation are presented. A single structure is presented for R-(−)-apomorphine hydrochloride hemihydrate (apomorphine) and (S)-(+)-apomorphine hydrochloride hydrate (apomorphine-HCl).

Similar articles

Cited by

References

    1. Hirokawa N. Kinesin and dynein superfamily proteins and the mechanism of organelle transport. Science. 1998;279:519–526. - PubMed
    1. Hirokawa N. Noda Y. Tanaka Y. Niwa S. Kinesin superfamily motor proteins and intracellular transport. Nat Rev Mol Cell Biol. 2009;10:682–696. - PubMed
    1. Vallee R. Williams JC. Varma D. Barnhart LE. Dynein: an ancient motor protein involved in multiple modes of transport. J Neurobiol. 2003;58:189–200. - PubMed
    1. Vallee R. Seale GE. Tsai JW. Emerging roles for myosin II and cytoplasmic dynein in migrating neurons and growth cones. Trends Cell Biol. 2009;19:347–355. - PMC - PubMed
    1. Vallee R. Höök P. Autoinhibitory and other autoregulatory elements within the dynein motor domain. J Struct Biol. 2006;156:175–181. - PubMed

Publication types

MeSH terms

LinkOut - more resources