

Hydrogen sulfide inhibits the translational expression of hypoxia-inducible factor-1α
- PMID: 22831549
- PMCID: PMC3514762
- DOI: 10.1111/j.1476-5381.2012.02113.x
Hydrogen sulfide inhibits the translational expression of hypoxia-inducible factor-1α
Abstract
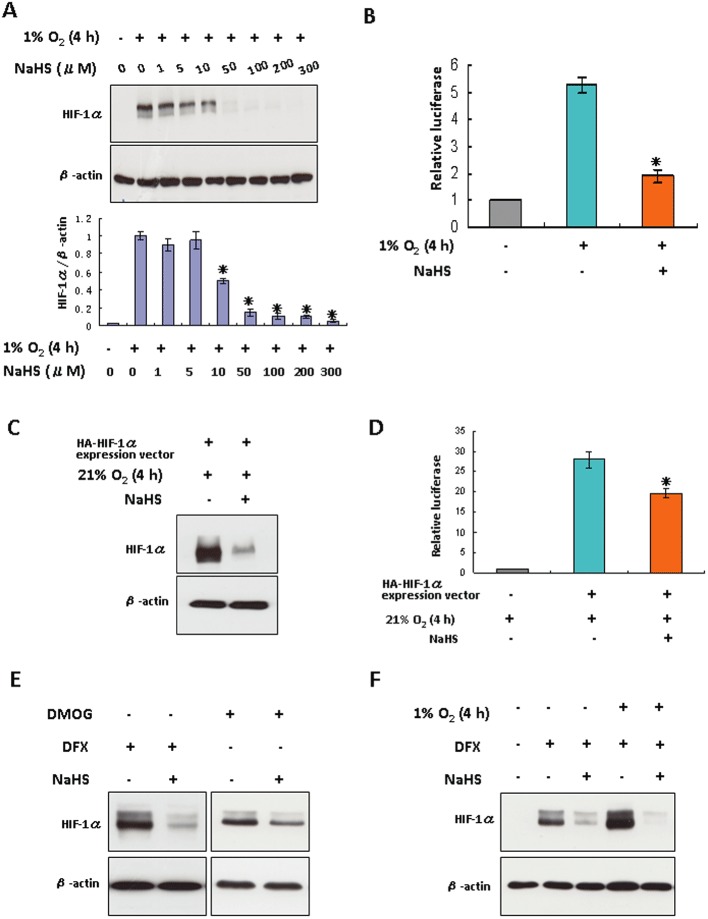
Background and purpose: The accumulation of hypoxia-inducible factor-1α (HIF-1α) is under the influence of hydrogen sulfide (H(2) S), which regulates hypoxia responses. The regulation of HIF-1α accumulation by H(2) S has been shown, but the mechanisms for this effect are largely elusive and controversial. This study aimed at addressing the controversial mechanisms for and the functional importance of the interaction of H(2) S and HIF-1α protein.
Experimental approach: HIF-1α protein levels and HIF-1α transcriptional activity were detected by Western blotting and luciferase assay. The mechanisms for H(2) S-regulated HIF-1α protein levels were determined using short interfering RNA transfection, co-immunoprecipitation and 7-methyl-GTP sepharose 4B pull-down assay. Angiogenic activity was evaluated using tube formation assay in EA.hy926 cells.
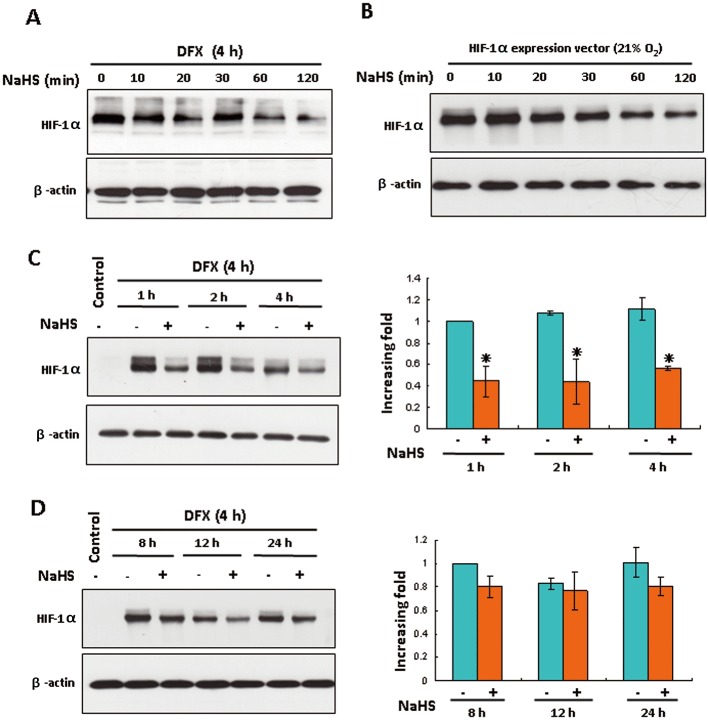
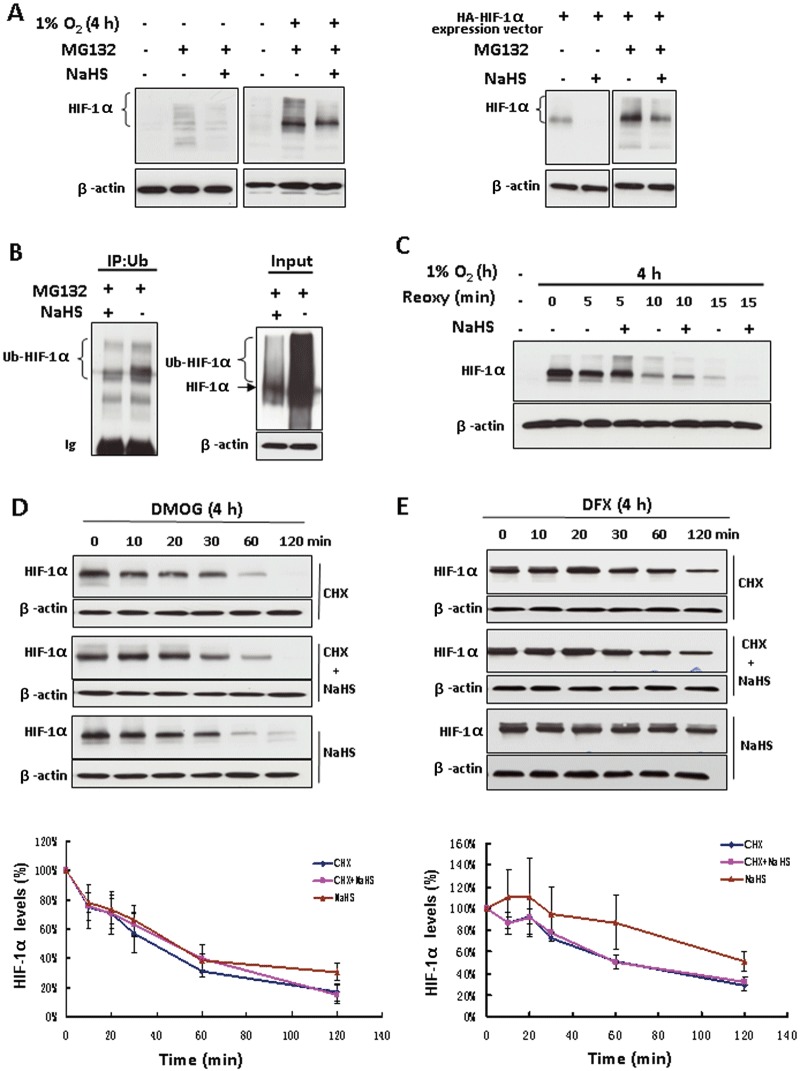
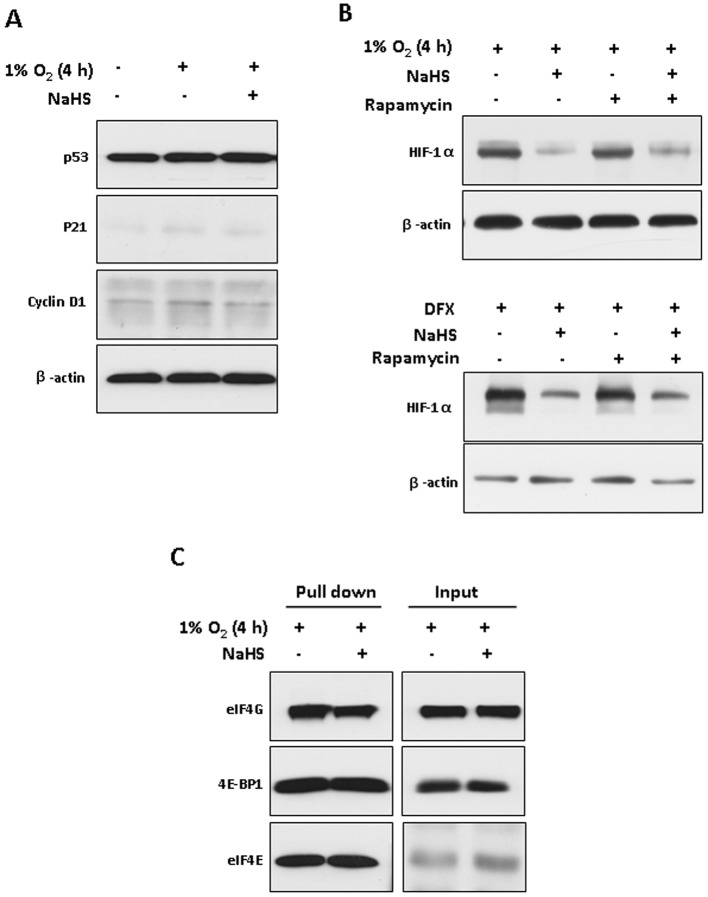
Key results: The accumulation of HIF-1α protein under hypoxia (1% O(2) ) or hypoxia-mimetic conditions was reversed by sodium hydrosulfide (NaHS). This effect of NaHS was not altered after blocking the ubiquitin-proteasomal pathway for HIF-1α degradation; however, blockade of protein translation with cycloheximide abolished the effect of NaHS on the half-life of HIF-1α protein. Knockdown of eukaryotic translation initiation factor 2α (eIF2α) suppressed the effect of NaHS on HIF-1α protein accumulation under hypoxia. NaHS inhibited the expression of VEGF under hypoxia. It also decreased in vitro capillary tube formation and cell proliferation of EA.hy926 cells under hypoxia, but stimulated the tube formation under normoxia.
Conclusions and implications: H(2) S suppresses HIF-1α translation by enhancing eIF2α phosphorylation under hypoxia. The interaction of H(2) S and HIF-1α inhibits the angiogenic activity of vascular endothelial cells under hypoxia through the down-regulation of VEGF.
© 2012 The Authors. British Journal of Pharmacology © 2012 The British Pharmacological Society.
Figures
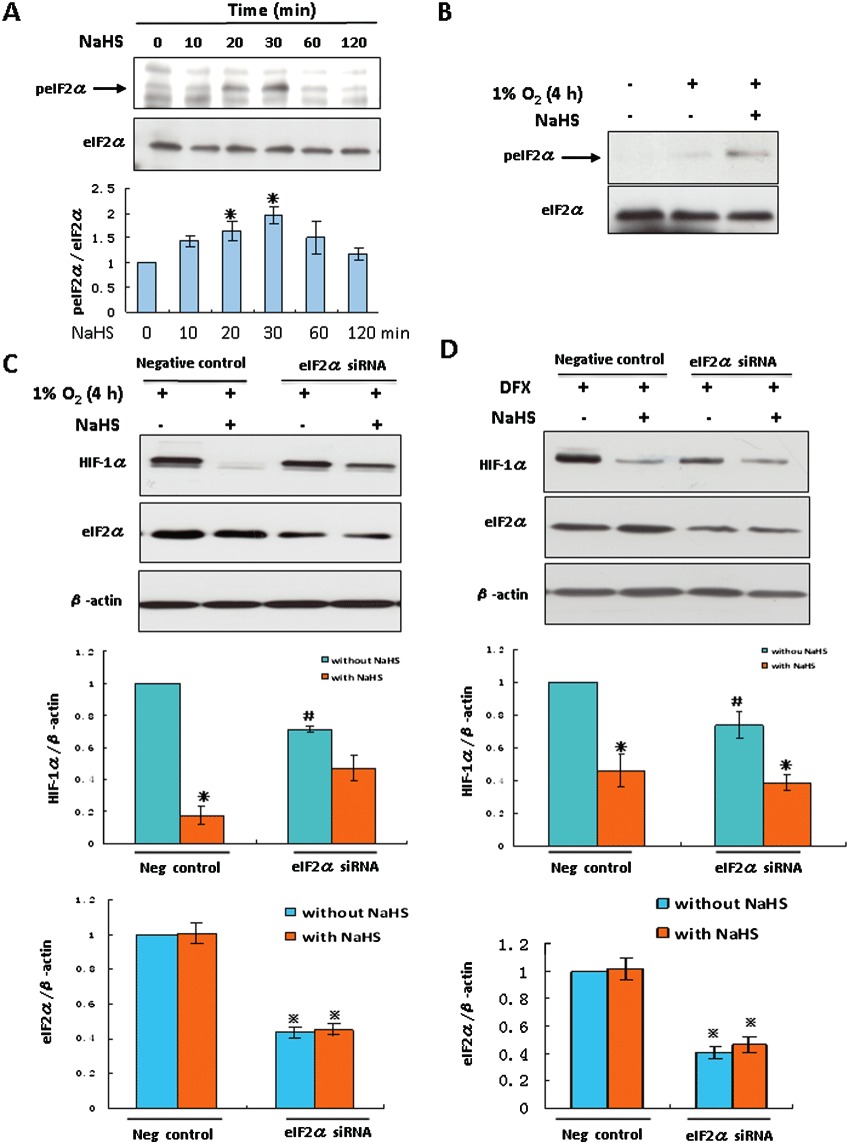
 P < 0.05 versus negative control group without NaHS.
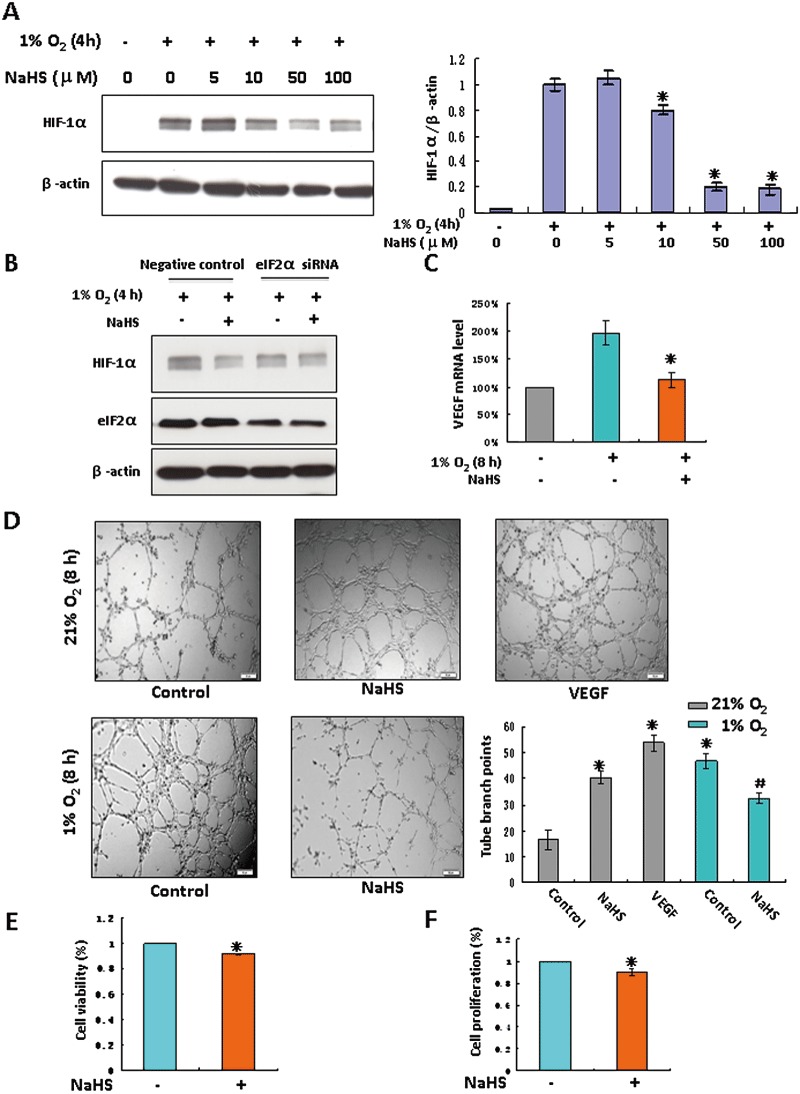
Similar articles
-
Hydrogen sulfide inhibits hypoxia- but not anoxia-induced hypoxia-inducible factor 1 activation in a von hippel-lindau- and mitochondria-dependent manner.Antioxid Redox Signal. 2012 Feb 1;16(3):203-16. doi: 10.1089/ars.2011.3882. Epub 2011 Oct 17. Antioxid Redox Signal. 2012. PMID: 22004513 Free PMC article.
-
Suppression of hypoxia-inducible factor 1α (HIF-1α) by tirapazamine is dependent on eIF2α phosphorylation rather than the mTORC1/4E-BP1 pathway.PLoS One. 2010 Nov 9;5(11):e13910. doi: 10.1371/journal.pone.0013910. PLoS One. 2010. PMID: 21085474 Free PMC article.
-
Rhapontigenin inhibited hypoxia inducible factor 1 alpha accumulation and angiogenesis in hypoxic PC-3 prostate cancer cells.Biol Pharm Bull. 2011;34(6):850-5. doi: 10.1248/bpb.34.850. Biol Pharm Bull. 2011. PMID: 21628883
-
Hypoxia augments NaHS-induced ANP secretion via KATP channel, HIF-1α and PPAR-γ pathway.Peptides. 2019 Nov;121:170123. doi: 10.1016/j.peptides.2019.170123. Epub 2019 Aug 3. Peptides. 2019. PMID: 31386893
-
HIF-1α: A potential therapeutic opportunity in renal fibrosis.Chem Biol Interact. 2024 Jan 5;387:110808. doi: 10.1016/j.cbi.2023.110808. Epub 2023 Nov 21. Chem Biol Interact. 2024. PMID: 37980973 Review.
Cited by
-
Cystathione β-synthase regulates HIF-1α stability through persulfidation of PHD2.Sci Adv. 2020 Jul 3;6(27):eaaz8534. doi: 10.1126/sciadv.aaz8534. Print 2020 Jul. Sci Adv. 2020. PMID: 32937467 Free PMC article.
-
Chemiluminescent Probes for Imaging H2S in Living Animals.Chem Sci. 2015 Mar;6(3):1979-1985. doi: 10.1039/C4SC03516J. Chem Sci. 2015. PMID: 25709805 Free PMC article.
-
Hypoxic conditions increases H₂S-induced ER stress in A2870 cells.Mol Cell Biochem. 2016 Mar;414(1-2):67-76. doi: 10.1007/s11010-016-2659-4. Epub 2016 Feb 11. Mol Cell Biochem. 2016. PMID: 26868821
-
Hydrogen sulfide dysregulates the immune response by suppressing central carbon metabolism to promote tuberculosis.Proc Natl Acad Sci U S A. 2020 Mar 24;117(12):6663-6674. doi: 10.1073/pnas.1919211117. Epub 2020 Mar 5. Proc Natl Acad Sci U S A. 2020. PMID: 32139610 Free PMC article.
-
Suppression of mitochondrial respiration with auraptene inhibits the progression of renal cell carcinoma: involvement of HIF-1α degradation.Oncotarget. 2015 Nov 10;6(35):38127-38. doi: 10.18632/oncotarget.5511. Oncotarget. 2015. PMID: 26474388 Free PMC article.
References
-
- Aranda E, Owen GI. A semi-quantitative assay to screen for angiogenic compounds and compounds with angiogenic potential using the EA.hy926 endothelial cell line. Biol Res. 2009;42:377–389. - PubMed
-
- Bauer J, Margolis M, Schreiner C, Edgell CJ, Azizkhan J, Lazarowski E, et al. In vitro model of angiogenesis using a human endothelium-derived permanent cell line: contributions of induced gene expression, G-proteins, and integrins. J Cell Physiol. 1992;153:437–449. - PubMed
-
- Bernardi R, Guernah I, Jin D, Grisendi S, Alimonti A, Teruya-Feldstein J, et al. PML inhibits HIF-1alpha translation and neoangiogenesis through repression of mTOR. Nature. 2006;442:779–785. - PubMed
Publication types
MeSH terms
Substances
LinkOut - more resources
Full Text Sources
Research Materials
