. 2012 Feb 23;1(2):155-66.
doi: 10.1016/j.celrep.2011.12.006. Epub 2012 Feb 9.

The mechanisms of repetitive spike generation in an axonless retinal interneuron

Affiliations

The mechanisms of repetitive spike generation in an axonless retinal interneuron

Mark S Cembrowski et al. Cell Rep. .

Abstract

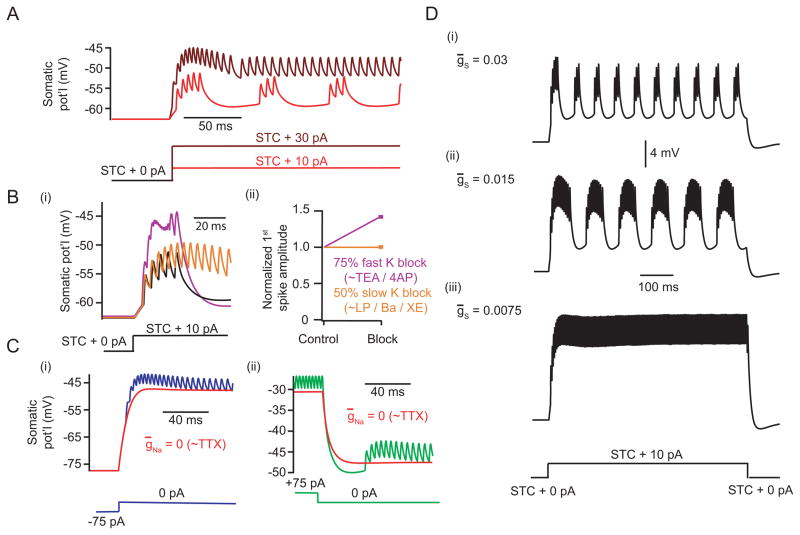
Several types of retinal interneurons exhibit spikes but lack axons. One such neuron is the AII amacrine cell, in which spikes recorded at the soma exhibit small amplitudes (<10 mV) and broad time courses (>5 ms). Here, we used electrophysiological recordings and computational analysis to examine the mechanisms underlying this atypical spiking. We found that somatic spikes likely represent large, brief action potential-like events initiated in a single, electrotonically distal dendritic compartment. In this same compartment, spiking undergoes slow modulation, likely by an M-type K conductance. The structural correlate of this compartment is a thin neurite that extends from the primary dendritic tree: local application of TTX to this neurite, or excision of it, eliminates spiking. Thus, the physiology of the axonless AII is much more complex than would be anticipated from morphological descriptions and somatic recordings; in particular, the AII possesses a single dendritic structure that controls its firing pattern.


Figures

Figure 1
Figure 1
Somatically-recorded spikes in the AII appear to reflect distal initiation. (A) Spontaneously-occurring spikes at rest exhibited small amplitudes and stereotyped waveforms. (ii) After hyperpolarization of the AII by STC, small current steps induced bursts of superposing spikes. Larger current steps elicited tonic firing. (iii) Expanded view of bursting and tonic spiking. (B) (i) TEA inhibited recovery and modestly increased the initial spike height. (ii) TEA and 4AP produced significant but small increases in spike height (TEA: 114 ± 4% relative to control; 4AP: 133 ± 14% relative to control; n=4 cells in each case; p < 0.05 in each case; error bars indicate SEM). (C) In voltage-clamp configuration, a suprathreshold step from −80mV to −50mV evoked regenerative, stereotyped inward events in AIIs from both wild-type (i) and gap junction knockout (ii) mice. In a wild-type AII, injecting a single inward event as depolarizing current in the presence of TTX evoked a waveform similar to a spike in control conditions (iii). Injecting a train of regenerative events in TTX elicited superposing spikes resembling a burst waveform (iv).
Figure 2
Figure 2
Slow modulation is bidirectional, exhibits one timescale, and is distal. (A) Repolarization in the AII is illustrated following either a +75 pA (blue) or −75 pA (green) current injection, for a single trial (i) and an average across trials (ii). Respectively, responses exhibited transient after-hyperpolarizations and after-depolarizations with similar time courses. (B) Responses over a longer time window did not show any further adaptation (averaged response depicted). (C) TTX (red) strongly reduced transient behavior following current offset in both protocols. Both an individual trial (i) and an averaged response (ii) are shown.
Figure 3
Figure 3
Results from pharmacological manipulations are consistent with modulation by an M-type K conductance. (A) LP increased spikes/burst in the AII. (B) Summary data from cells not exhibiting complete loss of burst mode (control vs. LP spikes/burst: 3.9 ± 1.1 vs. 15.3 ± 3.0; n=3; p < 0.05). (C) Example trace from an AII where bursting was abolished (n=4 total). (D) In the presence of TTX, an AII was ramped (i) from −75pA to +75pA over 2 s in control (black) and after LP was applied (red). Following current offset (ii), the small after-hyperpolarization was eliminated in the presence of LP. (E) Summary of input resistances, after partitioning the ramp response into 5 mV voltage intervals, in control and LP (see Experimental Procedures; p > 0.05 for voltages intervals below −55mV, and p < 0.05 otherwise; only 5/10 cells reached voltages of at least −40 mV in both control and LP and the [−45 mV, −40 mV] data point represents data from this subset of cells; n=10 for all other intervals). (F) Summary of the change in resting potential following the addition of LP (control: −45.2 ± 1.5 mV, LP: −39.2 ± 2.0 mV; n=10; p < 0.01). All error bars indicate SEM. See also Fig. S1.
Figure 4
Figure 4
A computational model captures properties of experimentally-observed spiking only when a single initiation site is present. (A) Experimentally-recorded action currents (i) and bursts (ii). (B) A model with a single initiation site (see Table S1) reproduced experimental behavior in both voltage- (i) and current-clamp (ii). (C) A model with two initiation sites produced simulated somatic recordings which were disorganized and inconsistent with experimental results. (D) A single dendritic spike was evoked by applying a 1 ms, 10 pA current pulse at the initiation site, which was otherwise kept from firing via STC injection at the soma. The voltages across the AII compartments are shown (i), as well as an expanded view of the somatic response relative to the initiation site response to illustrate the change in time course (ii).
Figure 5
Figure 5
The single initiation site model captures many features of AII behavior. (A) Somatic responses to small (10 pA) and large (30 pA) current steps following STC showed bursting and tonic firing, respectively. See also Fig. S2A–D. (B) Somatic voltage traces following K channel reduction, simulating the effects of TEA/4AP and LP/Ba/XE application. Results are shown for control (black), for a 75% reduction of fast A-type K density (purple, 143% initial spike height relative to control), and for a 50% reduction of slow K density (gold, 100% initial spike height relative to control). See also Fig. S2E–F. (C) Somatic voltages following large depolarizing (i) or hyperpolarizing (ii) current offsets are illustrated. After-hyperpolarizations and after-depolarizations were present and greatly reduced by eliminating Na channels from the model (red). (D) Reducing the density of slow K prolonged the burst mode in the model AII.
Figure 6
Figure 6
Direct experimental evidence for a single, distal initiation site. (A) TTX application to a visualized putative initiation site (i, scale bar = 5 μm; illustrated schematically in ii) reversibly suppressed spiking during a slow current ramp (iii). (iv) Summary of the reduction in normalized spike frequency following local application of TTX (see Experimental Procedures) (initiation site “IS”: 0.40±0.08, n=7; soma: 0.76±0.12, n=5; other: 0.80±0.10, n=3; branch: 0.83±0.11, n=5; arbor: 0.97±0.08, n=4; error bars indicate SEM). (B) Following excision of the putative initiation site (i), a ramped AII became quiescent. In a different AII (ii), a putatively non-spiking neurite was removed without eliminating firing. (iii) Summary of the normalized change in initial spike height following removal of non-spiking neurites (post-removal = 105 ± 8% of control, n=5; p > 0.05; error bars indicate SEM). See also Fig. S3. (C) (i) A confocal image of a transverse, in vitro slice preparation of the Fbxo32-GFP retina revealed GFP fluorescence confined largely to neurons with the distinct morphology of AIIs. Scale bar = 5 μm. (ii) In a transverse section of retina, a GFP-expressing AII (green) was labeled with antibodies against ankyrin-G (red) and Na channels (pan-Na; blue). The Na channels and ankyrin-G were co-localized in a single process that appeared to extend from the AII’s primary dendrite. Scale bar = 5 μm. (i ) In a retinal whole-mount, GFP-expressing AII somata and dendrites wereii visualized (green). GFP-positive processes that were clearly connected to AIIs (arrows) expressed ankyrin-G (red). Scale bar = 10 μm.
Figure 7
Figure 7
A morphologically-detailed model behaves similarly to the reduced three-compartment model and captures experimental responses. (A) A confocal image of an individual AII. A long, unbranched cable with a putative initiation site was present (arrow). (B) The morphologically-detailed model AII (see Table S2), with respective recording locations illustrated. (C) A single dendritic spike was evoked in the detailed AII by applying a 1 ms, 10 pA current pulse at the initiation site, which was otherwise kept from firing via STC injection at the soma (cf. Fig. 4D). The spike attenuated significantly as it propagated towards the primary dendrite. After reaching this neurite, however, voltage responses were similar at the soma, lobular appendages, and distal dendritic arbor (traces offset for clarity). (D) The detailed morphological model exhibited both burst and tonic firing.

References

    1. Adams PR, Brown DA, Constanti A. M-currents and other potassium currents in bullfrog sympathetic neurones. J Physiol. 1982a;330:537–572. - PMC - PubMed
    1. Adams PR, Brown DA, Constanti A. Pharmacological inhibition of the M-current. J Physiol. 1982b;332:223–262. - PMC - PubMed
    1. Aiken SP, Lampe BJ, Murphy PA, Brown BS. Reduction of spike frequency adaptation and blockade of M-current in rat CA1 pyramidal neurones by linopirdine (DuP 996), a neurotransmitter release enhancer. Br J Pharmacol. 1995;115:1163–1168. - PMC - PubMed
    1. Anderson JR, Jones BW, Watt CB, Shaw MV, Yang JH, Demill D, Lauritzen JS, Lin Y, Rapp KD, Mastronarde D, et al. Exploring the retinal connectome. Mol Vis. 2011;17:355–379. - PMC - PubMed
    1. Bloomfield SA, Volgyi B. Function and plasticity of homologous coupling between AII amacrine cells. Vision Res. 2004;44:3297–3306. - PubMed

Publication types

Substances

LinkOut - more resources