

Metabolic imaging using two-photon excited NADH intensity and fluorescence lifetime imaging
- PMID: 22832200
- PMCID: PMC3842212
- DOI: 10.1017/S1431927612000529
Metabolic imaging using two-photon excited NADH intensity and fluorescence lifetime imaging
Abstract
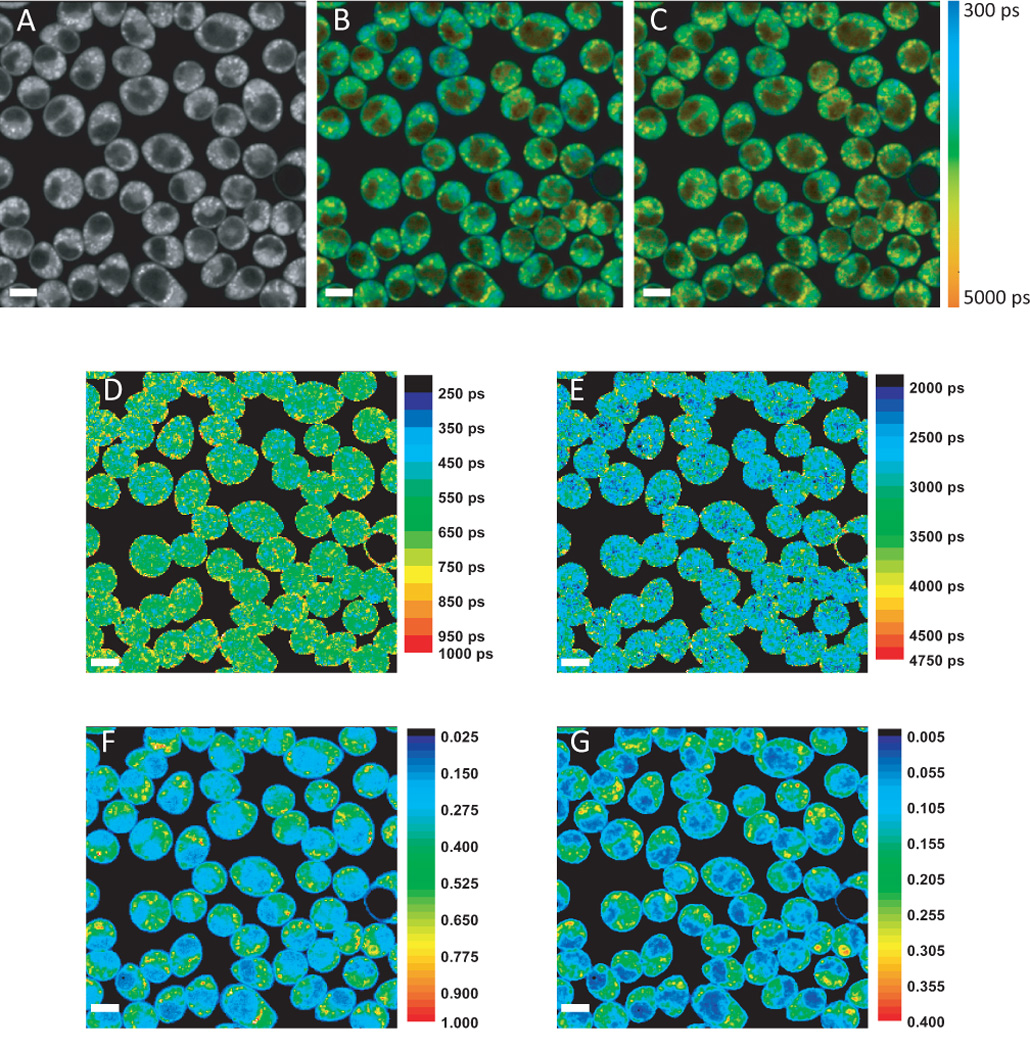
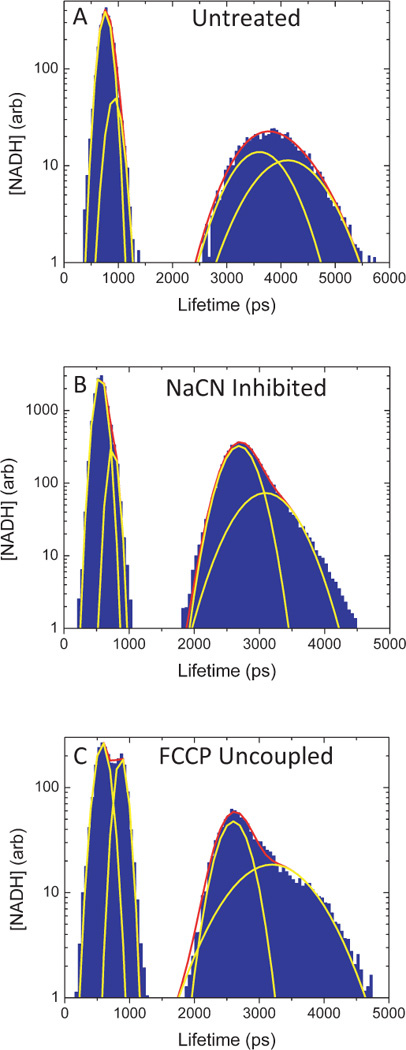
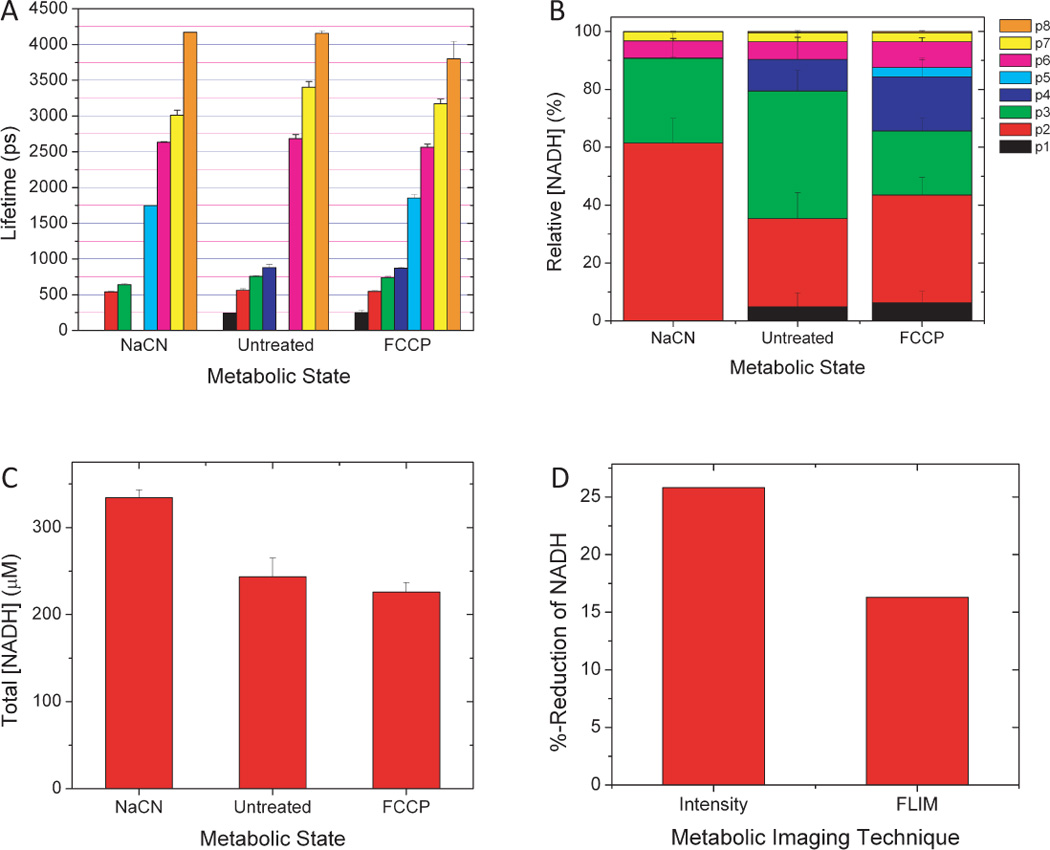
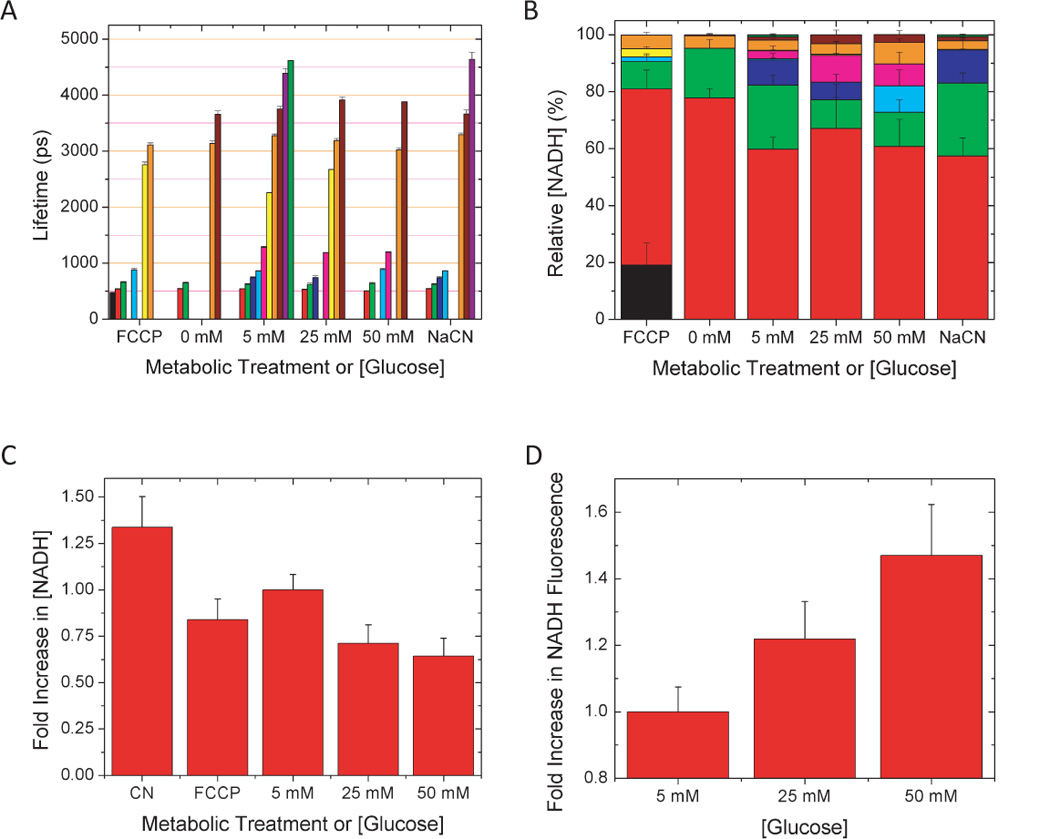
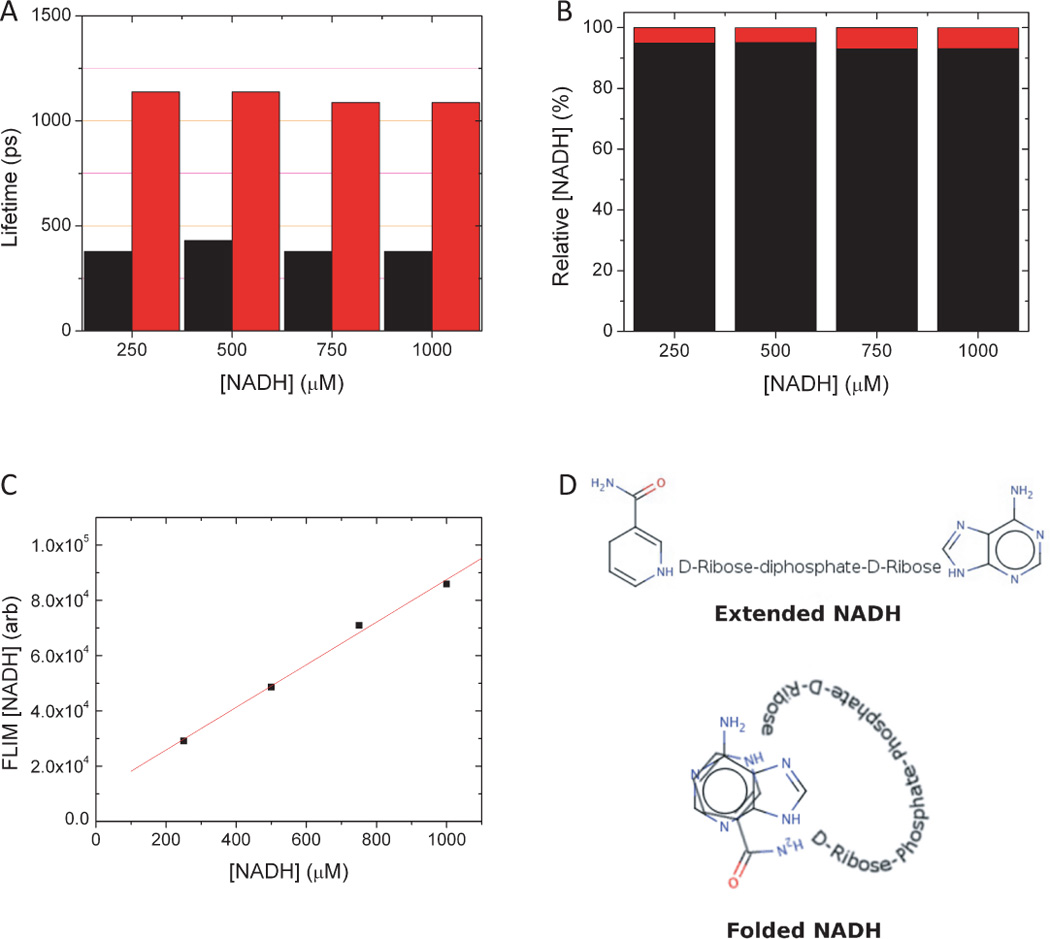
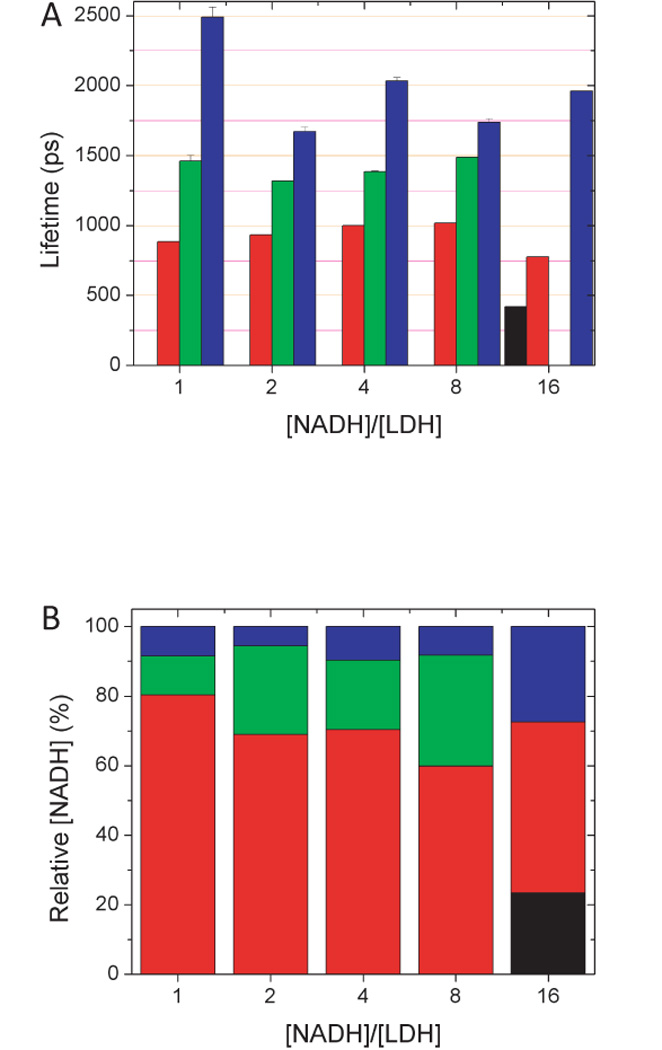
Metabolism and mitochondrial dysfunction are known to be involved in many different disease states. We have employed two-photon fluorescence imaging of intrinsic mitochondrial reduced nicotinamide adenine dinucleotide (NADH) to quantify the metabolic state of several cultured cell lines, multicell tumor spheroids, and the intact mouse organ of Corti. Historically, fluorescence intensity has commonly been used as an indicator of the NADH concentration in cells and tissues. More recently, fluorescence lifetime imaging has revealed that changes in metabolism produce not only changes in fluorescence intensity, but also significant changes in the lifetimes and concentrations of free and enzyme-bound pools of NADH. Since NADH binding changes with metabolic state, this approach presents a new opportunity to track the cellular metabolic state.
Figures
Similar articles
-
Two-photon autofluorescence dynamics imaging reveals sensitivity of intracellular NADH concentration and conformation to cell physiology at the single-cell level.J Photochem Photobiol B. 2009 Apr 2;95(1):46-57. doi: 10.1016/j.jphotobiol.2008.12.010. Epub 2008 Dec 25. J Photochem Photobiol B. 2009. PMID: 19179090 Free PMC article.
-
Two-Photon Microscopy (TPM) and Fluorescence Lifetime Imaging Microscopy (FLIM) of Retinal Pigment Epithelium (RPE) of Mice In Vivo.Methods Mol Biol. 2018;1753:73-88. doi: 10.1007/978-1-4939-7720-8_5. Methods Mol Biol. 2018. PMID: 29564782
-
Metabolic mapping of glioblastoma stem cells reveals NADH fluxes associated with glioblastoma phenotype and survival.J Biomed Opt. 2020 Mar;25(3):1-13. doi: 10.1117/1.JBO.25.3.036502. J Biomed Opt. 2020. PMID: 32216192 Free PMC article.
-
Label-Free Optical Metabolic Imaging in Cells and Tissues.Annu Rev Biomed Eng. 2023 Jun 8;25:413-443. doi: 10.1146/annurev-bioeng-071516-044730. Epub 2023 Apr 27. Annu Rev Biomed Eng. 2023. PMID: 37104650 Free PMC article. Review.
-
Reduced nicotinamide adenine dinucleotide (NADH) fluorescence for the detection of cell death.Anticancer Agents Med Chem. 2009 Nov;9(9):1012-7. doi: 10.2174/187152009789377718. Anticancer Agents Med Chem. 2009. PMID: 19663784 Review.
Cited by
-
Determination of the metabolic index using the fluorescence lifetime of free and bound nicotinamide adenine dinucleotide using the phasor approach.J Biophotonics. 2019 Nov;12(11):e201900156. doi: 10.1002/jbio.201900156. Epub 2019 Jul 29. J Biophotonics. 2019. PMID: 31194290 Free PMC article.
-
Enhanced quantification of metabolic activity for individual adipocytes by label-free FLIM.Sci Rep. 2018 Jun 8;8(1):8757. doi: 10.1038/s41598-018-27093-x. Sci Rep. 2018. PMID: 29884881 Free PMC article.
-
Microglial metabolic flexibility supports immune surveillance of the brain parenchyma.Nat Commun. 2020 Mar 25;11(1):1559. doi: 10.1038/s41467-020-15267-z. Nat Commun. 2020. PMID: 32214088 Free PMC article.
-
Label-free fluorescence lifetime spectroscopy detects radiation-induced necrotic changes in live brain in real-time.Biomed Opt Express. 2018 Jul 5;9(8):3559-3580. doi: 10.1364/BOE.9.003559. eCollection 2018 Aug 1. Biomed Opt Express. 2018. PMID: 30338140 Free PMC article.
-
Bioluminescent cell-based NAD(P)/NAD(P)H assays for rapid dinucleotide measurement and inhibitor screening.Assay Drug Dev Technol. 2014 Nov-Dec;12(9-10):514-26. doi: 10.1089/adt.2014.605. Assay Drug Dev Technol. 2014. PMID: 25506801 Free PMC article.
References
-
- Agronskaia AV, Tertoolen L, Gerritsen HC. Fast fluorescence lifetime imaging of calcium in living cells. J Biomed Opt. 2004;9:1230–1237. - PubMed
-
- An J, Camara AK, Rhodes SS, Riess ML, Stowe DF. Warm ischemic preconditioning improves mitochondrial redox balance during and after mild hypothermic ischemia in guinea pig isolated hearts. Am J Physiol Heart Circ Physiol. 2005;288:H2620–H2627. - PubMed
-
- Bevington PR, Robinson DK. Data reduction and error analysis for the physical sciences. New York: McGraw-Hill; 2002.
-
- Bird DK, Yan L, Vrotsos KM, Eliceiri KW, Vaughan EM, Keely PJ, White JG, Ramanujam N. Metabolic mapping of MCF10A human breast cells via multiphoton fluorescence lifetime imaging of the coenzyme NADH. Cancer Res. 2005;65:8766–8773. - PubMed
-
- Blinova K, Combs C, Kellman P, Balaban RS. Fluctuation analysis of mitochondrial NADH fluorescence signals in confocal and two-photon microscopy images of living cardiac myocytes. J Microsc. 2004;213:70–75. - PubMed
