

Observational study of caloric and nutrient intake, bone density, and body composition in infants and children with spinal muscular atrophy type I
- PMID: 22832342
- PMCID: PMC3484247
- DOI: 10.1016/j.nmd.2012.04.008
Observational study of caloric and nutrient intake, bone density, and body composition in infants and children with spinal muscular atrophy type I
Abstract
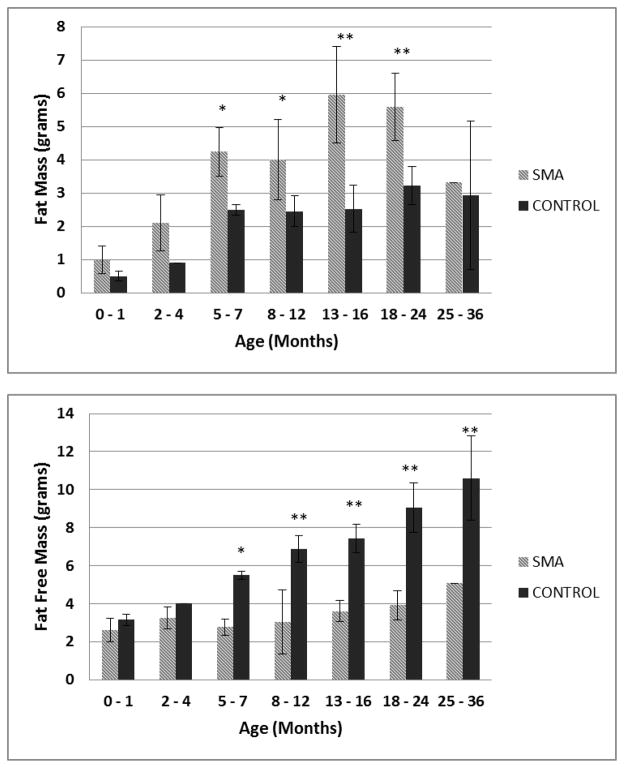
Clinical experience supports a critical role for nutrition in patients with spinal muscular atrophy (SMA). Three-day dietary intake records were analyzed for 156 visits in 47 SMA type I patients, 25 males and 22 females, ages 1month to 13years (median 9.8months) and compared to dietary reference intakes for gender and age along with anthropometric measures and dual-energy X-ray absorptiometry (DEXA) data. Using standardized growth curves, twelve patients met criteria for failure to thrive (FTT) with weight for age <3rd percentile; eight met criteria based on weight for height. Percentage of body fat mass was not correlated with weight for height and weight for age across percentile categories. DEXA analysis further demonstrated that SMA type I children have higher fat mass and lower fat free mass than healthy peers (p<0.001). DEXA and dietary analysis indicates a strong correlation with magnesium intake and bone mineral density (r=0.65, p<0.001). Average caloric intake for 1-3years old was 68.8±15.8kcal/kg - 67% of peers' recommended intake. Children with SMA type I may have lower caloric requirements than healthy age-matched peers, increasing risk for over and undernourished states and deficiencies of critical nutrients. Standardized growth charts may overestimate FTT status in SMA type I.
Copyright © 2012 Elsevier B.V. All rights reserved.
Conflict of interest statement
The authors have no known conflicts of interest.
Figures
References
-
- Tsirikos AI, Baker ADL. Spinal Muscular Atrophy: Classification, aetology, and treatment of spinal deformity in children and adolescents. Current Orthopaedics. 2006;20:430–445.
-
- Zerres K, Rudnik-Schoneborn S. Natural history in proximal spinal muscular atrophy. Clinical analysis of 445 patients and suggestions for a modification of existing classifications. Arch Neurol. 1995;52(5):518–523. - PubMed
-
- Lefebvre S, Burglen L, Reboullet S, et al. Identification and characterization of a spinal muscular atrophy-determining gene. Cell. 1995;80(1):155–165. - PubMed
-
- Pearn J. Classification of spinal muscular atrophies. Lancet. 1980;1(8174):919–922. - PubMed
Publication types
MeSH terms
Grants and funding
LinkOut - more resources
Full Text Sources
Medical
Miscellaneous
