

Sweet-bitter and umami-bitter taste interactions in single parabrachial neurons in C57BL/6J mice
- PMID: 22832571
- PMCID: PMC3545017
- DOI: 10.1152/jn.00465.2012
Sweet-bitter and umami-bitter taste interactions in single parabrachial neurons in C57BL/6J mice
Abstract
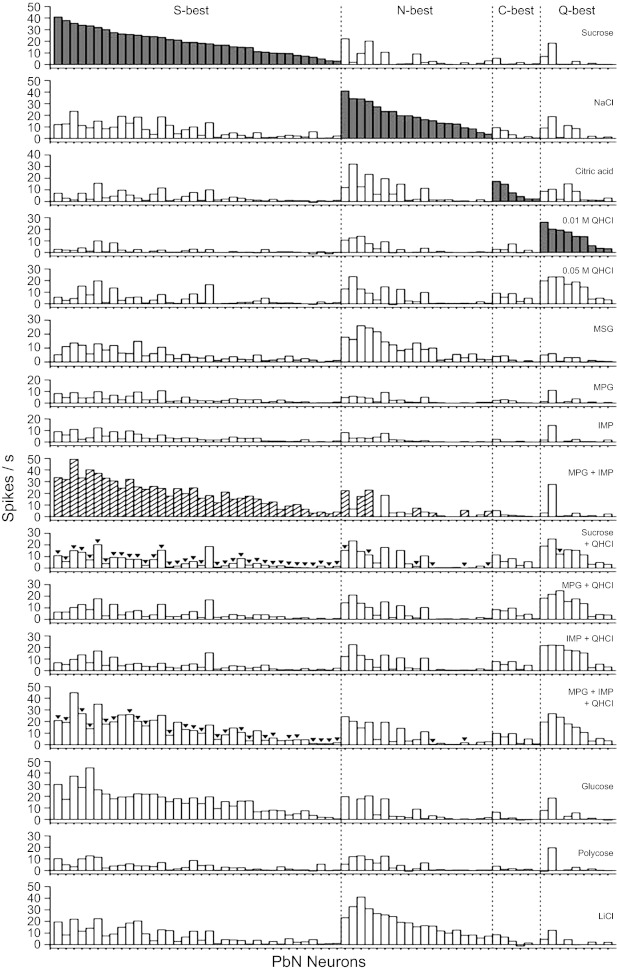
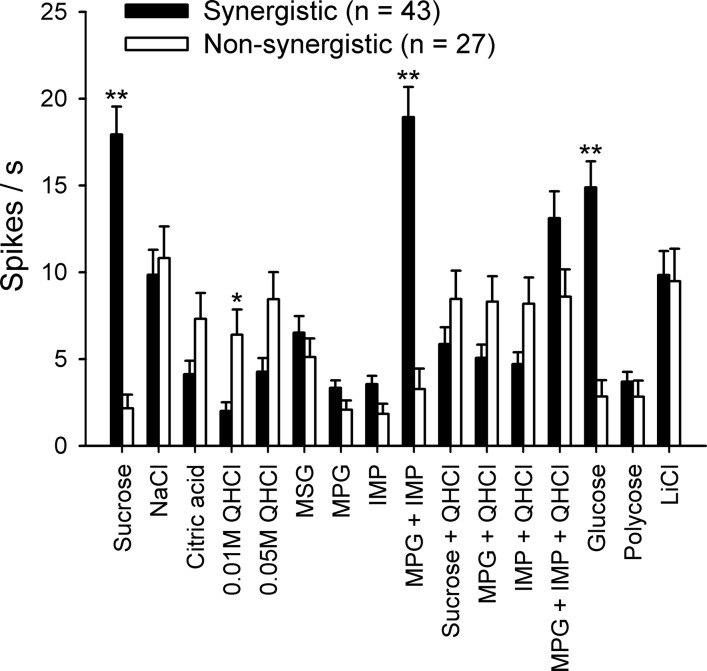
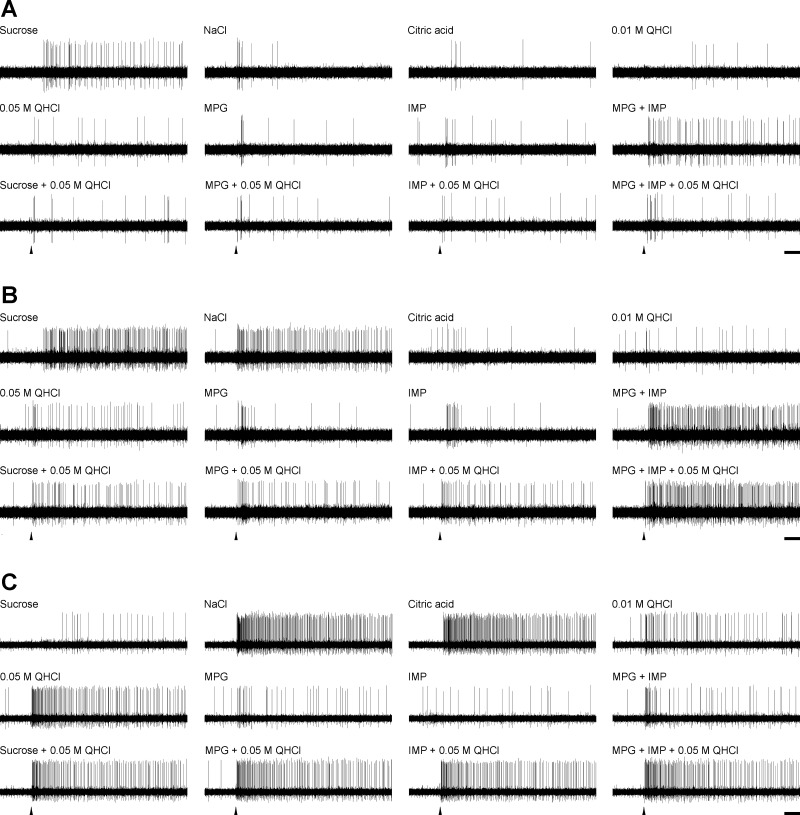
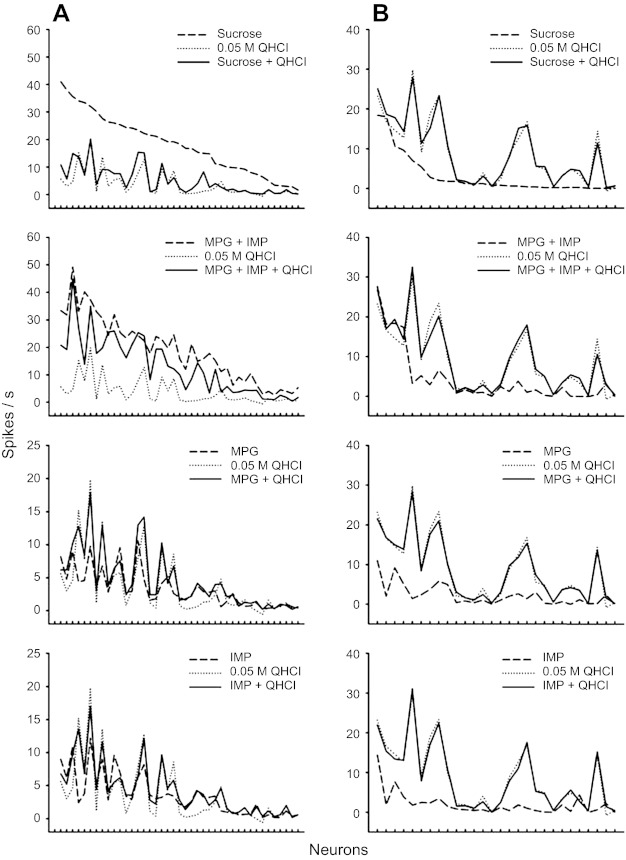
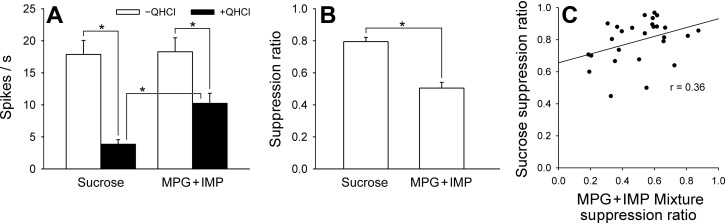
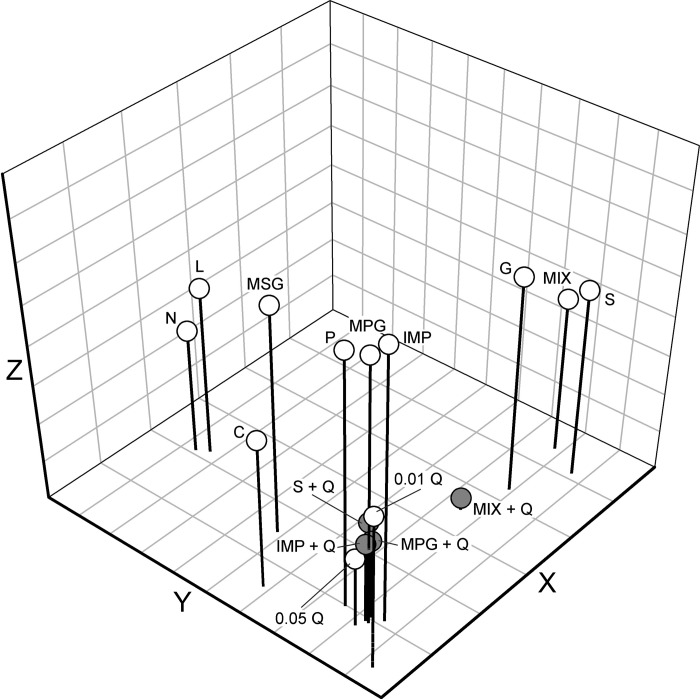
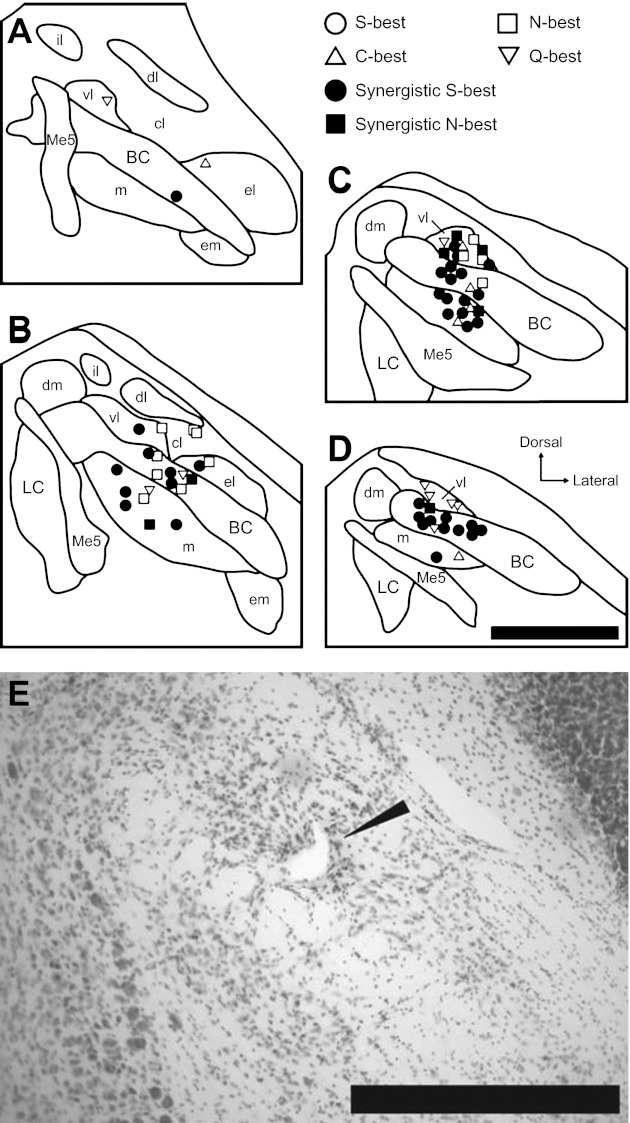
We investigated sweet-bitter and umami-bitter mixture taste interactions by presenting sucrose or umami stimuli mixed with quinine hydrochloride (QHCl) while recording single-unit activity of neurons in the parabrachial nucleus (PbN) of urethane-anesthetized C57BL/6J mice. A total of 70 taste-responsive neurons were classified according to which stimulus evoked the greatest net response (36 sucrose-best, 19 NaCl-best, 6 citric acid-best, and 9 QHCl-best). Although no neurons responded best to monopotassium glutamate (MPG) or inosine 5'-monophosphate (IMP), the combination of these two stimuli evoked a synergistic response (i.e., response > 120% of the sum of the component responses) in all sucrose-best and some NaCl-best neurons (n = 43). Adding QHCl to sucrose or MPG + IMP resulted in suppression of the response (responses to mixture < responses to the more effective component) in 41 of 43 synergistic neurons. Neurons showing QHCl suppression were classified into two types: an "MS1" type (n = 27) with suppressed responses both to sucrose and MPG + IMP and an "MS2" type (n = 14) that showed suppressed responses only to sucrose. No neuron displayed suppressed responses to MPG or IMP alone. The suppression ratio (1 - mixture response/sucrose or MPG + IMP response) of sucrose and MPG + IMP in MS1 neurons had a weak positive correlation (r = 0.36). The pattern of reconstructed recording sites of neuron types suggested chemotopic organization in the PbN. Although a peripheral basis for QHCl suppression has been demonstrated, our results suggest that convergence in the PbN plays a role in shaping responses to taste mixtures.
Figures

Similar articles
-
Gustatory neural responses to umami stimuli in the parabrachial nucleus of C57BL/6J mice.J Neurophysiol. 2012 Mar;107(6):1545-55. doi: 10.1152/jn.00799.2011. Epub 2011 Dec 14. J Neurophysiol. 2012. PMID: 22170968 Free PMC article.
-
Topographic organizations of taste-responsive neurons in the parabrachial nucleus of C57BL/6J mice: An electrophysiological mapping study.Neuroscience. 2016 Mar 1;316:151-66. doi: 10.1016/j.neuroscience.2015.12.030. Epub 2015 Dec 19. Neuroscience. 2016. PMID: 26708748 Free PMC article.
-
Responses of single hamster parabrachial neurons to binary taste mixtures: mutual suppression between sucrose and QHCl.J Neurophysiol. 1993 Mar;69(3):658-68. doi: 10.1152/jn.1993.69.3.658. J Neurophysiol. 1993. PMID: 8385188
-
The neurophysiology of taste and olfaction in primates, and umami flavor.Ann N Y Acad Sci. 1998 Nov 30;855:426-37. doi: 10.1111/j.1749-6632.1998.tb10602.x. Ann N Y Acad Sci. 1998. PMID: 9929636 Review.
-
The representation of umami taste in the taste cortex.J Nutr. 2000 Apr;130(4S Suppl):960S-5S. doi: 10.1093/jn/130.4.960S. J Nutr. 2000. PMID: 10736361 Review.
Cited by
-
Gustatory and olfactory-guided responsiveness to maltodextrin solutions in mice.Am J Physiol Regul Integr Comp Physiol. 2025 Jul 1;329(1):R55-R69. doi: 10.1152/ajpregu.00275.2024. Epub 2025 May 17. Am J Physiol Regul Integr Comp Physiol. 2025. PMID: 40380809 Free PMC article.
-
Mice perceive synergistic umami mixtures as tasting sweet.Chem Senses. 2015 Jun;40(5):295-303. doi: 10.1093/chemse/bjv010. Epub 2015 Mar 28. Chem Senses. 2015. PMID: 25820205 Free PMC article.
-
Electrophysiological responses to sugars and amino acids in the nucleus of the solitary tract of type 1 taste receptor double-knockout mice.J Neurophysiol. 2020 Feb 1;123(2):843-859. doi: 10.1152/jn.00584.2019. Epub 2020 Jan 8. J Neurophysiol. 2020. PMID: 31913749 Free PMC article.
-
TRPV1-Lineage Somatosensory Fibers Communicate with Taste Neurons in the Mouse Parabrachial Nucleus.J Neurosci. 2022 Mar 2;42(9):1719-1737. doi: 10.1523/JNEUROSCI.0927-21.2021. Epub 2022 Jan 13. J Neurosci. 2022. PMID: 35027408 Free PMC article.
-
Parabrachial calcitonin gene-related peptide neurons mediate conditioned taste aversion.J Neurosci. 2015 Mar 18;35(11):4582-6. doi: 10.1523/JNEUROSCI.3729-14.2015. J Neurosci. 2015. PMID: 25788675 Free PMC article.
References
-
- Adachi A, Aoyama M. Neuronal responses of the nucleus tractus solitarius to oral stimulation with umami substances. Physiol Behav 49: 935–941, 1991 - PubMed
-
- Boughter JD, Jr, Smith DV. Amiloride blocks acid responses in NaCl-best gustatory neurons of the hamster solitary nucleus. J Neurophysiol 80: 1362–1372, 1998 - PubMed
-
- Bradley RM, Mistretta CM. Developmental changes in neurophysiological taste responses from the medulla in sheep. Brain Res 191: 21–34, 1980 - PubMed
-
- Chaudhari N, Landin AM, Roper SD. A metabotropic glutamate receptor variant functions as a taste receptor. Nat Neurosci 3: 113–119, 2000 - PubMed
Publication types
MeSH terms
Substances
Grants and funding
LinkOut - more resources
Full Text Sources