. 2012 Jul;3(7):670-7.
doi: 10.18632/oncotarget.523.

Circulating tumor-derived mutant mitochondrial DNA: a predictive biomarker of clinical prognosis in human squamous cell carcinoma

Affiliations

Circulating tumor-derived mutant mitochondrial DNA: a predictive biomarker of clinical prognosis in human squamous cell carcinoma

Katsuhiro Uzawa et al. Oncotarget. 2012 Jul.

Abstract

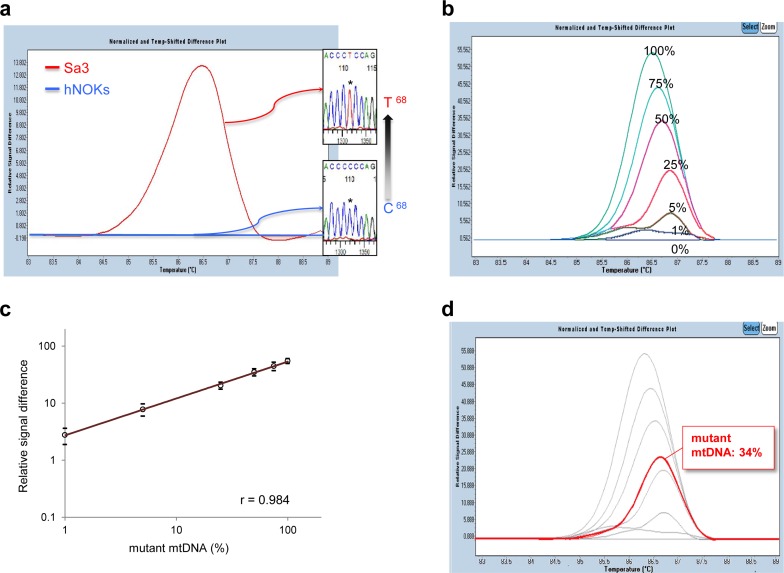
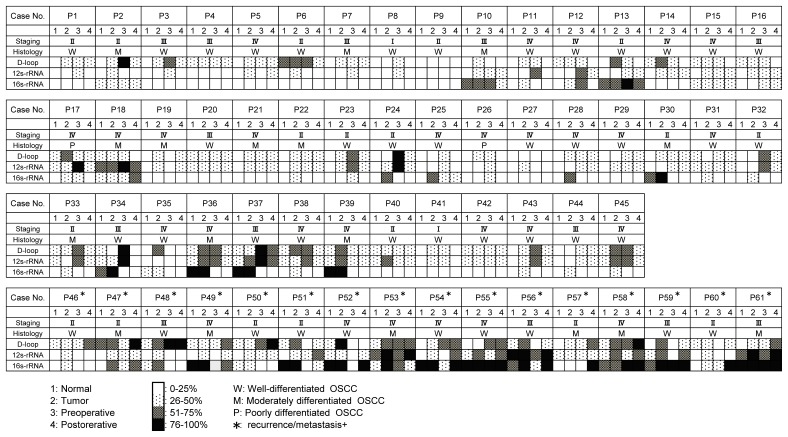
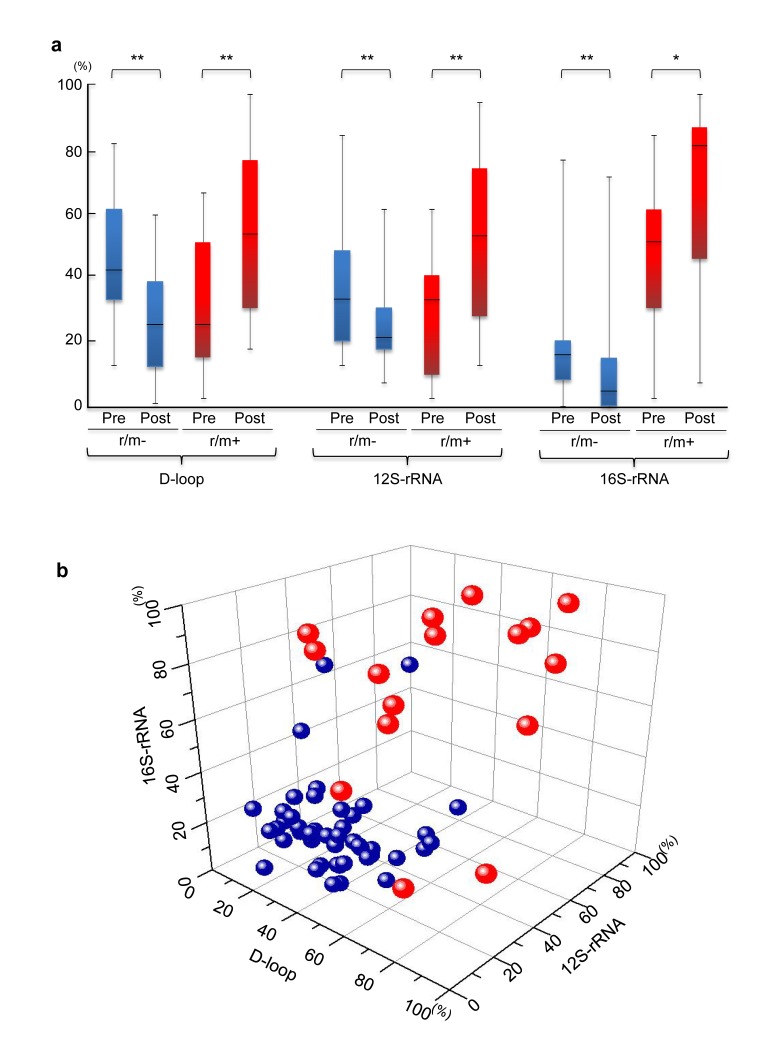
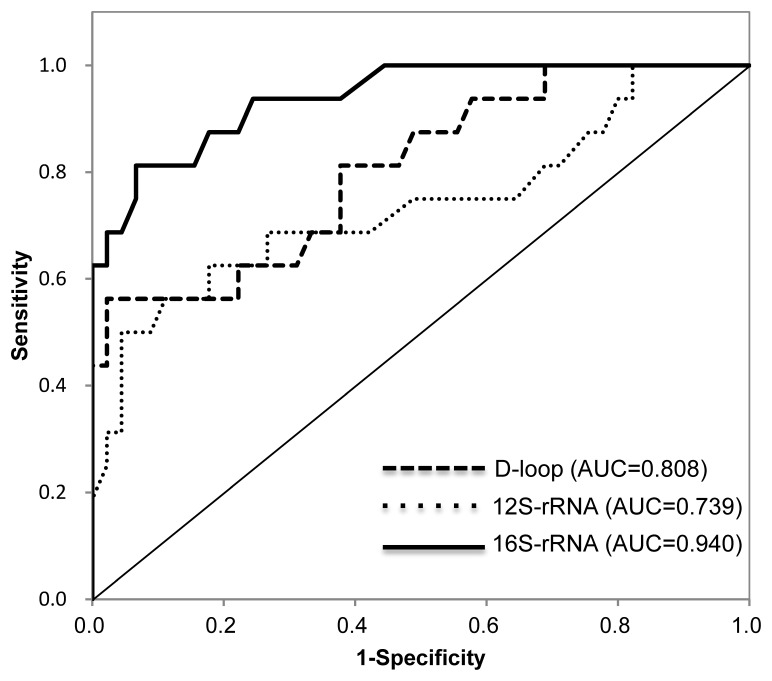
While circulating tumor-derived molecules have been identified in a variety of malignant tumors, it is sometimes difficult to detect the molecular targets due to the lower serum concentration. We report that evaluation of circulating tumor-derived mitochondrial DNA (mtDNA) seems to have novel efficiency for detecting tumoral micrometastasis. In murine xenografting human oral cancer cells, human mtDNAs could be quantitatively detected from multiple organs and blood samples whereas human nucleic DNAs could not. We also determined if this mtDNA blood test was relevant for patients with oral cancer with no histologic evidence of tumoral cells in their surgical margins. For this, mtDNA from normal and tumorous tissues and serum mtDNA obtained pre and postoperatively was examined at three different regions including the displacement loop, 12S-rRNA, and 16S-rRNA. All non-recurring patients had significantly higher amounts of mutant mtDNAs in the tumoral tissues compared with the non-recurring group. More importantly, on the blood test with the cut-off point by receiver operating characteristic (ROC) curve analysis, while the vast majority of serum mtDNA samples obtained postoperatively in the recurring cases maintained significantly higher amounts of mutant mtDNAs, the non-recurring cases did not, and they showed good prognosis. This is the first report of this approach for managing patients after resection of oral tumors, and may have substantial diagnostic potential for other tumoral types.


Conflict of interest statement

The authors declare no conflict of interest.

Figures

Figure 1
Figure 1. Mutational analyses of human mtDNA including the regions of the D-loop, 12S-rRNA, and 16S-rRNA in human OSCC-derived cells, Sa3 and HSC-4
(A) A typical qPCR-HRMA result followed by DNA sequence analysis of Sa3 cells clearly shows a distinguishable peak (red line) as a result of C68T in the D-loop region. Primary cultured hNOKs, indicating the baseline level (blue line) in the qPCR-HRMA panel, were obtained from healthy donors and used as a normal control. (B) A representative result of the standard curve for the D-loop region in the mtDNA genome. The standard curves were created by diluting mutated mtDNAs (D-loop-C68T) with wild-type mtDNAs to prepare 100%, 75%, 50%, 25%, 5%, 1%, and 0% mutated samples for detecting the D-loop region in the mtDNA genome. (C) A plotted standard curve for the D-loop region. The levels of the relative signal differences obtained by the qPCR-HRMA (y-axis) are reported as percentages of the mutant mtDNA. The coefficient of correlation (r = 0.984) is high. (D) Determination of the mutant mtDNA level in the serum from a Sa3-xenografted mouse (mouse 1). The fluorescence of the serum sample (red line) normalized as a differential signal against each standard curve in light grey, enabling detection of 34% mutant mtDNA in the D-loop region.
Figure 2
Figure 2. Status of mutant mtDNA from 61 patients with OSCC with surgical malignancy-free margins
Note that all patients with a good prognosis, except for three patients 13, 18, and 37, had less than 50% of mutant mtDNA in their sera postoperatively. In contrast, all r/m+ patients with no exceptions had more than 50% of mutant mtDNA in at least one region examined. P = patient.
Figure 3
Figure 3. (A) The status of mutant mtDNA levels in patients with OSCC with (red boxes) or without (blue boxes) r/m preoperatively or postoperatively
The r/m− groups have significantly decreased mutant mtDNAs postoperatively compared to preoperatively, whereas significantly increasing mutant mtDNA levels were detected at all regions in sera obtained postoperatively from r/m+ patients. The statistical significance of the data was determined using the Mann-Whitney U test. P<0.05 was considered significant. *P<0.05; **<0.01. The data are expressed as the mean ± standard error of the mean. The horizontal lines indicate the medians. All experiments were performed in triplicate. (B) To more clearly illustrate the specificity of the status of mutant mtDNA levels in the three different regions, we used Origin 8.6 software (OriginLab Co., Northampton, MA, USA) to create a three-dimensional scatterplot with an x-axis indicating the levels in the D-loop, a y-axis for the 12S-rRNA, and a z-axis for the 16S-rRNA, respectively. Data point sets from 61 patients with OSCC are plotted as circles. Most of the r/m− patients (blue) are very close (below 50%) on the X (D-loop)-Y (12S-rRNA)-Z (16S-rRNA) plane; the r/m+ group tends to indicate higher (>50%) amounts of mutant mtDNA.
Figure 4
Figure 4. ROC curves and AUC for the D-loop, 12S-rRNA, and 16S-rRNA
To evaluate the diagnostic relevance for predicting the r/m of serum mutant mtDNAs, we used the ROC curve by plotting sensitivity versus specificity. The AUCs for mutant mtDNAs are 0.808 for the D-loop, 0.739 for the 12S-rRNA, and 0.940 for the 16S-rRNA, indicating that the diagnostic potential of the level of serum mutant mtDNA 4 weeks after surgery is confirmed as indicated by the AUC values for the different regions examined. The thinner solid line indicates the diagonal representing a hypothetical test with no diagnostic discrimination. The statistical significance of the study data was determined using the Mann-Whitney U test. P<0.05 was considered significant. Data are expressed as the mean ± standard error of the mean. Statistical analyses were performed using SPSS 17.0 software (SPSS Inc., Chicago, IL, USA).

Comment in

References

    1. He J, Wu J, Jiao Y, Wagner-Johnston N, Ambinder RF, Diaz LA, Jr, Kinzler KW, Vogelstein B, Papadopoulos N. IgH gene rearrangements as plasma biomarkers in Non- Hodgkin's lymphoma patients. Oncotarget. 2011;2:178–185. - PMC - PubMed
    1. Faltas B. Circulating tumor cells in the cerebrospinal fluid: “tapping” into diagnostic and predictive potential. Oncotarget. 2011;2:822. - PMC - PubMed
    1. Patel AS, Allen JE, Dicker DT, Peters KL, Sheehan JM, Glantz MJ, El-Deiry WS. Identification and enumeration of circulating tumor cells in the cerebrospinalfluid of breast cancer patients with central nervous system metastases. Oncotarget. 2011;2:752–760. - PMC - PubMed
    1. Silva JM, Silva J, Sanchez A, Garcia JM, Dominguez G, Provencio M, Sanfrutos L, Jareño E, Colas A, España P, Bonilla F. Tumor DNA in plasma at diagnosis of breast cancer patients is a valuable predictor of disease-free survival. Clin Cancer Res. 2002;8:3761–3766. - PubMed
    1. Koyanagi K, Mori T, O'Day SJ, Martinez SR, Wang HJ, Hoon DS. Association of circulating tumor cells with serum tumor-related methylated DNA in peripheral blood of melanoma patients. Cancer Res. 2006;66:6111–6117. - PMC - PubMed