. 2012 Aug 1;11(15):2931-46.
doi: 10.4161/cc.21396. Epub 2012 Aug 1.

Analysis of centrosome localization of BRCA1 and its activity in suppressing centrosomal aster formation

Affiliations

Analysis of centrosome localization of BRCA1 and its activity in suppressing centrosomal aster formation

Pheruza Tarapore et al. Cell Cycle. .

Abstract

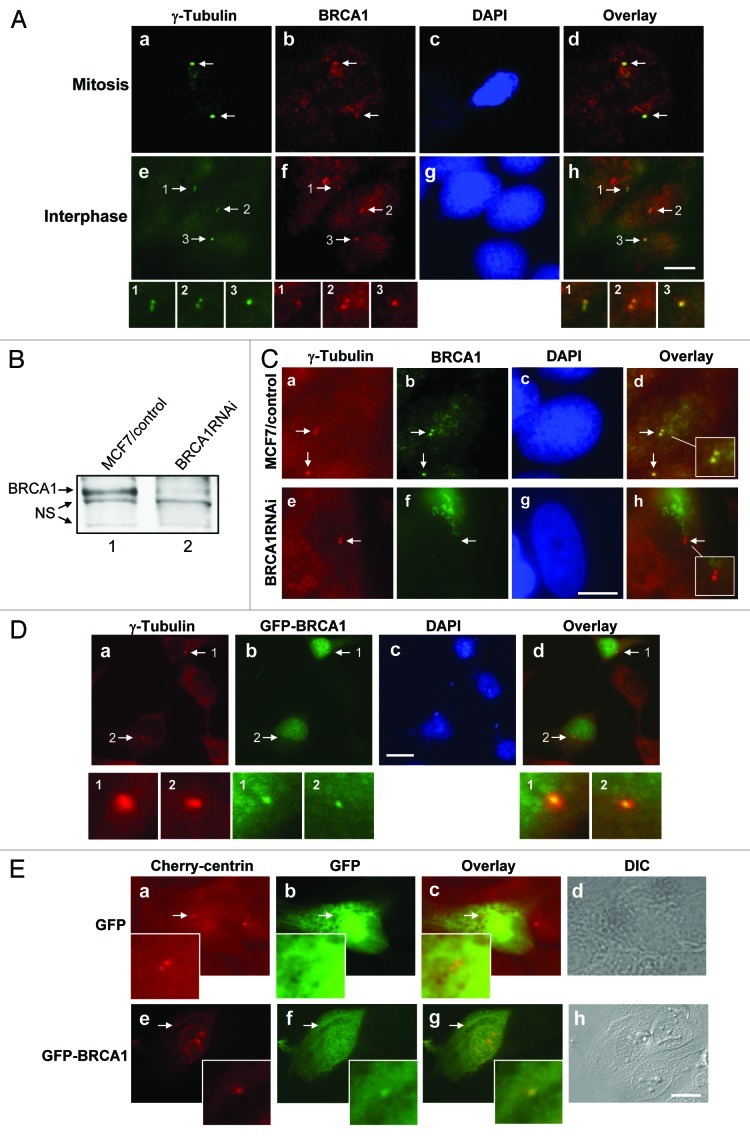
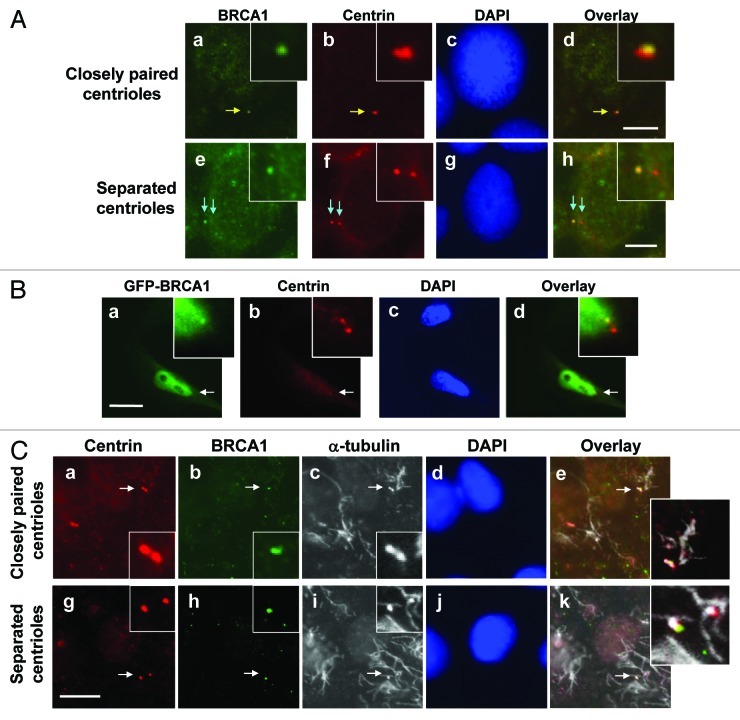
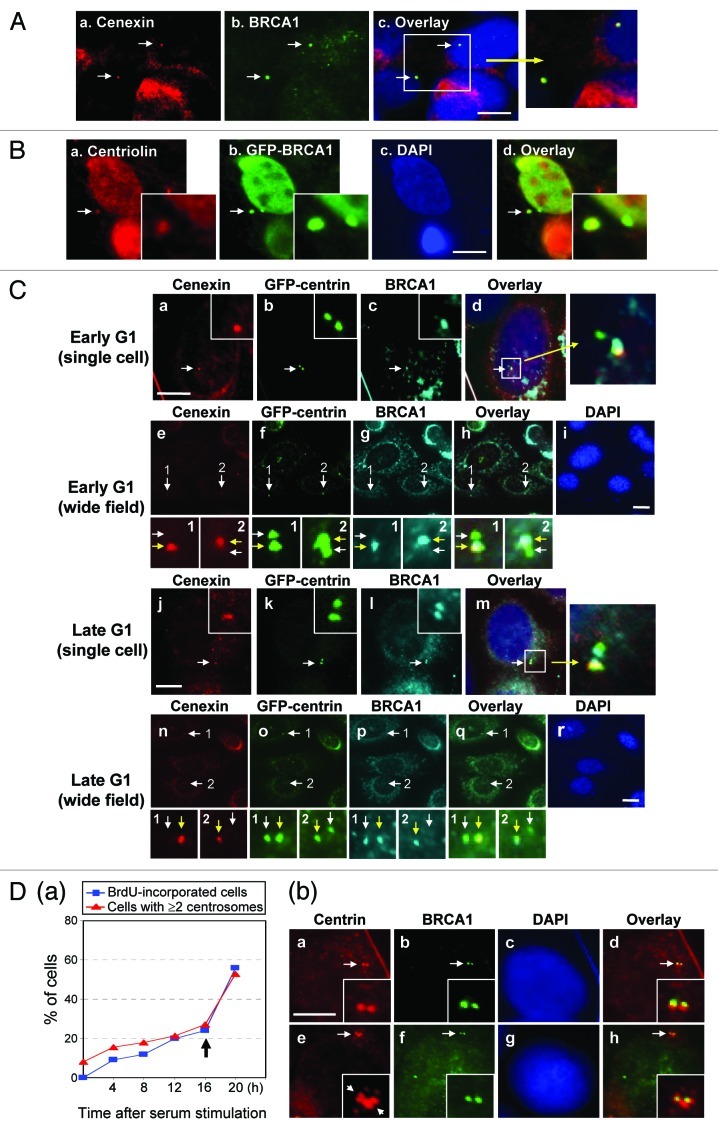
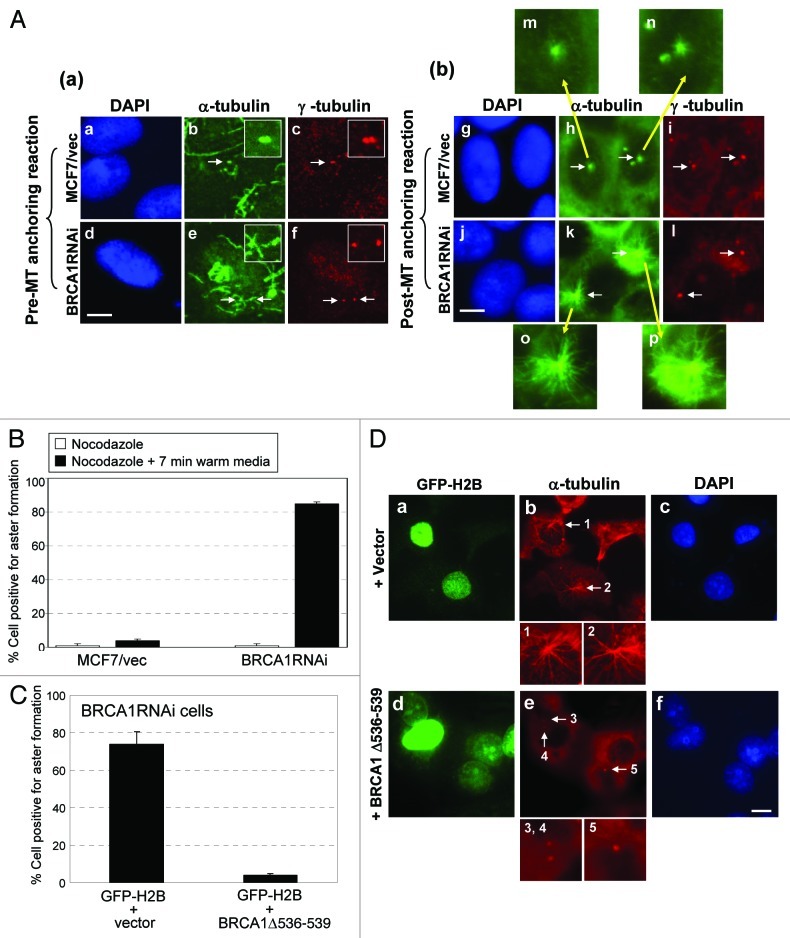
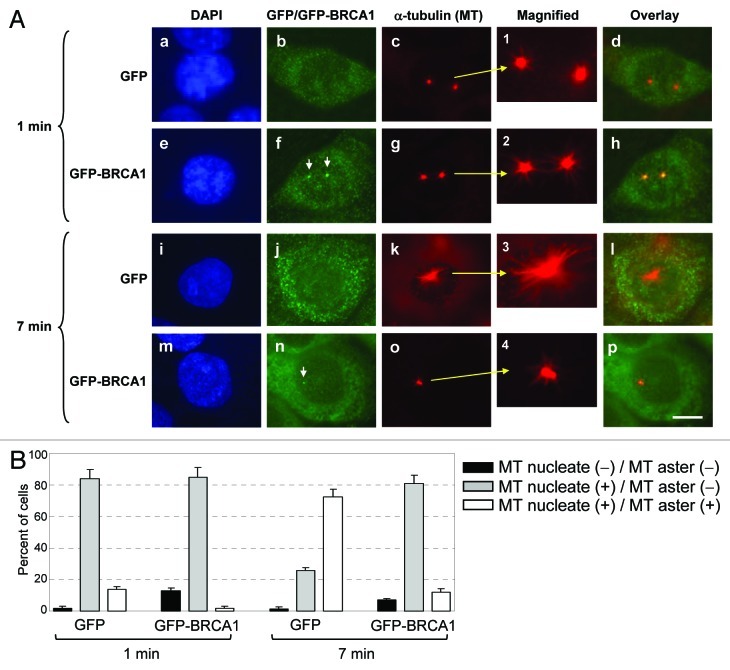
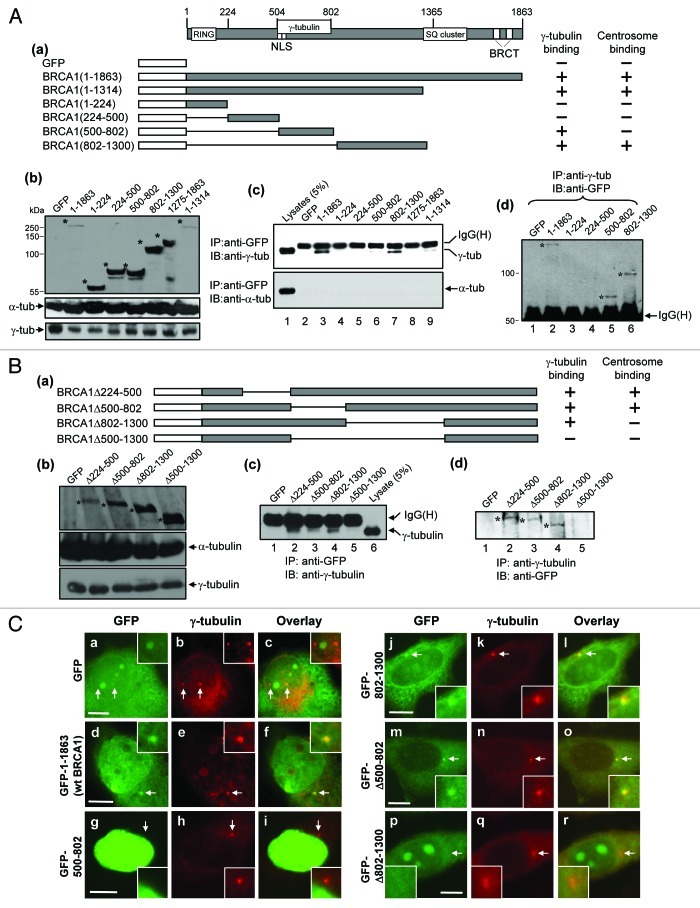
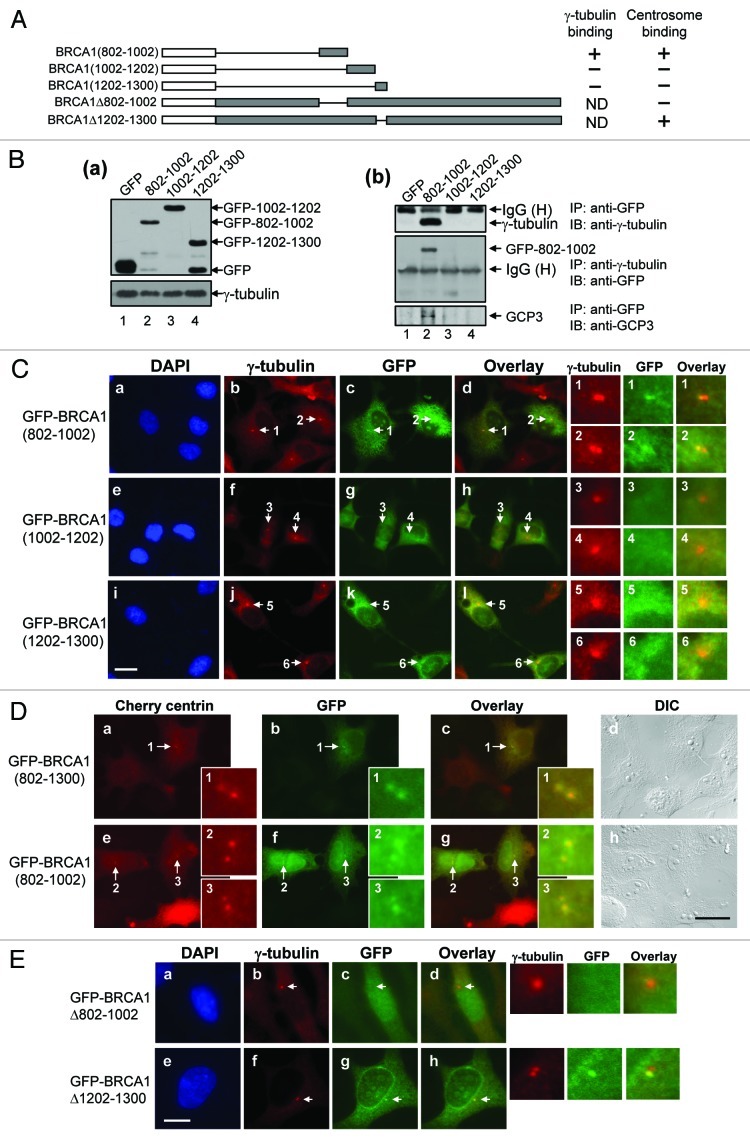
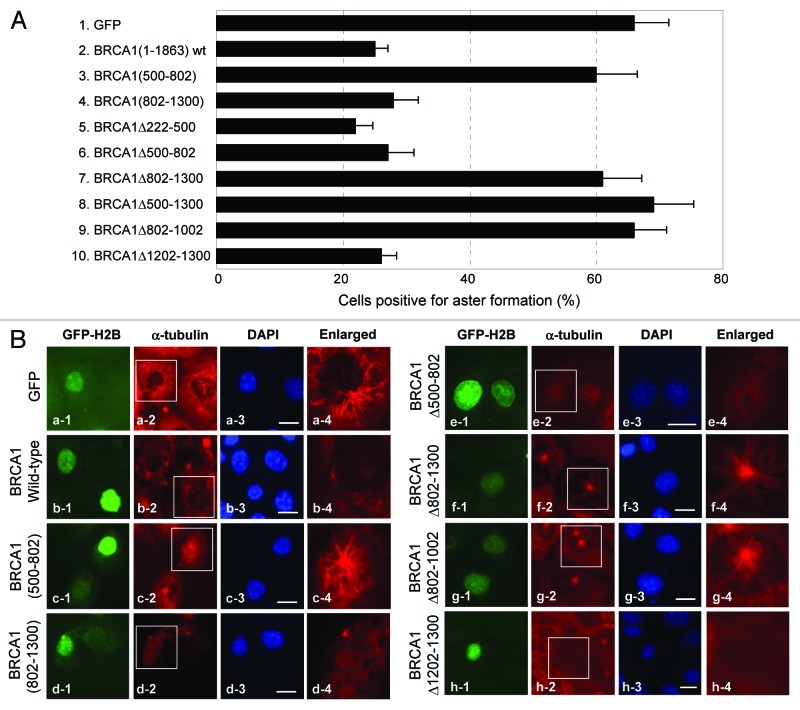
BRCA1, a product of a familial breast and ovarian cancer susceptibility gene, localizes to centrosomes and physically interacts with γ-tubulin, a key centrosomal protein for microtubule nucleation and anchoring at centrosomes. Here, we performed a rigorous analysis of centrosome localization of BRCA1, and found that BRCA1 is specifically associated with mother centrioles in unduplicated centrosomes, and daughter centrioles acquire BRCA1 prior to initiation of duplication, and thus duplicated centrosomes are both bound by BRCA1. We further found that BRCA1 suppresses centrosomal aster formation. In addition, we identified a new domain of BRCA1 critical for γ-tubulin binding, which confers not only its localization to centrosomes, but also its activity to suppress centrosomal aster formation.


Figures

None
Figure 1. Centrosome localization BRCA1. (A) MCF7 cells were pre-extracted, fixed and co-immunostained for centrosomes (anti-γ-tubulin antibody) and BRCA1 [anti-BRCA1 antibody (Ab-2)], and stained for DNA with DAPI. Mitotic cell (a‒d) and interphase cell with duplicated centrosomes (e-h) are shown. Arrows point to the centrosomes. Magnified images of the indicated areas are shown. Scale bar, 10 μm. (B) MCF7 cells were co-transfected with siRNA targeting BRCA1 or a randomized sequence control together with a drug selection marker plasmid. The cells sub-cloned after drug selection were examined for BRCA1 expression. NS; non-specific protein bands. (C) BRCA1RNAi and MCF7/control cells were co-immunostained with anti-γ-tubulin and anti-BRCA1 antibodies. Arrows point to the centrosomes. The insets show the magnified images of the indicated areas. Scale bar, 10 μm. (D) HeLa cells were transiently transfected with GFP-wt BRCA1, and immunostained with anti-γ-tubulin and anti-GFP antibodies. Arrows point to the centrosomes. Panels 1 and 2 show the magnified images of the indicated areas. Scale bar, 20 μm. (E) HeLa cells expressing Cherry centrin were transfected with either GFP or GFP-wt BRCA1. At 24 h post-transfection, cells were examined by fluorescent microscopy. Arrows point to the positions of centrosomes, and insets show the magnified images of the indicated areas. Scale bar, 10 μm.
None
Figure 2. Characterization of centrosome localization of BRCA1. MCF7 cells were co-immunostained for BRCA1 [anti-BRCA1 antibody (Ab-2)] and centrioles (anti-centrin antibody) (A). Yellow arrows point to the closely paired centrioles (a‒d), and blue arrows point to the separated centrioles (e‒h). The insets show the magnified images of the indicated areas. Scale bar, 8 μm. (B) HeLa cells were transfected with GFP-wt BRCA1, and immunostained with anti-GFP and anti-γ-tubulin antibodies. Arrows point to the centrosomes, and insets show the magnified images of the indicated areas. Scale bar, 10 μm. (C) G1 phase MCF7 cells enriched by serum-starvation followed by serum-stimulation for 8 h were treated with nocodazole for 4 h. Cells were briefly pre-extracted, fixed, and co-immunostained with mouse anti-centrin and rabbit anti-BRCA1 antibodies. Antibody-antigen complexes were detected with Alexa fluor 488-conjugated anti-rabbit IgG (green) and Alexa fluor 594-conjugated anti-mouse IgG (red) antibodies. MTs (and centrioles) were then immunostained using mouse anti-α-tubulin antibody, followed by Alexa fluor 680-conjugated anti-mouse IgG antibody. Although the Alexa fluor 680-anti-mouse IgG antibody detects both mouse anti-centrin and mouse anti-α-tubulin antibodies, it does not interfere with the data analysis. Arrows point to the position of the centrioles, and insets show the magnified image of the indicated areas. Scale bar, 10 μm.
None
Figure 3. BRCA1 specifically associates with mother centrioles in unduplicated centrosomes. (A) MCF7 cells in G1 phase were co-immunostained for cenexin and BRCA1. Arrows point to the position of the cenexin-positive mature centriole. The panel on the right shows the magnified image of the indicated area. Scale bar, 5 μm. (B) HeLa cells transfected with GFP-wt BRCA1 were immunostained with anti-centriolin and anti-GFP antibodies. Arrows point to the position of the centriolin-positive mature centriole. Insets show the magnified images of the indicated areas. Scale bar, 5 μm. (C) MCF7/GFP-centrin cells in early and late G1 were co-immunostained for cenexin and BRCA1. Panels e-i and n-r show the wide field immunostaining images. Panels 1 and 2 show the magnified images of the indicated areas, in which white arrows point to the daughter centrioles, and yellow arrows point to the mother centrioles. Scale bar in panels (a–d) and (j‒m), 8 μm, and in panels (e‒i) and (n‒r), 10 μm. (D) MCF7 cells were serum-starved for 36 h, and serum-stimulated in the presence of BrdU. At indicated time points, cells were immunostained for incorporated BrdU and centrioles, and the rates of BrdU-incorporation and centrosome duplication were determined from > 100 cells (a). MCF7 cells after 16 h serum-stimulation were co-immunostained for centrin and BRCA1 (b). Arrows in the inset of panel e point to duplicated centrioles. Scale bar, 8 μm.
None
Figure 4. BRCA1 suppresses centrosomal aster formation. (A) MCF7/control and BRCA1RNAi cells were treated with nocodazole on ice, and co-immunostained for MTs with anti-α-tubulin antibody and centrosomes with anti-γ-tubulin antibody (a). Arrows point to the positions of centrosomes. Insets show magnified images of the indicated areas. MCF7/control and BRCA1RNAi cells in parallel cultures were incubated in fresh warm media for 7 min to allow for MT re-growth. Cells were then co-immunostained for MTs and centrosomes (b). Arrows point to the positions of centrosomes. Panels m-p show magnified images of the indicated areas. Scale bar, 10 μm. The centrosomal aster formation in MCF7/control and BRCA1RNAi cells were assessed as positive if centrosomes had a MT aster with greater than 30 MTs (> 4 μm long). The results are shown in (B) as the average ± standard error (S.E). from three experiments. For each experiment, > 200 cells were examined. (C) BRCA1RNAi cells were transfected with BRCA1 resistant to the siRNA used for silencing BRCA1 expression (BRCA1Δ547–551) along with GFP-H2B as a transfection marker. As a control, a vector was transfected. The GFP-positive cells were examined for MT anchoring (aster formation). The results were shown as the average ± SE from three experiments. For each experiment, > 200 cells were examined. The representative immunostaining images are shown in (D). Scale bar, 10 μm.
None
Figure 5. BRCA1 suppresses centrosomal MT anchoring/elongation, but not MT nucleation. (A) HCC1937 cells were transfected with either GFP-vector or -wt BRCA1, and subjected to the assay as described in the legend to Figure 4, with either 1 min or 7 min of MT re-growth period. Cells were briefly extracted prior to fixation, and co-immunostained with anti-GFP and anti-α-tubulin antibodies. The GFP-BRCA1 signals at centrosomes are indicated by arrows in panel f and n. Scale bar, 10 μm. The frequencies of the GFP-positive cells with centrosomes that either nucleated or formed asters were determined, and the results are shown in (B) as average ± SE from three experiments. For each experiment, > 200 cells were examined.
None
Figure 6. Mapping of the regions of BRCA1 critical for interaction with γ-tubulin and centrosome localization. (A) A series of GFP-BRCA1 fragments were generated (a), and transiently transfected into HeLa cells. As a control, GFP-vector and -wt BRCA1 were transfected. The lysates from the transfected cells were immunoblotted with anti-GFP (top panel), anti-γ-tubulin (bottom panel) and anti-α-tubulin antibody (middle panel) (b). The corresponding bands of the transfected wt and mutant BRCA1 proteins are indicated by asterisks. The lysates were also subjected to immunoprecipitation using anti-GFP antibody, and the immunoprecipitates were immunoblotted with either anti-γ-tubulin (c, top panel) or anti-α-tubulin antibody (c, bottom panel). The lysates (5% of the amounts used for immunoprecipitation) was included as a reference. The reciprocal co-immunoprecipitation assay was performed with anti-γ-tubulin antibody, and immunoblotted with anti-GFP antibody (d). The corresponding bands of GFP-wt and -mutant BRCA1 proteins co-immunoprecipitated with γ-tubulin are indicated by asterisks. (B) A series of GFP-BRCA1 deletion mutants were constructed (a), which were transfected into HeLa cells. The lysates from the transfected cells were immunoblotted with anti-GFP (top panel), anti-γ-tubulin (bottom panel) and anti-α-tubulin antibody (middle panel) (b). The corresponding bands of the transfected wt and mutant BRCA1 are indicated by asterisks. The lysates were immunoprecipitated with either anti-GFP antibody or anti-γ-tubulin antibodies, and immunoblotted with anti-γ-tubulin antibody (c) and anti-GFP antibody (d), respectively. The corresponding bands of GFP-wt and -mutant BRCA1 proteins co-immunoprecipitated with γ-tubulin are indicated by asterisks. (C) The transfected cells described above in (A and B) were also immunostained with anti-γ-tubulin and anti-GFP antibodies. Arrows point to the position of the centrosomes, and insets show the magnified images of the indicated areas. Scale bar, 8 μm. > 50 GFP-positive cells were examined for each experiment. The GFP-tagged BRCA1 mutants/fragments were counted as positive for centrosome localization if > 80% cells had the GFP signal at centrosomes.
None
Figure 7. Dissection of the region (a.a. 802–1300) of BRCA1 for γ-tubulin binding and centrosome localization. A series of small BRCA1 fragments within a.a. 802–1300 tagged with GFP were generated (A), and transfected into HeLa cells. As a control, GFP-vector was transfected. The lysates from the transfected cells were immunoblotted with anti-GFP and anti-γ-tubulin antibodies (B-a). The lysates were immunoprecipitated with anti-GFP antibody and immunoblotted with anti-γ-tubulin (B-b, top panel) and anti-GCP-3 antibody (B-b, bottom panel). The lysates were also immunoprecipitated with anti-γ-tubulin antibody, and immunoblotted with anti-GFP antibody (B-b, middle panel). (C) The transfected cells described above were immunostained with anti-γ-tubulin and anti-GFP antibodies. Arrows point to the centrosomes. Panels 1–6 on the right show the magnified image of the indicated areas. Scale bar, 20 μm. (D) The GFP-BRCA1 fragments were transfected into HeLa cells expressing Cherry centrin, and examined by fluorescent microscopy. The images of the cells transfected with GFP-BRCA1(802–1300) and BRCA1(802–1002) are shown. GFP-BRCA1(1002–1202) and BRCA1(1202–1300) were not found at centrosomes (data not shown). Arrows point to the areas of centrosomes, and insets 1–3 show the magnified images of the indicated areas. Scale bar, 20 μm. (E) GFP-BRCA1 mutants deleted for either a.a. 802–1002 or a.a. 1202–1300 were also generated (A), transfected into HeLa cells, and immunostained with anti-γ-tubulin and anti-GFP antibodies. Arrows point to the centrosomes, and magnified images of the indicated areas are shown on the right. Scale bar, 10 μm.
None
Figure 8. Evaluation of wt and mutant BRCA1 for suppressing centrosomal aster formation. (A) The GFP-wt and mutant BRCA1 described in Figures 6 and 7 were transiently transfected into HCC1937 cells along with GFP-H2B as a transfection marker, and the transfected cells were subjected to the aster formation assay. The results are shown as average ± SE from three experiments. For each experiment, > 200 cells were examined. The representative immunostaining images are shown in (B). The panel on the right (a-4 to h-4) shows the magnified image of the indicated area (a-2 to h-2). Scale bar, 20 μm.

Similar articles

Cited by

References

    1. Miki Y, Swensen J, Shattuck-Eidens D, Futreal PA, Harshman K, Tavtigian S, et al. A strong candidate for the breast and ovarian cancer susceptibility gene BRCA1. Science. 1994;266:66–71. doi: 10.1126/science.7545954. - DOI - PubMed
    1. Turner N, Tutt A, Ashworth A. Hallmarks of ‘BRCAness’ in sporadic cancers. Nat Rev Cancer. 2004;4:814–9. doi: 10.1038/nrc1457. - DOI - PubMed
    1. Chapman MS, Verma IM. Transcriptional activation by BRCA1. Nature. 1996;382:678–9. doi: 10.1038/382678a0. - DOI - PubMed
    1. Monteiro AN, August A, Hanafusa H. Evidence for a transcriptional activation function of BRCA1 C-terminal region. Proc Natl Acad Sci USA. 1996;93:13595–9. doi: 10.1073/pnas.93.24.13595. - DOI - PMC - PubMed
    1. Scully R, Chen J, Ochs RL, Keegan K, Hoekstra M, Feunteun J, et al. Dynamic changes of BRCA1 subnuclear location and phosphorylation state are initiated by DNA damage. Cell. 1997;90:425–35. doi: 10.1016/S0092-8674(00)80503-6. - DOI - PubMed

Publication types