

GNAS1 and PHD2 short-interfering RNA support bone regeneration in vitro and in an in vivo sheep model
- PMID: 22833384
- PMCID: PMC3830105
- DOI: 10.1007/s11999-012-2475-4
GNAS1 and PHD2 short-interfering RNA support bone regeneration in vitro and in an in vivo sheep model
Abstract
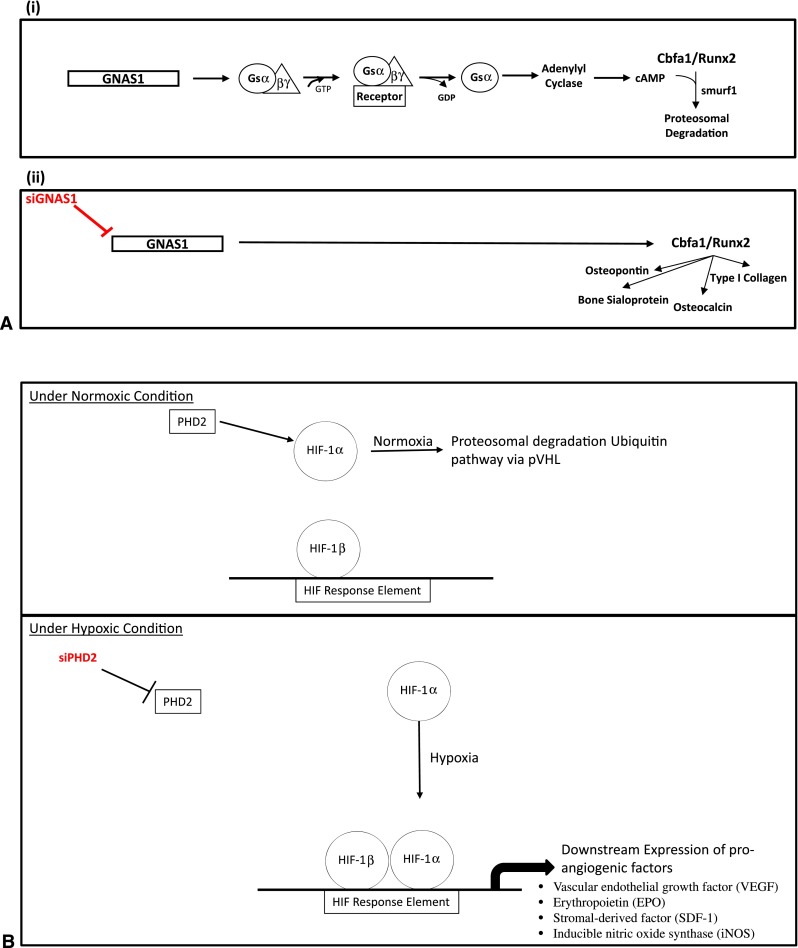
Background: Our ability to guide cells in biomaterials for in vivo bone repair is limited and requires novel strategies. Short-interfering RNA (siRNA) allows the regulation of multiple cellular pathways. Core binding factor alpha 1 (Cbfa1) and hypoxia-inducible factor 1 (HIF-1) pathways can be modulated to direct bone formation via siRNA against guanine nucleotide-binding protein alpha-stimulating activity polypeptide 1 (siGNAS1) and prolyl hydroxylase domain-containing protein 2 (siPHD2), respectively.
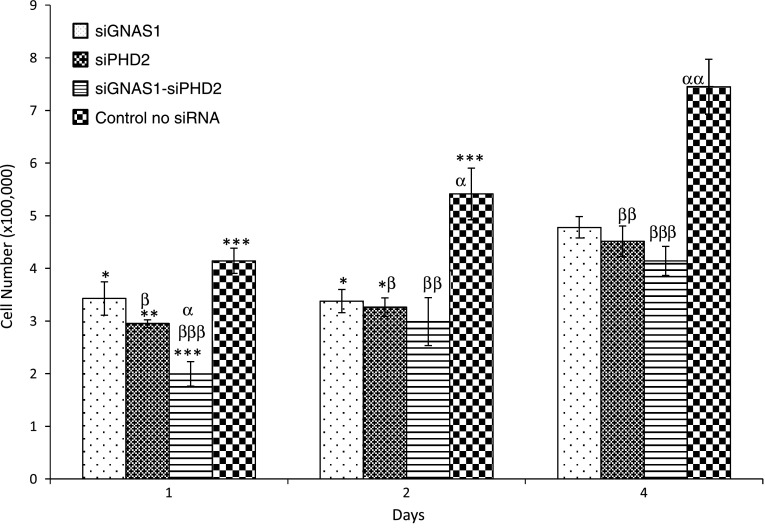
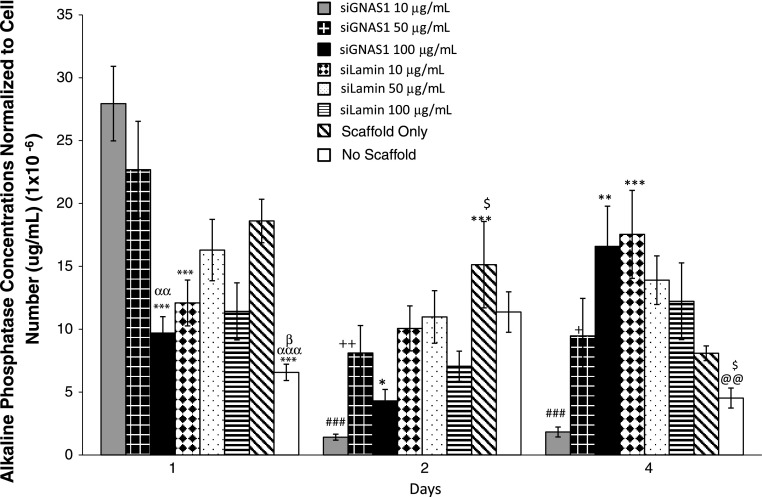
Questions/purposes: We determined whether the administration of siGNAS1 and siPHD2 in mesenchymal stem cells (MSCs) promotes osteogenic phenotype, the dose-dependent effects of siGNAS1 on MSC differentiation to osteogenic phenotype, and whether the two siRNAs promote bone formation in vivo.
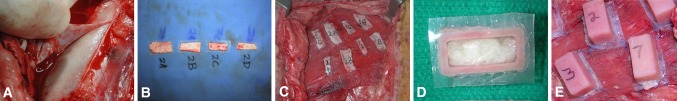
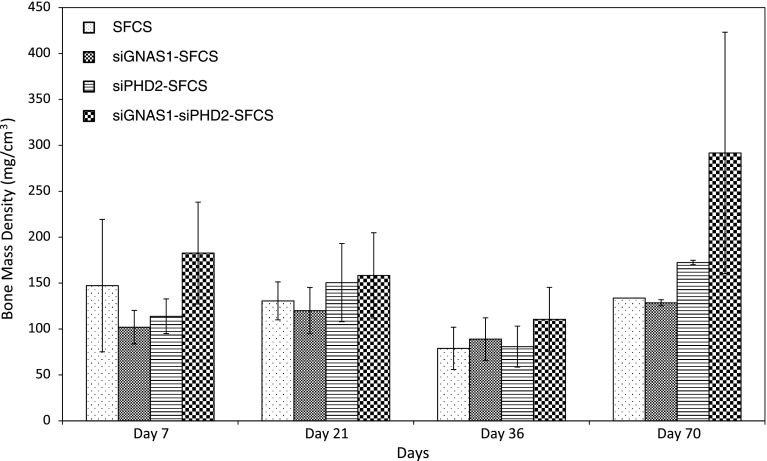
Methods: siRNAs were administered to MSCs at Day 0, and protein expression of bone-specific markers was assessed at Days 1, 2, and 4 (n = 3/group/time point). In an in vivo model using seven sheep, chambers containing silk fibroin-chitosan (SFCS) scaffolds with siRNA were implanted over the periosteum and harvested at Days 7, 21, 36, and 70 (n = 4/group/time point, except at Day 70 [n = 2]) to assess bone formation.
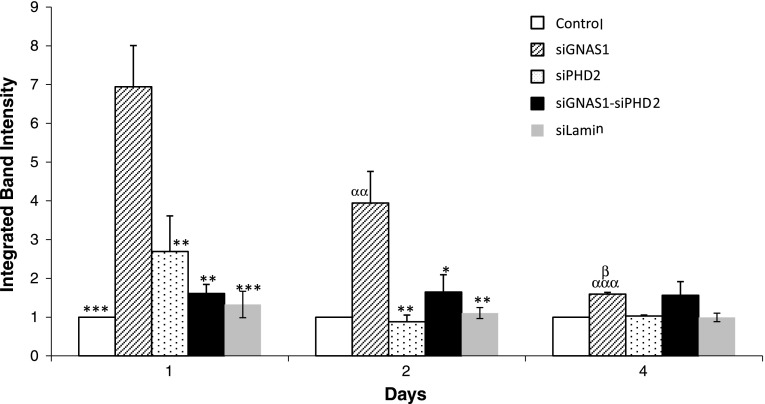
Results: siGNAS1 promoted collagen I and osteopontin expression, whereas siPHD2 had no effect in vitro. Dose-dependent effects of siGNAS1 on ALP expression were maximal at Day 1 for 10 μg/mL and Day 4 for 100 μg/mL. In vivo, by Day 70, mean bone volume increased compared to Day 7 for siGNAS1-SFCS (47.8 versus 1.8 mg/mL) and siPHD2-SFCS (61.3 versus 1.5 mg/mL).
Conclusions: Both siPHD2 and siGNAS1 support bone regeneration in vivo, whereas only siGNAS1 regulates bone phenotype in MSCs in vitro.
Figures


Similar articles
-
Enhancement of angiogenesis through stabilization of hypoxia-inducible factor-1 by silencing prolyl hydroxylase domain-2 gene.Mol Ther. 2008 Jul;16(7):1227-34. doi: 10.1038/mt.2008.90. Epub 2008 May 20. Mol Ther. 2008. PMID: 18500250
-
Knockdown of SLC41A1 magnesium transporter promotes mineralization and attenuates magnesium inhibition during osteogenesis of mesenchymal stromal cells.Stem Cell Res Ther. 2017 Feb 21;8(1):39. doi: 10.1186/s13287-017-0497-2. Stem Cell Res Ther. 2017. PMID: 28222767 Free PMC article.
-
Inhibition of metastasis-associated gene 1 expression affects proliferation and osteogenic differentiation of immortalized human mesenchymal stem cells.Cell Prolif. 2011 Apr;44(2):128-38. doi: 10.1111/j.1365-2184.2010.00735.x. Cell Prolif. 2011. PMID: 21401754 Free PMC article.
-
Inhibiting PHD2 in human periodontal ligament cells via lentiviral vector-mediated RNA interference facilitates cell osteogenic differentiation and periodontal repair.J Leukoc Biol. 2021 Sep;110(3):449-459. doi: 10.1002/JLB.1MA0321-761R. Epub 2021 May 14. J Leukoc Biol. 2021. PMID: 33988258
-
Regulation of HIF prolyl hydroxylases by hypoxia-inducible factors.J Cell Biochem. 2004 Jun 1;92(3):491-501. doi: 10.1002/jcb.20067. J Cell Biochem. 2004. PMID: 15156561
Cited by
-
Role of prolyl hydroxylase domain proteins in bone metabolism.Osteoporos Sarcopenia. 2022 Mar;8(1):1-10. doi: 10.1016/j.afos.2022.03.001. Epub 2022 Mar 22. Osteoporos Sarcopenia. 2022. PMID: 35415275 Free PMC article. Review.
-
The hypoxia-inducible factor pathway, prolyl hydroxylase domain protein inhibitors, and their roles in bone repair and regeneration.Biomed Res Int. 2014;2014:239356. doi: 10.1155/2014/239356. Epub 2014 May 11. Biomed Res Int. 2014. PMID: 24895555 Free PMC article. Review.
-
Characterization of dielectrophoresis-aligned nanofibrous silk fibroin-chitosan scaffold and its interactions with endothelial cells for tissue engineering applications.Acta Biomater. 2014 Aug;10(8):3630-40. doi: 10.1016/j.actbio.2014.05.005. Epub 2014 May 10. Acta Biomater. 2014. PMID: 24821141 Free PMC article.
-
Small non-coding RNAs-based bone regulation and targeting therapeutic strategies.Mol Cell Endocrinol. 2017 Nov 15;456:16-35. doi: 10.1016/j.mce.2016.11.018. Epub 2016 Nov 23. Mol Cell Endocrinol. 2017. PMID: 27888003 Free PMC article. Review.
-
Editorial: our enthusiasm for "related research".Clin Orthop Relat Res. 2013 Oct;471(10):3069-70. doi: 10.1007/s11999-013-3214-1. Epub 2013 Aug 9. Clin Orthop Relat Res. 2013. PMID: 23928708 Free PMC article. No abstract available.
References
-
- Burns JS, Rasmussen PL, Larsen KH, Schroder HD, Kassem M. Parameters in three-dimensional osteospheroids of telomerized human mesenchymal (stromal) stem cells grown on osteoconductive scaffolds that predict in vivo bone-forming potential. Tissue Eng Part A. 2010;16:2331–2342. doi: 10.1089/ten.tea.2009.0735. - DOI - PubMed
-
- Cohen MM., Jr The new bone biology: pathologic, molecular, and clinical correlates. Am J Med Genet A. 2006;140:2646–2706. - PubMed
Publication types
MeSH terms
Substances
LinkOut - more resources
Full Text Sources
Other Literature Sources
Medical
Research Materials
