

MTG16 contributes to colonic epithelial integrity in experimental colitis
- PMID: 22833394
- PMCID: PMC3663894
- DOI: 10.1136/gutjnl-2011-301439
MTG16 contributes to colonic epithelial integrity in experimental colitis
Abstract
Objective: The myeloid translocation genes (MTGs) are transcriptional corepressors with both Mtg8(-/-) and Mtgr1(-/-) mice showing developmental and/or differentiation defects in the intestine. We sought to determine the role of MTG16 in intestinal integrity.
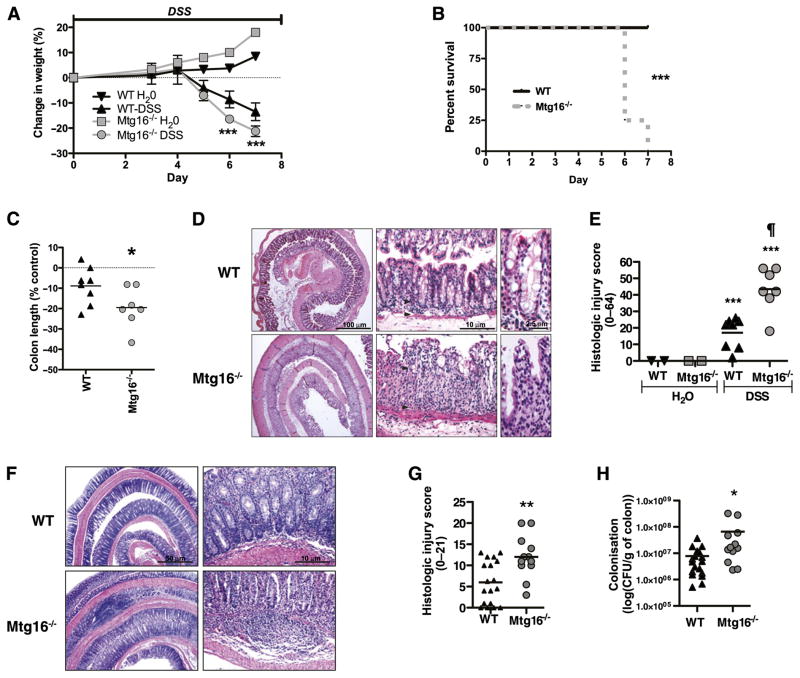
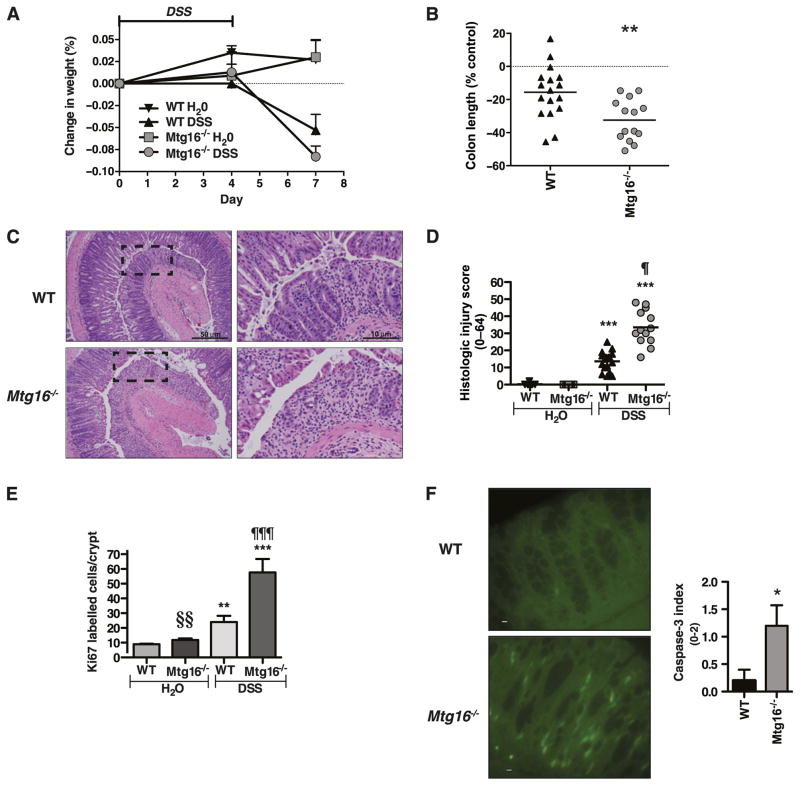
Methods: Baseline and stress induced colonic phenotypes were examined in Mtg16(-/-) mice. To unmask phenotypes, we treated Mtg16(-/-) mice with dextran sodium sulphate (DSS) or infected them with Citrobacter rodentium and the colons were examined for ulceration and for changes in proliferation, apoptosis and inflammation.
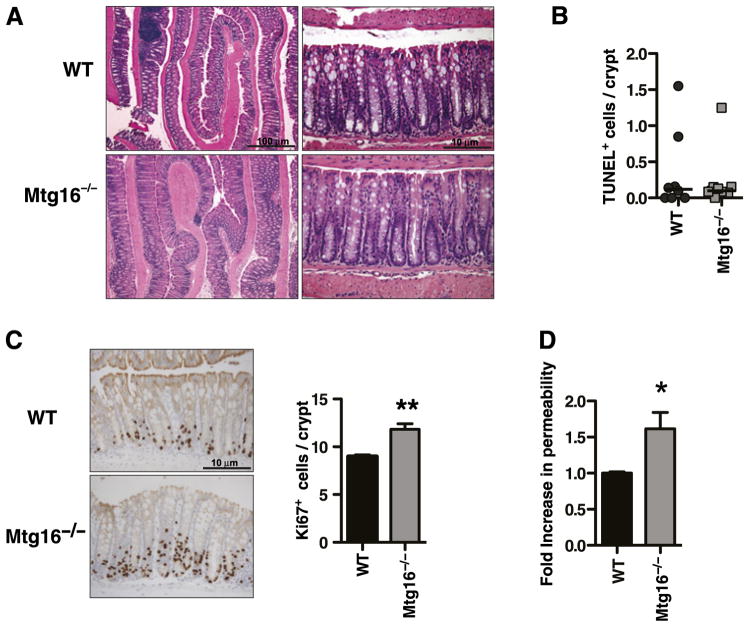
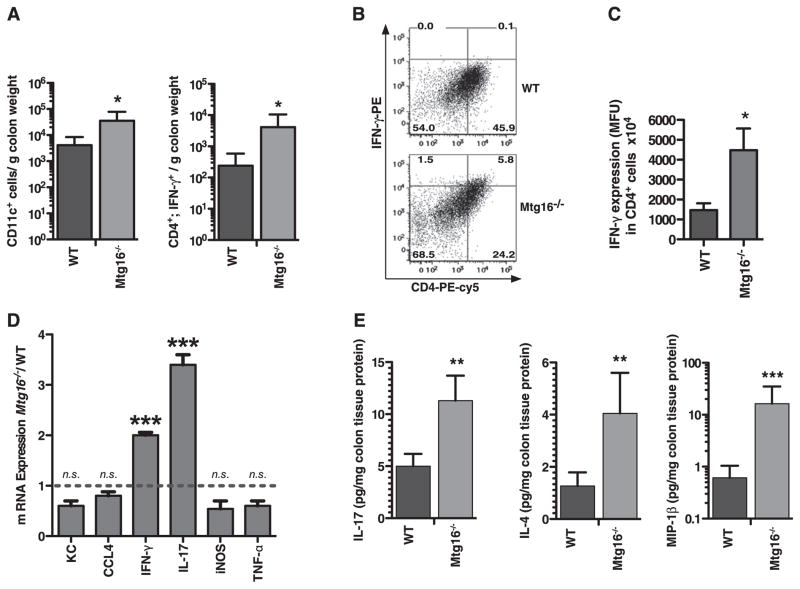
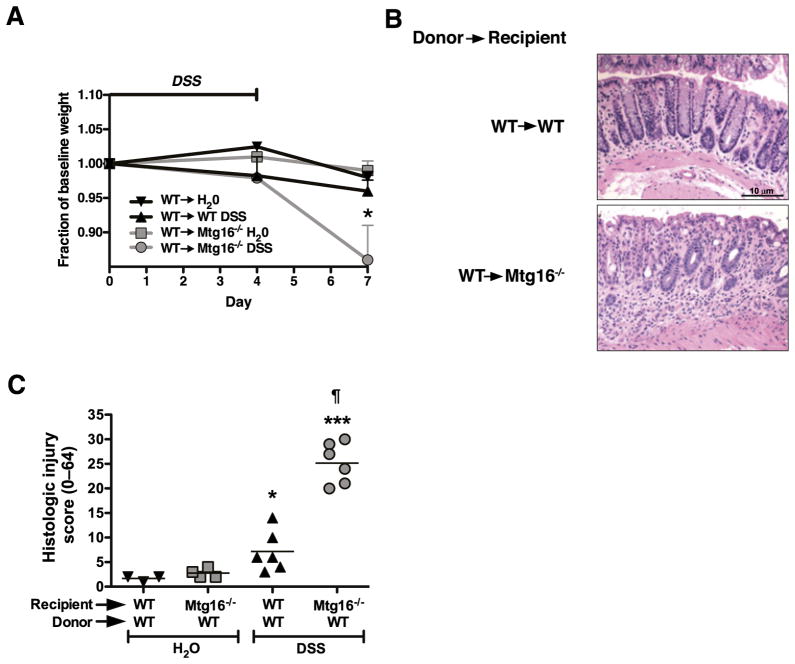
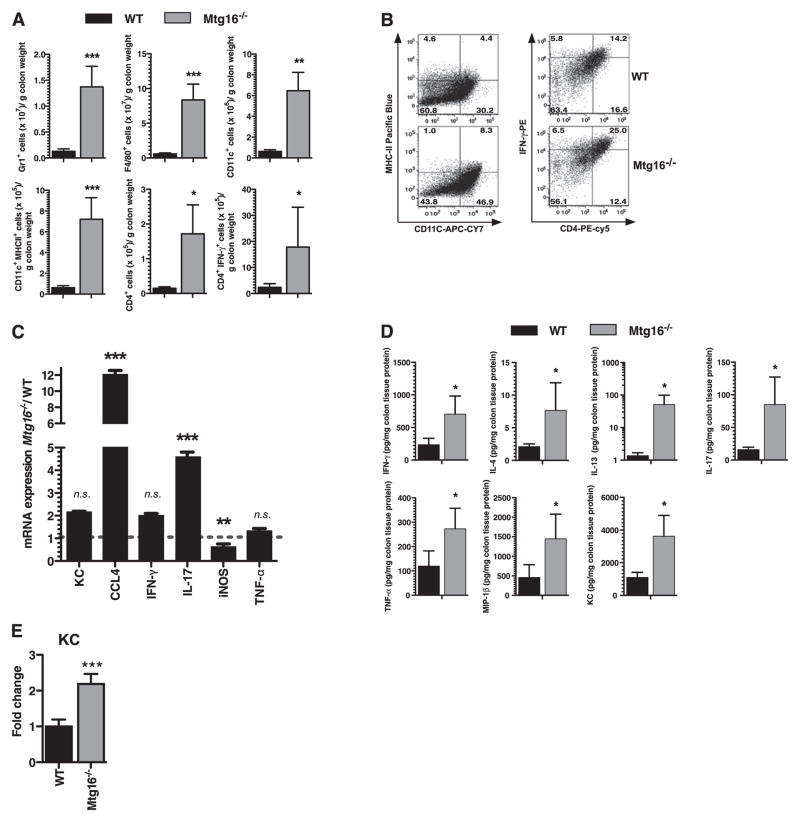
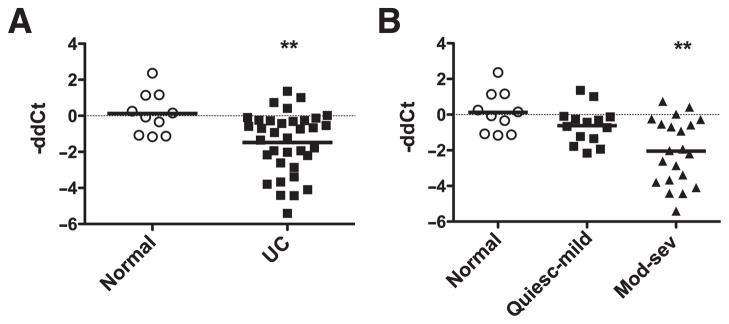
Results: Mtg16(-/-) mice have altered immune subsets, suggesting priming towards Th1 responses. Mtg16(-/-) mice developed increased weight loss, diarrhoea, mortality and histological colitis and there were increased innate (Gr1(+), F4/80(+), CD11c(+) and MHCII(+); CD11c(+)) and Th1 adaptive (CD4) immune cells in Mtg16(-/-) colons after DSS treatment. Additionally, there was increased apoptosis and a compensatory increased proliferation in Mtg16(-/-) colons. Compared with wild-type mice, Mtg16(-/-) mice exhibited increased colonic CD4;IFN-γ cells in vehicle-treated and DSS-treated mice. Adoptive transfer of wild-type marrow into Mtg16(-/-) recipients did not rescue the Mtg16(-/-) injury phenotype. Isolated colonic epithelial cells from DSS-treated Mtg16(-/-) mice exhibited increased KC (Cxcl1) mRNA expression when compared with wild-type mice. Mtg16(-/-) mice infected with C rodentium had more severe colitis and greater bacterial colonisation. Last, MTG16 mRNA levels were reduced in human ulcerative colitis versus normal colon tissues.
Conclusions: These observations indicate that MTG16 is critical for colonocyte survival and regeneration in response to intestinal injury and provide evidence that this transcriptional corepressor regulates inflammatory recruitment in response to injury.
Keywords: Colitis; Crohn's colitis; Helicobacter pylori; Helicobacter pylori infection; Helicobacter pylori—pathogenesis; IBD; IBD basic research; IBD—genetics; Mtg16; angiogenesis; bacterial pathogenesis; cancer; carcinogenesis; colon carcinogenesis; colorectal cancer; colorectal diseases; cytokines; dextran sulphate sodium; experimental colitis; gastrointestinal pathology; gene expression; immunity; inflammatory bowel disease; inflammatory mechanisms; intestinal T cells; matrix metalloproteinase; ulcerative; wound-healing.
Conflict of interest statement
Figures
Similar articles
-
Transcriptional corepressor MTG16 regulates small intestinal crypt proliferation and crypt regeneration after radiation-induced injury.Am J Physiol Gastrointest Liver Physiol. 2015 Mar 15;308(6):G562-71. doi: 10.1152/ajpgi.00253.2014. Epub 2015 Jan 8. Am J Physiol Gastrointest Liver Physiol. 2015. PMID: 25573176 Free PMC article.
-
Deletion of Mtgr1 sensitizes the colonic epithelium to dextran sodium sulfate-induced colitis.Gastroenterology. 2006 Aug;131(2):579-88. doi: 10.1053/j.gastro.2006.06.009. Gastroenterology. 2006. PMID: 16890610
-
Kaiso is required for MTG16-dependent effects on colitis-associated carcinoma.Oncogene. 2019 Jun;38(25):5091-5106. doi: 10.1038/s41388-019-0777-7. Epub 2019 Mar 11. Oncogene. 2019. PMID: 30858547 Free PMC article.
-
Development, validation and implementation of an in vitro model for the study of metabolic and immune function in normal and inflamed human colonic epithelium.Dan Med J. 2015 Jan;62(1):B4973. Dan Med J. 2015. PMID: 25557335 Review.
-
Transplantation of intestinal organoids into a mouse model of colitis.Nat Protoc. 2022 Mar;17(3):649-671. doi: 10.1038/s41596-021-00658-3. Epub 2022 Feb 2. Nat Protoc. 2022. PMID: 35110738 Review.
Cited by
-
BVES is required for maintenance of colonic epithelial integrity in experimental colitis by modifying intestinal permeability.Mucosal Immunol. 2018 Sep;11(5):1363-1374. doi: 10.1038/s41385-018-0043-2. Epub 2018 Jun 15. Mucosal Immunol. 2018. PMID: 29907869 Free PMC article.
-
The Transcription Co-Repressors MTG8 and MTG16 Regulate Exit of Intestinal Stem Cells From Their Niche and Differentiation Into Enterocyte vs Secretory Lineages.Gastroenterology. 2020 Oct;159(4):1328-1341.e3. doi: 10.1053/j.gastro.2020.06.012. Epub 2020 Jun 15. Gastroenterology. 2020. PMID: 32553763 Free PMC article.
-
Myeloid translocation genes differentially regulate colorectal cancer programs.Oncogene. 2016 Dec 8;35(49):6341-6349. doi: 10.1038/onc.2016.167. Epub 2016 Jun 6. Oncogene. 2016. PMID: 27270437 Free PMC article.
-
High-throughput multi-analyte Luminex profiling implicates eotaxin-1 in ulcerative colitis.PLoS One. 2013 Dec 18;8(12):e82300. doi: 10.1371/journal.pone.0082300. eCollection 2013. PLoS One. 2013. PMID: 24367513 Free PMC article.
-
Ornithine decarboxylase regulates M1 macrophage activation and mucosal inflammation via histone modifications.Proc Natl Acad Sci U S A. 2017 Jan 31;114(5):E751-E760. doi: 10.1073/pnas.1614958114. Epub 2017 Jan 17. Proc Natl Acad Sci U S A. 2017. PMID: 28096401 Free PMC article.
References
-
- Davis JN, Williams BJ, Herron JT, et al. ETO-2, a new member of the ETO-family of nuclear proteins. Oncogene. 1999;18:1375–83. - PubMed
-
- Davis JN, McGhee L, Meyers S, et al. The ETO (MTG8) gene family. Gene. 2003;303:1–10. - PubMed
-
- Calabi F, Cilli V. CBFA2T1, a gene rearranged in human leukemia, is a member of a multigene family. Genomics. 1998;52:332–41. - PubMed
-
- Yamagata T, Maki K, Mitani K. Runx1/AML1 in normal and abnormal hematopoiesis. Int J Hematol. 2005;82:1–8. - PubMed
Publication types
MeSH terms
Substances
Grants and funding
- UL1 TR000445/TR/NCATS NIH HHS/United States
- R01 DK053620/DK/NIDDK NIH HHS/United States
- P50 CA095103/CA/NCI NIH HHS/United States
- K08 DK080221/DK/NIDDK NIH HHS/United States
- AT004821-S1/AT/NCCIH NIH HHS/United States
- DK053620/DK/NIDDK NIH HHS/United States
- CA64140/CA/NCI NIH HHS/United States
- I01 BX001453/BX/BLRD VA/United States
- P30 CA068485/CA/NCI NIH HHS/United States
- P30DK058404/DK/NIDDK NIH HHS/United States
- UL1 RR024975/RR/NCRR NIH HHS/United States
- P30CA068485/CA/NCI NIH HHS/United States
- UL1 RR024975-01/RR/NCRR NIH HHS/United States
- P50CA095103/CA/NCI NIH HHS/United States
- HL088494/HL/NHLBI NIH HHS/United States
- P30 DK058404/DK/NIDDK NIH HHS/United States
- DK080221/DK/NIDDK NIH HHS/United States
- R01 AT004821/AT/NCCIH NIH HHS/United States
- AT004821/AT/NCCIH NIH HHS/United States
- P01 CA116087/CA/NCI NIH HHS/United States
- 2 UL1 TR000445-06/TR/NCATS NIH HHS/United States
- R01 HL088494/HL/NHLBI NIH HHS/United States
- R01 CA064140/CA/NCI NIH HHS/United States
LinkOut - more resources
Full Text Sources
Research Materials