. 2012 Oct;40(18):8979-92.
doi: 10.1093/nar/gks694. Epub 2012 Jul 24.

Regulatory consequences of gene translocation in bacteria

Affiliations

Regulatory consequences of gene translocation in bacteria

Dena H S Block et al. Nucleic Acids Res. 2012 Oct.

Abstract

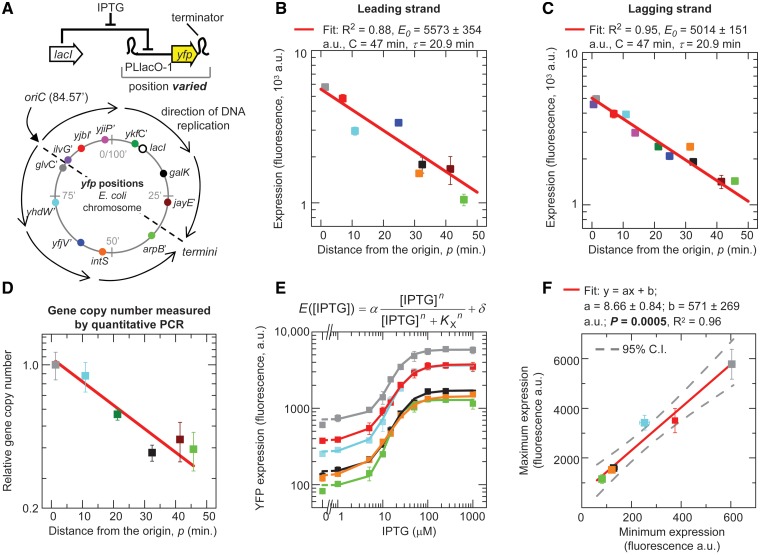
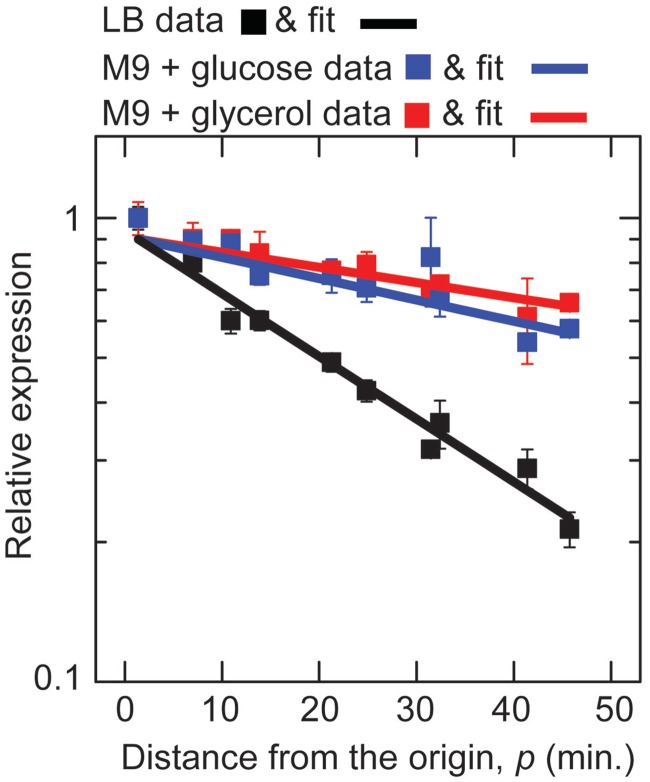
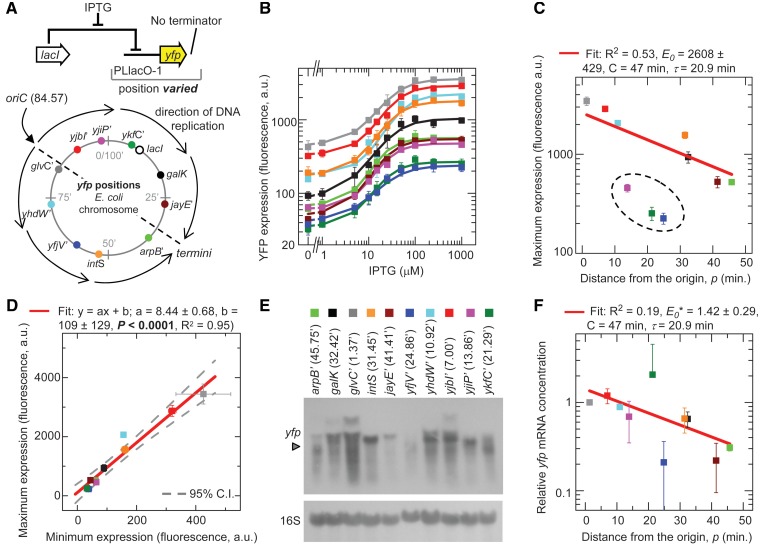
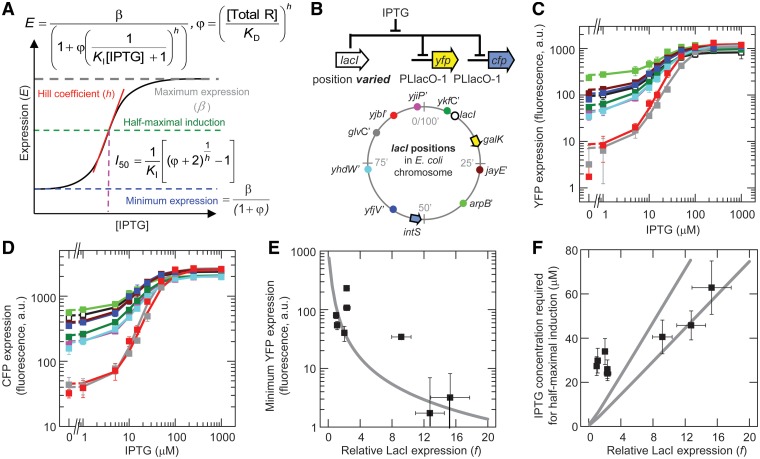
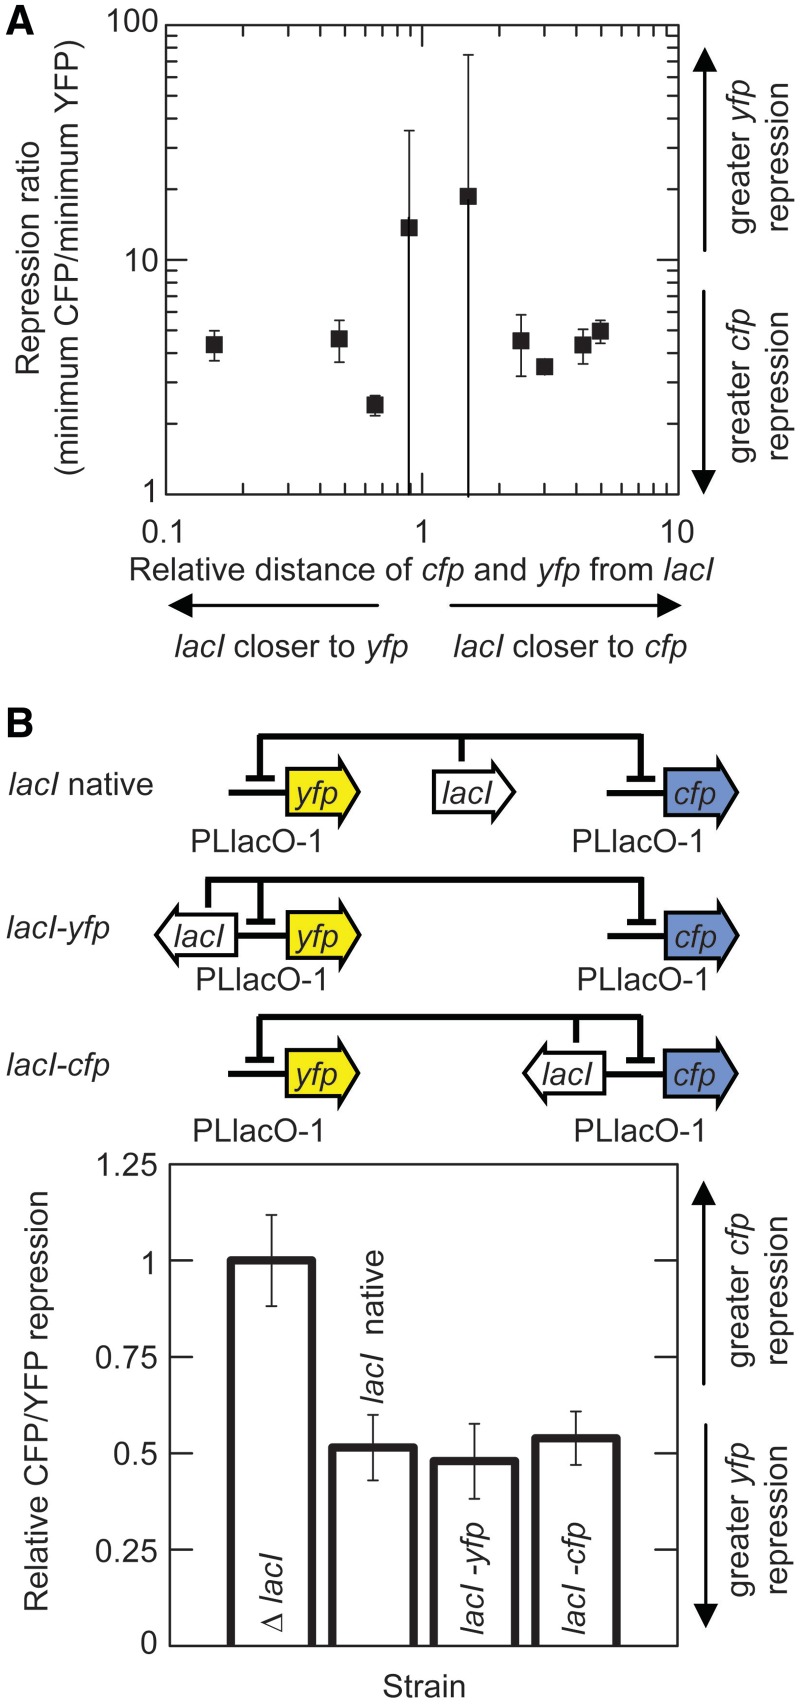
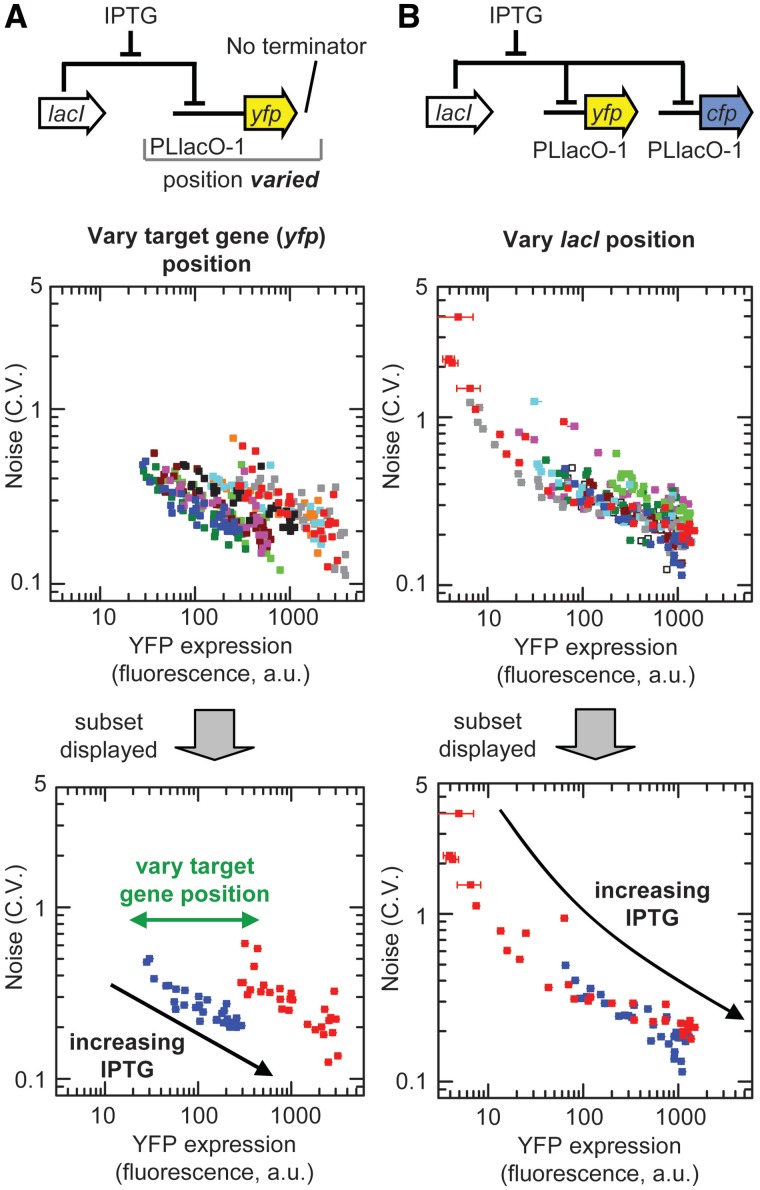
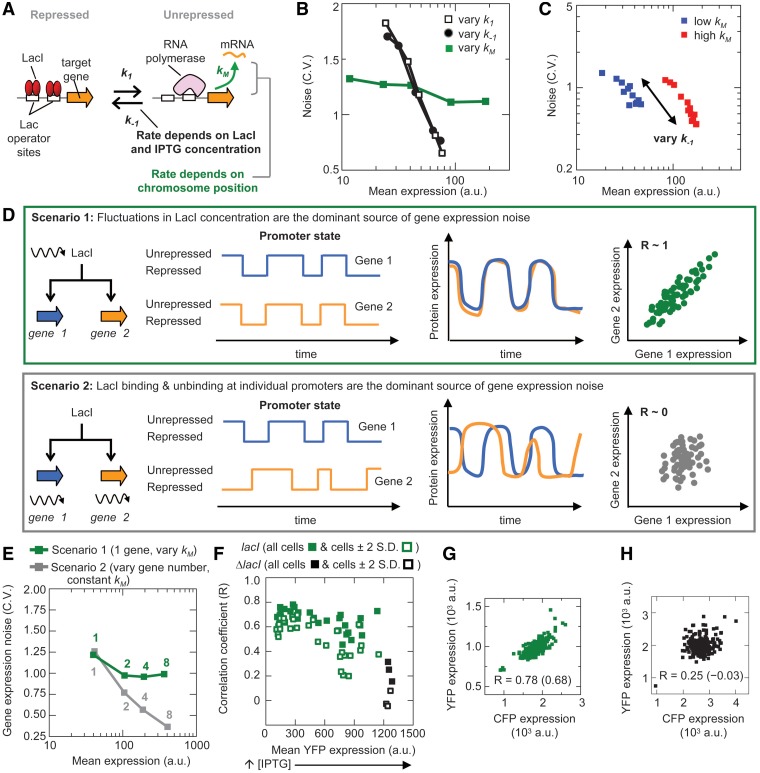
Gene translocations play an important role in the plasticity and evolution of bacterial genomes. In this study, we investigated the impact on gene regulation of three genome organizational features that can be altered by translocations: (i) chromosome position; (ii) gene orientation; and (iii) the distance between a target gene and its transcription factor gene ('target-TF distance'). Specifically, we quantified the effect of these features on constitutive expression, transcription factor binding and/or gene expression noise using a synthetic network in Escherichia coli composed of a transcription factor (LacI repressor) and its target gene (yfp). Here we show that gene regulation is generally robust to changes in chromosome position, gene orientation and target-TF distance. The only demonstrable effect was that chromosome position alters constitutive expression, due to changes in gene copy number and local sequence effects, and that this determines maximum and minimum expression levels. The results were incorporated into a mathematical model which was used to quantitatively predict the responses of a simple gene network to gene translocations; the predictions were confirmed experimentally. In summary, gene translocation can modulate constitutive gene expression levels due to changes in chromosome position but it has minimal impact on other facets of gene regulation.


Figures

Figure 1.
Figure 1.
Gene expression at different chromosome positions and gene orientations. Error bars indicate s.e.m. of duplicate measurements. Color of the data symbols indicate positions in panel A. Strain numbers in the Materials and Methods section. (A) Diagram showing the gene circuit used in these experiments and different chromosome positions of yfp, origin and termination of replication, and lacI. (B, C) YFP expression on the leading and lagging strands as a function of the shortest distance of yfp from the origin (oriC). Data fitted to Equation (1). (D) Gene copy number as a function of chromosome position. (E) Induction curves for yfp at six positions with four on the leading strand (galK, arpB′, intS and yhdW′) and two on the lagging strand (yjbI′ and glvC′). Data fitted to equation shown where α is the maximum induced amount of expression, δ is the minimum expression, n is the Hill coefficient and KX is the IPTG concentration at half-maximal induction. The observed maximum expression = α + δ = constitutive expression. (F) Maximum YFP expression as a function of minimum YFP expression. Data from panel E. Maximum and minimum expression were obtained experimentally (i.e. not from fits) at 1 and 0 mM IPTG.
Figure 2.
Figure 2.
Effect of chromosome position on gene expression depends on cell growth rates. Error bars indicate s.e.m. of duplicate measurements. Normalized gene expression as a function of the shortest distance from the target gene to the origin (oriC) in three different media. Chromosome positions are on the leading (galK, arpB′, intS and yhdW′) and lagging (yjbI′, yjiP′, ykfC′, jayE′, yfjV′ and glvC′) strands (strain numbers in Materials and Methods section). Gene expression was normalized to the level measured at the position closest to the origin (glvC′). The predicted function is determined by Equation (1). The function was completely determined by the values for C and the doubling times (τ) which were obtained independently of this plot (Supplementary Figure S1). Intercept is 1.0 because the data were normalized.
Figure 3.
Figure 3.
The expression of the target gene without flanking terminators at different chromosome positions. Error bars indicate s.e.m. Color of the data symbols throughout the figure indicates positions in panel A. (A) Gene circuit used in these experiments and chromosome positions of yfp, origin and termination of replication, and lacI are reshown. Strains used are: yjbI′ lagging (HL3779), yjiP′ lagging (HL4268), ykfC′ lagging (HL4237), galK leading (HL1951), jayE′ lagging (HL4238), arpB′ leading (HL3776), intS leading (HL2821), yfjV′ lagging (HL4236), yhdW′ leading (HL4235) and glvC′ lagging (HL3778). (B) Induction curves for yfp measured in triplicate. Lines indicate fits using the equation at the top of Figure 1E. (C) Maximum YFP expression as a function of the shortest distance from the origin. (D) Maximum YFP expression as a function of minimum YFP expression for data shown in panel B. (E) Representative northern blot of yfp mRNA and 16S loading control at different chromosome positions for the strains in panel B. The shortest distance from the origin (min.) is in parentheses. Contrast and brightness were adjusted solely to enhance visualization of the printed figure; no bands were obscured or selectively enhanced. (F) The relative yfp mRNA concentration obtained from independent duplicate samples in separate northern blots as a function of chromosome position. Fit is the same as panel C except the y-intercept value (E0*) is the extrapolated normalized mRNA concentration at the origin.
Figure 4.
Figure 4.
Using chromosome position to modulate gene regulation. Error bars indicate s.e.m. (A) Incorporating chromosome position effects into a model of gene regulation. β is the expression efficiency which is equal to the maximum expression, [IPTG] is the IPTG concentration, KI is the equilibrium association constant for IPTG binding to LacI, [Total R] is the total LacI concentration, KD is the repressor concentration required for half-maximal induction in the absence of IPTG, and h is the Hill coefficient for LacI binding to operator sites at PLlacO-1. (B) Diagram showing the gene circuit used in these experiments and the positions of lacI and the target genes (cfp and yfp). The positions of lacI are: yjbI′ lagging (HL2329), yjiP′ lagging (HL4269), ykfC′ lagging (HL4349), jayE′ lagging (HL4271), arpB′ leading (HL2328), yfjV′ lagging (HL4270), yhdW′ leading (HL4272), glvC′ lagging (HL4273) and at the native position (7.88′) on the lagging strand (HL1852). cfp and yfp are at intS and galK and both are on the leading strand. (C, D) YFP and CFP expression as a function of IPTG with lacI at different positions. (E) Minimum YFP expression as a function of the relative LacI expression. Black symbols indicate data and gray line is the relationship predicted by Equation (3). (F) IPTG concentration required for half-maximal induction (I50) as a function of the relative LacI expression. Black symbols indicate data and gray lines are the relationships predicted by Equation (4) with KI = 6.3 x 10⁵ and 1.0 x 10⁶ M−1 (upper and lower lines, respectively).
Figure 5.
Figure 5.
Target-TF distance does not affect LacI repression. Error bars indicate s.e.m. of duplicate measurements. (A) Repression ratio (i.e. ratio of minimum expression) of two target genes cfp and yfp under PLlacO-1 as a function of their relative distances from lacI. lacI chromosome position is varied and target gene positions are constant. CFP and YFP expression were measured at 0 mM IPTG. (B) Relative CFP/YFP repression (defined in main text) at very short distances with lacI immediately upstream of yfp or cfp (HL2620 and HL2664, respectively), at the native position (HL1852) or deleted (Δ lacI, HL2028).
Figure 6.
Figure 6.
Effect of chromosome position on gene expression noise. Error bars indicate s.e.m. of each sample. Color of the data symbols indicates the chromosome positions in Figure 1A. Gene expression noise as a function of mean YFP expression at different target gene (yfp) positions (A) different lacI positions (B). At top we show the gene circuit for each experiment. Upper plots show all positions and lower plots display only two positions. Gene expression noise for cfp is displayed in Supplementary Figure S7.
Figure 7.
Figure 7.
Chromosome position has minimal impact on gene expression noise. (A) Model of gene expression as described in main text. (B) Simulated gene expression noise as a function of mean expression at varying values for k1, k−1 and kM. Initially k1 = k−1 = 0.001 concentration·time−1 and kM = 0.1 concentration·time−1. Each value was independently varied by 0.25-, 0.5-, 2- and 4-fold. (C) Varying the rate of LacI binding at two different rates of transcription. Simulation was performed as above with k−1 = 0.1, 0.129, 0.167, 0.215, 0.278, 0.359, 0.464, 0.600, 0.774 and 1.000 x 10⁻³ concentration·time−1 at two values for kM (0.05 and 2.00 concentration·time−1, blue and red symbols, respectively). (D) Predicted effect on the promoter state and gene expression where fluctuations in LacI concentrations (Scenario 1) or LacI binding and unbinding at individual promoters (Scenario 2) are the dominant sources of expression noise. (E) Stochastic simulation where mRNA concentration was varied by altering gene copy number or the value of kM (gray and green numbers indicate fold change in gene copies or kM, respectively). (F) Correlation coefficient (R) as a function of mean YFP expression. Data derived from measurements of HL1852 at different [IPTG] in Figure 4C. Solid symbols indicate R-values calculated from all cells and unshaded symbols indicate R-values calculated from only cells within 2 S.D.s of the mean. Green symbols indicate strain HL1852 and black symbols indicate strain HL2028, which is HL1852 with lacI deleted. (G, H) Representative scatter plots of CFP and YFP expression for HL1852 and HL2028. R-values are calculated from all cells or for only cells within 2 S.D. of the mean (values in parentheses).

Similar articles

Cited by

References

    1. Hughes D. Evaluating genome dynamics: the constraints on rearrangements within bacterial genomes. Genome Biol. 2000;1 REVIEWS0006. - PMC - PubMed
    1. Shapiro JA. Letting Escherichia coli teach me about genome engineering. Genetics. 2009;183:1205–1214. - PMC - PubMed
    1. Schmid MB, Roth JR. Gene location affects expression level in Salmonella typhimurium. J. Bacteriol. 1987;169:2872–2875. - PMC - PubMed
    1. Chandler MG, Pritchard RH. The effect of gene concentration and relative gene dosage on gene output in Escherichia coli. Mol. Gen. Genet. 1975;138:127–141. - PubMed
    1. Sousa C, de Lorenzo V, Cebolla A. Modulation of gene expression through chromosomal positioning in Escherichia coli. Microbiology. 1997;143(Pt 6):2071–2078. - PubMed

Publication types

MeSH terms