. 2012 Jul 20:3:215.
doi: 10.3389/fmicb.2012.00215. eCollection 2012.

Infection of Primary Bovine Macrophages with Mycobacterium avium Subspecies paratuberculosis Suppresses Host Cell Apoptosis

Affiliations

Infection of Primary Bovine Macrophages with Mycobacterium avium Subspecies paratuberculosis Suppresses Host Cell Apoptosis

Edward Kabara et al. Front Microbiol. .

Abstract

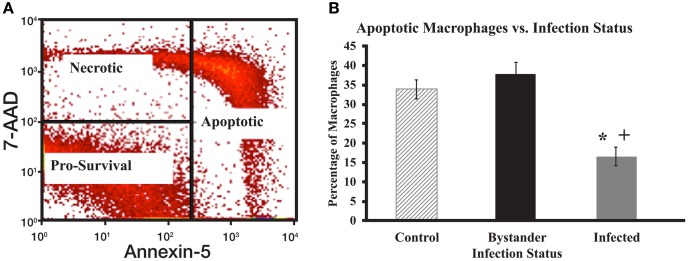
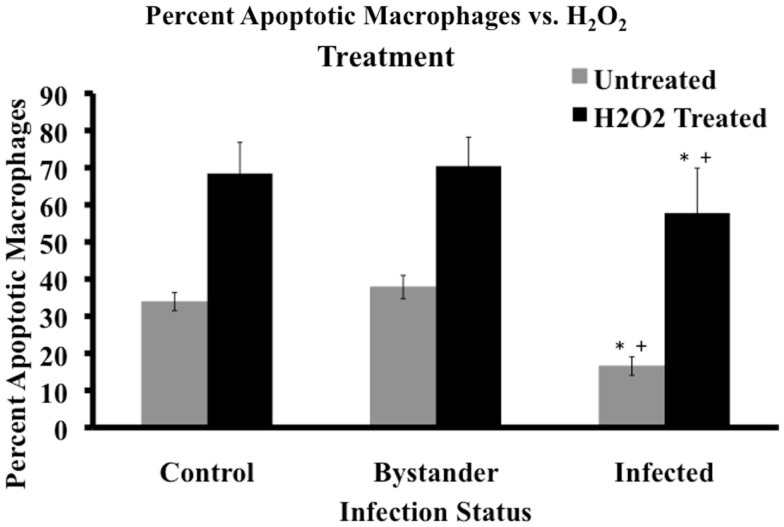
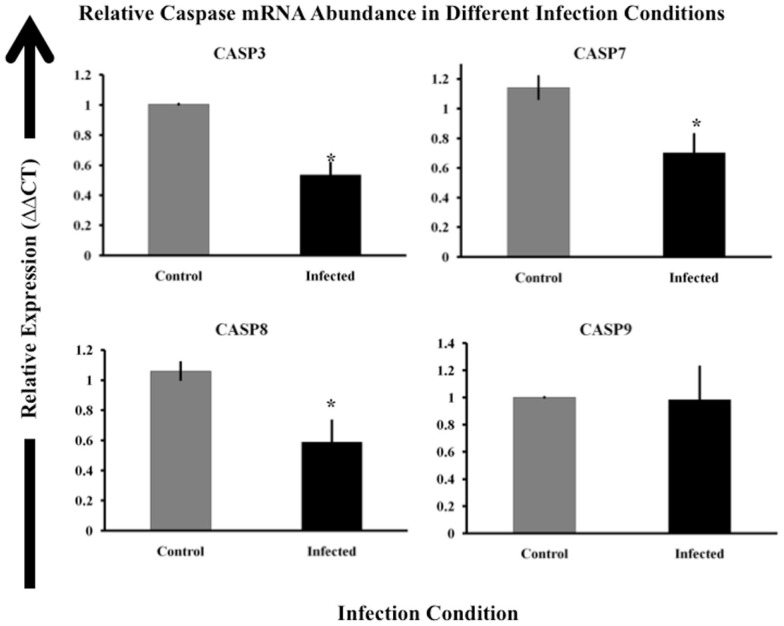
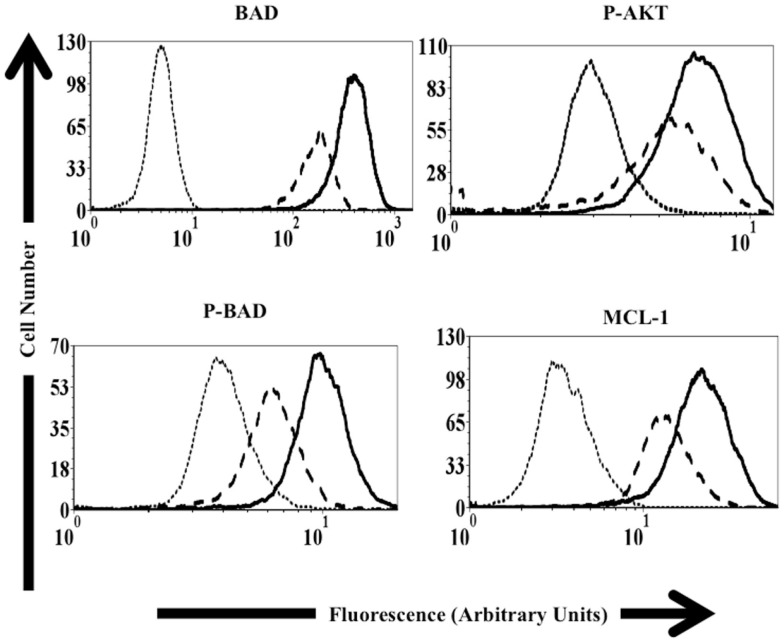
Mycobacterium avium subspecies paratuberculosis (MAP) is able to survive intracellularly in macrophages by preventing normal phagosome maturation processes utilized to destroy bacteria. Infected macrophages often undergo apoptotic cell death to efficiently present bacterial antigens to the host adaptive immune system in a process known as efferocytosis. Recent studies with Mycobacterium tuberculosis (MTB) showed that macrophages infected with MTB are less likely to undergo apoptosis than control, uninfected cells. It is proposed that regulation of macrophage apoptosis is an important immune evasion tactic for MTB. Based on the similarity of MAP and MTB, we hypothesized that MAP-infected macrophages would be resistant to apoptosis compared to uninfected cells within the same culture and to cells from uninfected cultures. Our results demonstrate that, indeed, populations of MAP-infected macrophages contain fewer apoptotic cells than similar populations of control cells, and that MAP infection reduces the sensitivity of infected macrophages to induction of apoptosis by H(2)O(2). We further demonstrate that MAP-infected cells contain reduced caspase activity for caspases 3/7, 8, and 9. Reduced caspase activity in MAP-infected macrophages is also maintained after H(2)O(2) induction. This reduction in caspase activity is accompanied by a pronounced reduction in transcription of caspase genes encoding caspases 3, 7, and 8, but not for caspase 9, when compared to control, uninfected cells. Furthermore, MAP infection drastically effects the expression of several host cell proteins important for regulation of apoptosis. Studies using mutant MAP strains demonstrate the importance of bacterial specific factors in the control of host macrophage apoptosis. Together these data demonstrate that MAP specific factors may prevent caspase activity and caspase gene transcription as well as apoptosis signaling protein expression, resulting in decreased spontaneous host cell apoptosis and decreased sensitivity to apoptosis inducing agents.

Keywords: apoptosis; efferocytosis; paratuberculosis; programmed cell death.


Figures

Figure 1
Figure 1
Apoptotic gating strategy and levels of spontaneous apoptosis in cultured macrophage populations. (A) Cells were initially gated after flow cytometry to focus on live macrophage cells and then according to 7-AAD and Annexin V staining intensity. Cells with strong staining for Annexin-5 were considered early or late apoptotic. For analysis purposes, data from both populations were combined to examine all apoptotic cells [Right rectangle in (A)]. Cells with strong 7-AAD staining, but little Annexin-5 staining were considered necrotic (upper left quadrant). Cells with little staining for either 7-AAD or Annexin V were considered pro-survival (lower left quadrant). (B) The percentage of total apoptotic macrophages was determined by flow cytometry as described for (A). The bars represent mean results obtained from MDM cultures isolated from six individual healthy Holstein cattle. Error bars represent Standard Error of the Mean (SEM) between the six biological replicates. A “+” indicates significantly different from control, uninfected cells at p < 0.05 and a “*” indicates significantly different from the bystander macrophage populations at p < 0.05.
Figure 2
Figure 2
Cell status post apoptotic induction. Percentage of apoptotic macrophages in populations of MAP-infected, bystander, and uninfected control cells was determined by flow cytometry after 20 min of 100 μM H2O2 treatment. Bars represent the average results of MDM cultured from six healthy Holstein cattle. Gray bars represent the percentage of apoptotic cells pre-treatment, while black bars represent the percentage of apoptotic macrophages after treatment in the three cell groups. Error bars represent Standard Error of the mean (SEM) between the six biological replicates. A +indicates significantly different from control, uninfected cells at p < 0.05 and *indicates significantly different from bystander macrophages at p < 0.05.
Figure 3
Figure 3
Caspase 3/7, 8, and 9 activity with and without H2O2 treatment. The percentage of cells with high activity for caspases 3/7, 8, and 9 in various cell populations was determined using flow cytometry, as described in Materials and Methods. Bars represent the average results of MDM cultured from six healthy Holstein cattle. Error bars represent Standard error of the mean (SEM) between the six biological replicates. A +indicates significantly different from control, uninfected cell cultures at p < 0.05 and *indicates significantly different from bystander macrophage populations at p < 0.05. Data in (A) represents the percentage of cells with high caspase activity without any apoptosis induction. (B) Shows the percentage of cells that display high caspase activity after 20 min of exposure to 100 μm H2O2.
Figure 4
Figure 4
Relative expression of caspase genes in control and MAP-infected macrophages. Abundance of mRNA encoding caspases 3, 7, 8, and 9 was determined via RT-qPCR as described in Materials and Methods. The ΔΔCt method was used to determine relative mRNA abundance using beta-actin as the control gene (Livak and Schmittgen, 2001). The uninfected sample (control) is indicated by gray boxes while infected samples are shown as black boxes. Bars represent the average results of MDM cultured from eight healthy Holstein cattle. Error bars represent standard error of the mean (SEM) between the eight biological replicates. Samples marked with a star (*) indicate samples that are significantly different then control samples at p < 0.05.
Figure 5
Figure 5
Protein expression in control and MAP-infected macrophages. Representative histograms used to determine relative protein expression via flow cytometry as described in Materials and Methods. The dotted line represents isotype control samples (Samples exposed to only the secondary antibody). The dashed line represents data from MAP-infected macrophage populations. Solid black lines represent control, uninfected macrophage samples. Samples used to study p-AKT, BAD, and p-BAD were exposed to M-CSF prior to analysis. Samples used to study MCL-1 were exposed to GM-CSF prior to analysis.
Figure 6
Figure 6
Macrophages infected with MAP mutants fail to prevent host cell apoptosis. The percentage of apoptotic macrophages was determined as described in Materials and Methods. Bars represent the average results of MDM cultured from four healthy Holstein cattle. Error bars represent standard error of the mean (SEM) between the four biological replicates. An #indicates significantly different from ATCC#19698 (ATCC)-infected macrophages at p < 0.05 while a *indicates significant difference from control, uninfected macrophages at p < 0.05. The nature of each mutation is presented in Table 2, as described in the text.

Similar articles

Cited by

References

    1. Abramovitch R. B., Martin G. B. (2004). Strategies used by bacterial pathogens to suppress plant defenses. Curr. Opin. Plant Biol. 7, 356–36410.1016/j.pbi.2004.05.002 - DOI - PubMed
    1. Av-Gay Y., Everett M. (2000). The eukaryotic-like Ser/Thr protein kinases of Mycobacterium tuberculosis. Trends Microbiol. 8, 238–24410.1016/S0966-842X(00)01734-0 - DOI - PubMed
    1. Bermudez L. E., Parker A., Petrofsky M. (1999). Apoptosis of Mycobacterium avium-infected macrophages is mediated by both tumour necrosis factor (TNF) and Fas, and involves the activation of caspases. Clin. Exp. Immunol. 116, 94–9910.1046/j.1365-2249.1999.00852.x - DOI - PMC - PubMed
    1. Cadieux N., Parra M., Cohen H., Maric D., Morris S. L., Brennan M. J. (2011). Induction of cell death after localization to the host cell mitochondria by the Mycobacterium tuberculosis PE_PGRS33 protein. Microbiology 157, 793–80410.1099/mic.0.041996-0 - DOI - PMC - PubMed
    1. Chattree V., Khanna N., Bisht V., Rao D. N. (2008). Inhibition of apoptosis, activation of NKT cell and upregulation of CD40 and CD40L mediated by M. leprae antigen(s) combined with Murabutide and Trat peptide in leprosy patients. Mol. Cell. Biochem. 309, 87–9710.1007/s11010-007-9646-8 - DOI - PubMed

LinkOut - more resources