

Mitochondria impairment correlates with increased sensitivity of aging RPE cells to oxidative stress
- PMID: 22833778
- PMCID: PMC3372610
- DOI: 10.1007/s12177-011-9061-y
Mitochondria impairment correlates with increased sensitivity of aging RPE cells to oxidative stress
Abstract
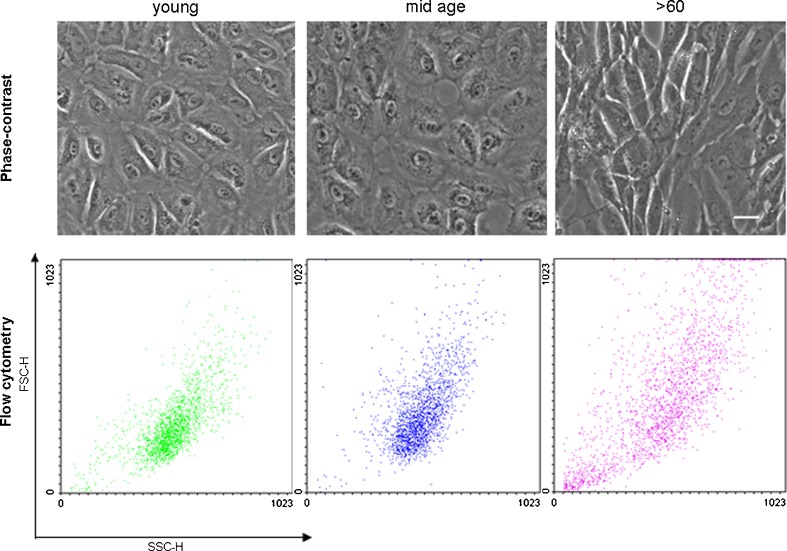
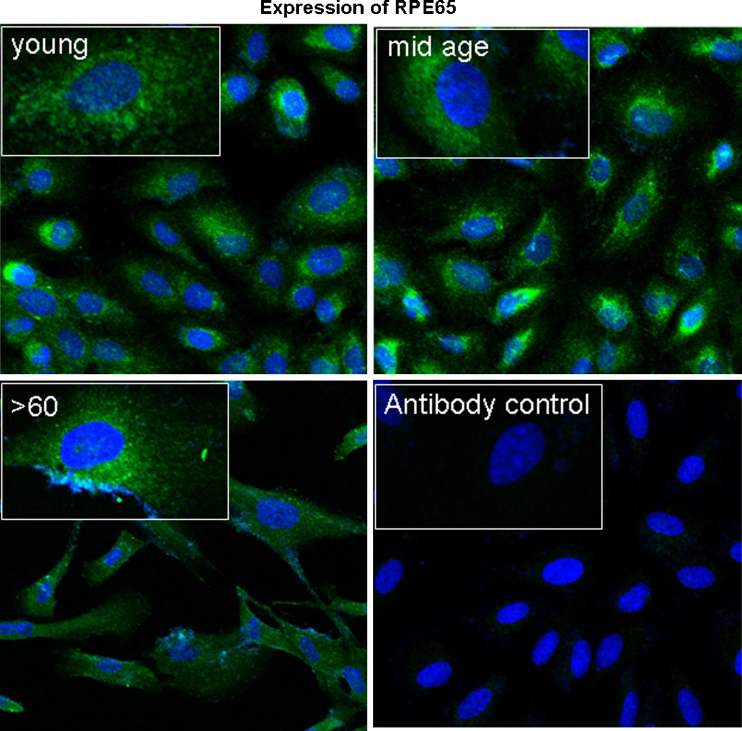
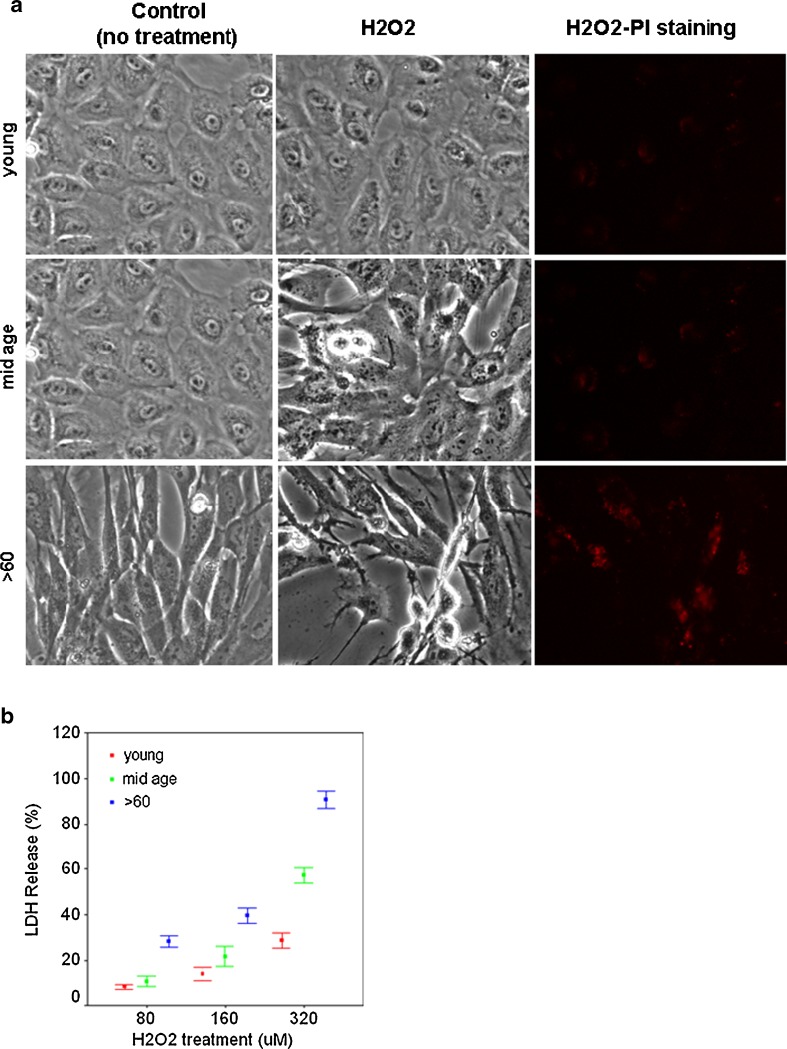
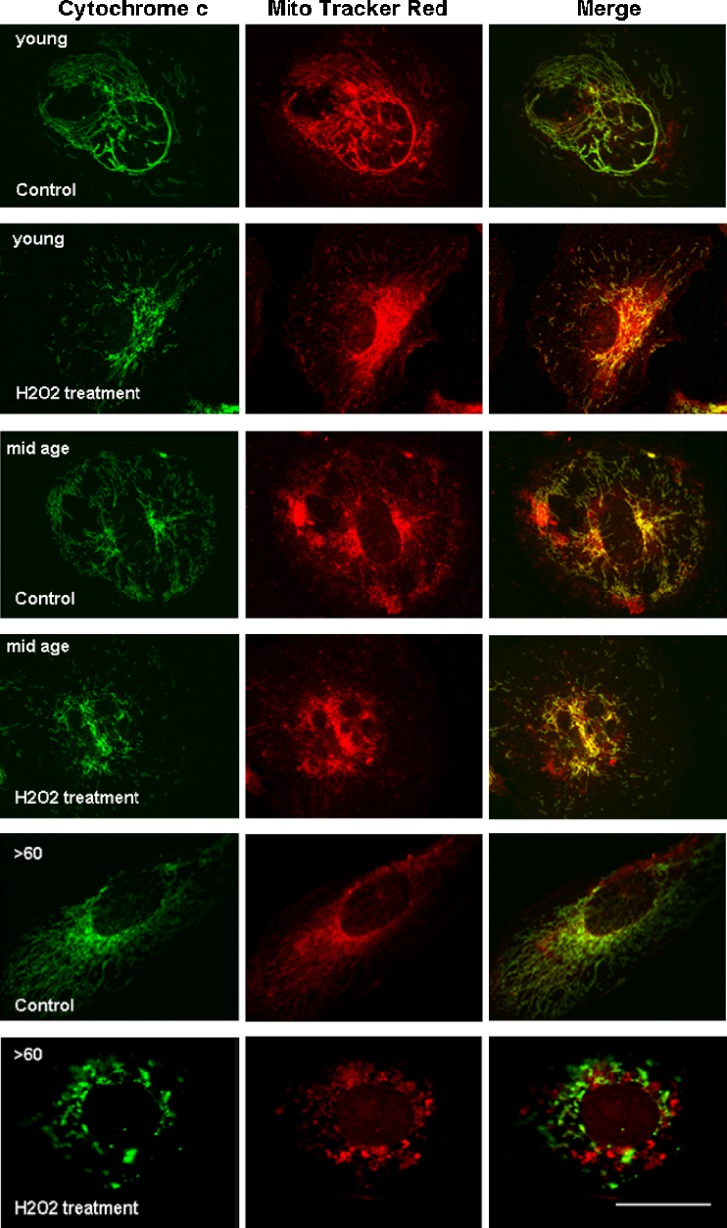
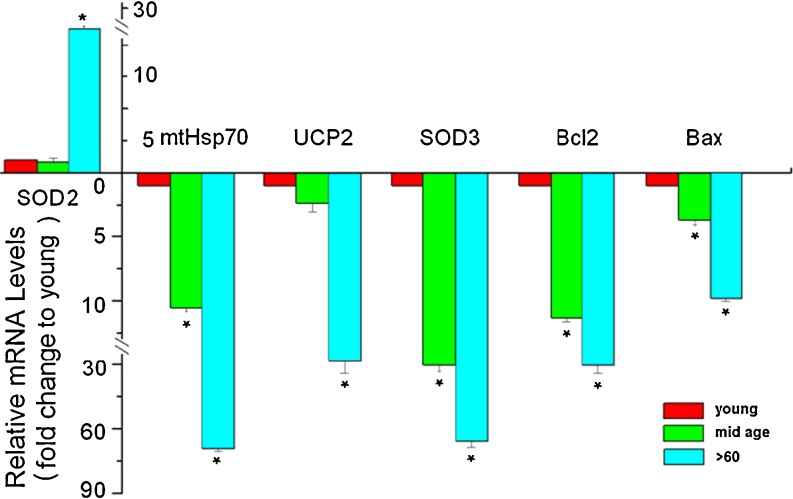
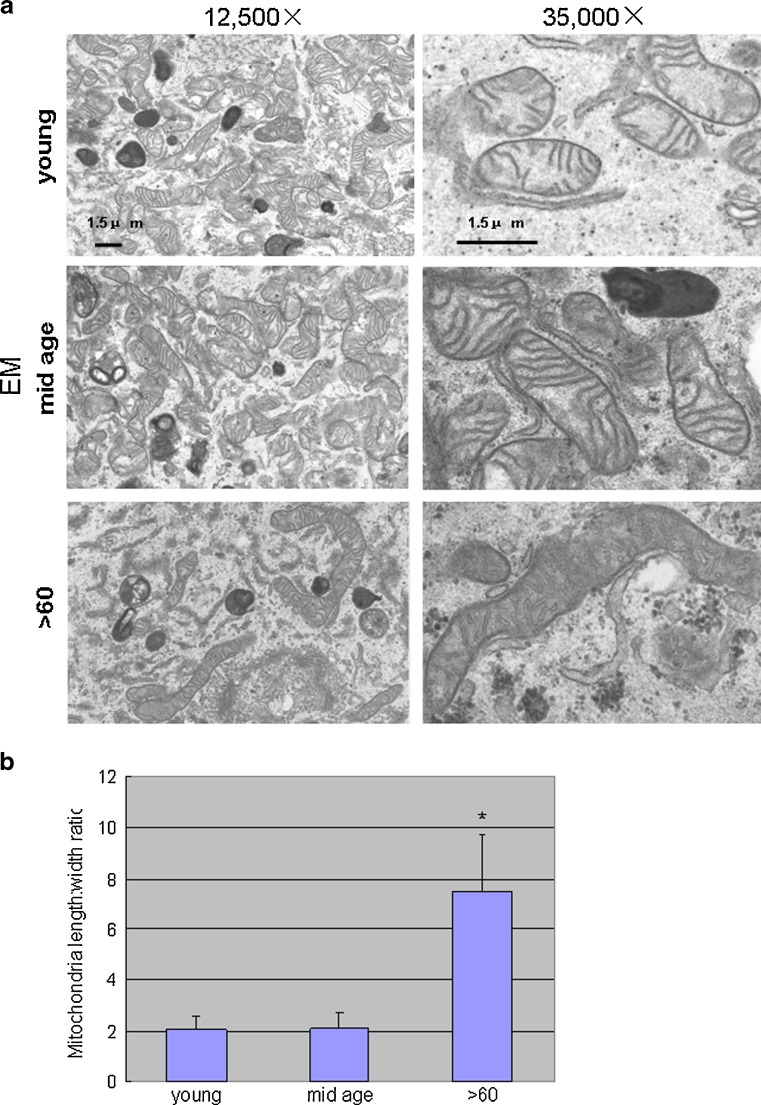
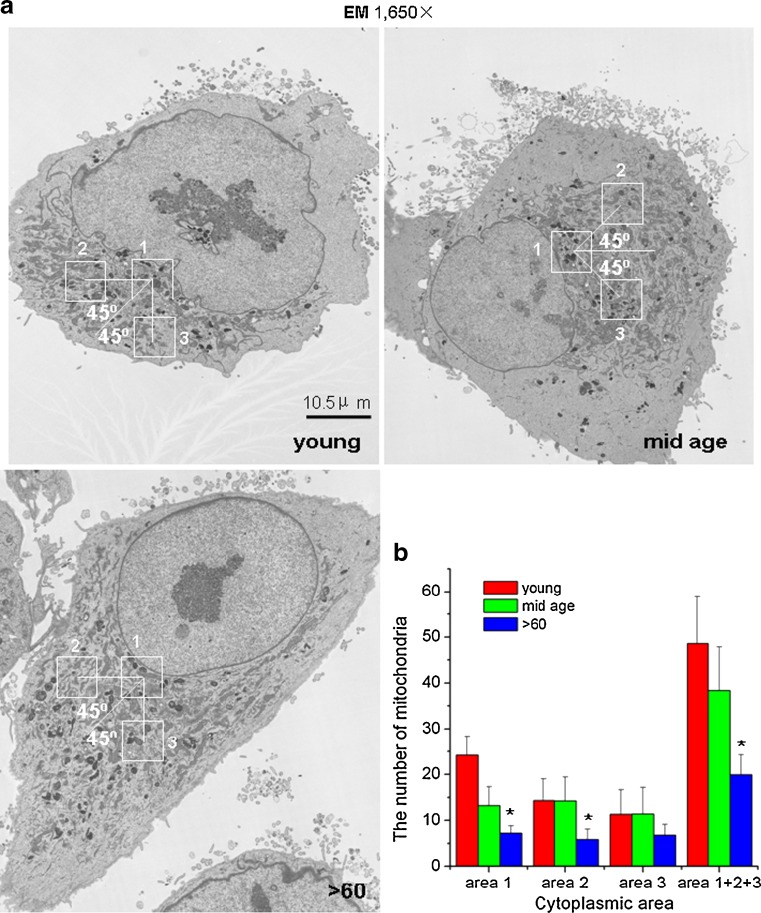
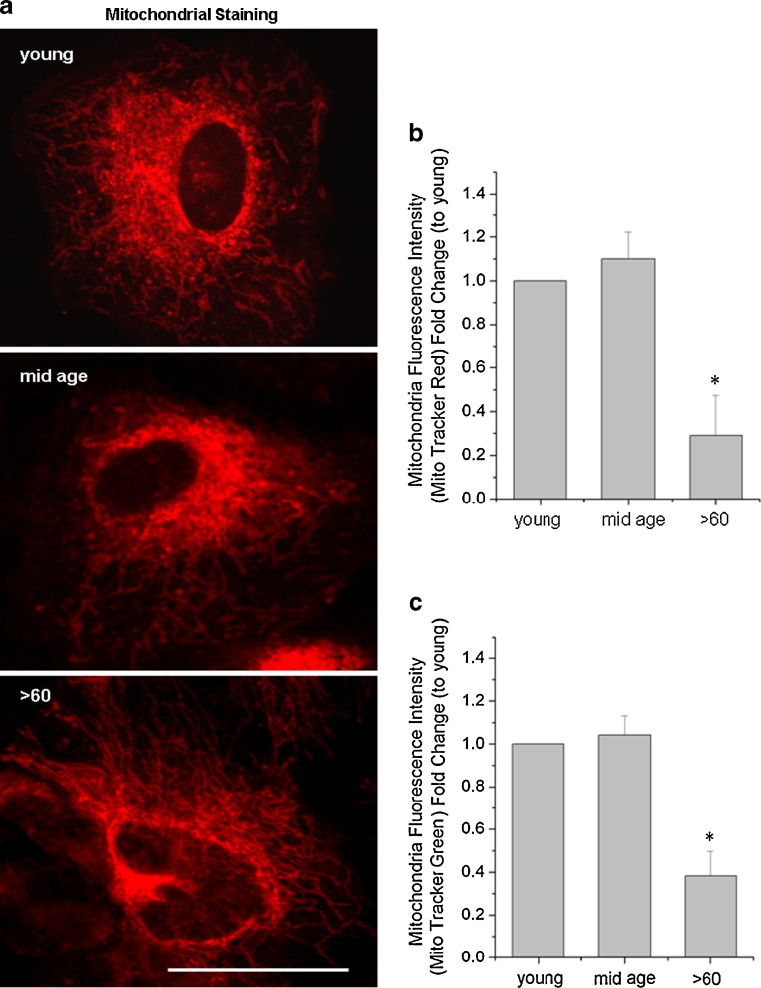
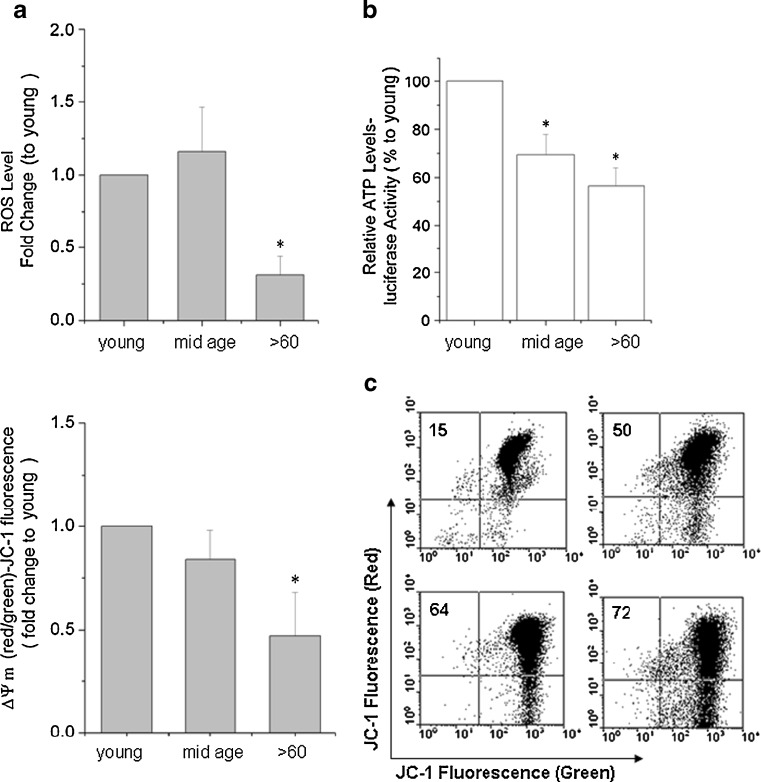
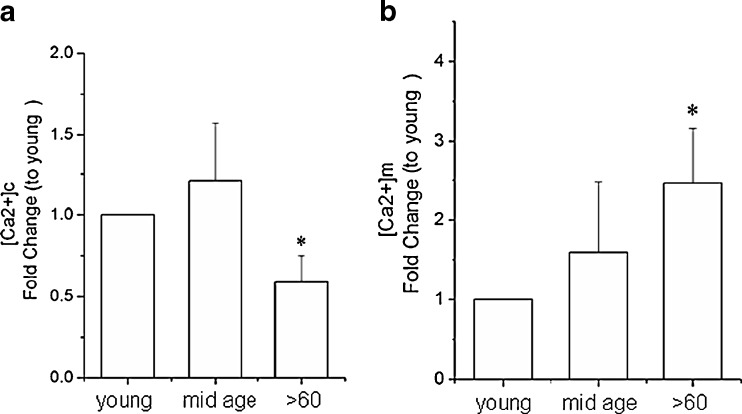
Impairment of mitochondria function and cellular antioxidant systems are linked to aging and neurodegenerative diseases. In the eye, the retinal pigment epithelium (RPE) is exposed to a highly oxidative environment that contributes to age-related visual dysfunction. Here, we examined changes in mitochondrial function in human RPE cells and sensitivity to oxidative stress with increased chronological age. Primary RPE cells from young (9-20)-, mid-age (48-60)-, and >60 (62-76)-year-old donors were grown to confluency and examined by electron microscopy and flow cytometry using several mitochondrial functional assessment tools. Susceptibility of RPE cells to H(2)O(2) toxicity was determined by lactate dehydrogenase and cytochrome c release, as well as propidium iodide staining. Reactive oxygen species, cytoplasmic Ca(2+) [Ca(2+)](c), and mitochondrial Ca(2+) [Ca(2+)](m) levels were measured using 2',7'-dichlorodihydrofluorescein diacetate, fluo-3/AM, and Rhod-2/AM, respectively, adenosine triphosphate (ATP) levels were measured by a luciferin/luciferase-based assay and mitochondrial membrane potential (ΔΨm) estimated using 5,5',6,6'-tetrachloro 1,1'3,3'-tetraethylbenzimid azolocarbocyanine iodide. Expression of mitochondrial and antioxidant genes was determined by real-time polymerase chain reaction. RPE cells show greater sensitivity to oxidative stress, reduction in expression of mitochondrial heat shock protein 70, uncoupling protein 2, and superoxide dismutase 3, and greater expression of superoxide dismutase 2 levels with increased chronological age. Changes in mitochondrial number, size, shape, matrix density, cristae architecture, and membrane integrity were more prominent in samples obtained from >60 years old compared to mid-age and younger donors. These mitochondria abnormalities correlated with lower ATP levels, reduced ΔΨm, decreased [Ca(2+)](c), and increased sequestration of [Ca(2+)](m) in cells with advanced aging. Our study provides evidence for mitochondrial decay, bioenergetic deficiency, weakened antioxidant defenses, and increased sensitivity of RPE cells to oxidative stress with advanced aging. Our findings suggest that with increased severity of mitochondrial decay and oxidative stress, RPE function may be altered in some individuals in a way that makes the retina more susceptible to age-related injury.
Keywords: ATP; Aging; Ca2+; Mitochondria; Mitochondrial membrane potential; Oxidative Stress; RPE cells.
Figures
Similar articles
-
PEDF Prevents Mitochondrial Function Decay and ER Stress Induced by Rotenone in Aging RPE Cells.Front Biosci (Landmark Ed). 2023 Nov 29;28(11):319. doi: 10.31083/j.fbl2811319. Front Biosci (Landmark Ed). 2023. PMID: 38062839
-
Mitochondrial decay and impairment of antioxidant defenses in aging RPE cells.Adv Exp Med Biol. 2010;664:165-83. doi: 10.1007/978-1-4419-1399-9_20. Adv Exp Med Biol. 2010. PMID: 20238015
-
PEDF improves mitochondrial function in RPE cells during oxidative stress.Invest Ophthalmol Vis Sci. 2014 Sep 11;55(10):6742-55. doi: 10.1167/iovs.14-14696. Invest Ophthalmol Vis Sci. 2014. PMID: 25212780
-
Respiratory function decline and DNA mutation in mitochondria, oxidative stress and altered gene expression during aging.Chang Gung Med J. 2009 Mar-Apr;32(2):113-32. Chang Gung Med J. 2009. PMID: 19403001 Review.
-
Oxidative stress-induced mitochondrial DNA damage in human retinal pigment epithelial cells: a possible mechanism for RPE aging and age-related macular degeneration.Exp Eye Res. 2003 Apr;76(4):397-403. doi: 10.1016/s0014-4835(03)00023-x. Exp Eye Res. 2003. PMID: 12634104 Review.
Cited by
-
Eye on the horizon: The metabolic landscape of the RPE in aging and disease.Prog Retin Eye Res. 2025 Jan;104:101306. doi: 10.1016/j.preteyeres.2024.101306. Epub 2024 Oct 19. Prog Retin Eye Res. 2025. PMID: 39433211 Free PMC article. Review.
-
A mitochondrial therapeutic reverses visual decline in mouse models of diabetes.Dis Model Mech. 2015 Jul 1;8(7):701-10. doi: 10.1242/dmm.020248. Epub 2015 Apr 23. Dis Model Mech. 2015. PMID: 26035391 Free PMC article.
-
Mitochondrial network responses in oxidative physiology and disease.Free Radic Biol Med. 2018 Feb 20;116:31-40. doi: 10.1016/j.freeradbiomed.2018.01.005. Epub 2018 Jan 6. Free Radic Biol Med. 2018. PMID: 29317273 Free PMC article. Review.
-
Human iPSC disease modelling reveals functional and structural defects in retinal pigment epithelial cells harbouring the m.3243A > G mitochondrial DNA mutation.Sci Rep. 2017 Sep 26;7(1):12320. doi: 10.1038/s41598-017-12396-2. Sci Rep. 2017. PMID: 28951556 Free PMC article.
-
Molecular Network Mechanism Analysis of Urine Stem Cells Against Retinal Aging.Biochem Genet. 2024 Oct;62(5):4046-4066. doi: 10.1007/s10528-023-10487-6. Epub 2024 Jan 25. Biochem Genet. 2024. PMID: 38273154
References
Grants and funding
LinkOut - more resources
Full Text Sources
Miscellaneous