. 2012 Nov;26(11):4722-32.
doi: 10.1096/fj.12-206060. Epub 2012 Jul 26.

T lymphocytes from patients with systemic lupus erythematosus are resistant to induction of autophagy

Affiliations

T lymphocytes from patients with systemic lupus erythematosus are resistant to induction of autophagy

Cristiano Alessandri et al. FASEB J. 2012 Nov.

Abstract

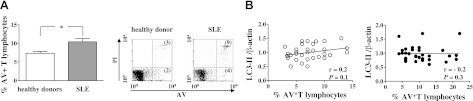
Autophagy, the cytoprotection mechanism that takes place under metabolic impairment, has been implicated in the pathogenesis of autoimmunity. Here, we investigated the spontaneous and induced autophagic behavior of T lymphocytes from patients with systemic lupus erythematosus (SLE) compared with that of T lymphocytes from healthy donors by measuring the autophagy marker microtubule-associated protein 1 light chain 3 (LC3)-II. No significant differences in spontaneous autophagy were found between T lymphocytes from patients with SLE and from healthy donors, apart from CD4(+) naive T cells from patients with SLE in which constitutively higher levels of autophagy (P<0.001) were detected. At variance, whereas treatment of T lymphocytes from healthy donors with serum IgG from patients with SLE resulted in a 2-fold increase in LC3-II levels (P<0.001), T lymphocytes from SLE patients were resistant to autophagic induction and also displayed an up-regulation of genes negatively regulating autophagy, e.g., α-synuclein. These findings could open new perspectives in the search for pathogenetic determinants of SLE progression and in the development of therapeutic strategies aimed to recover T-cell compartment homeostasis by restoring autophagic susceptibility.


Figures

Figure 1.
Figure 1.
Flow cytometric immunophenotyping and Western blot analysis of the autophagy marker LC3-II in freshly isolated T cells from patients with SLE and from healthy donors. A) Flow cytometry analysis of distribution of T-cell subsets. Data are represented as box plots (white and gray box plots for healthy donors and patients with SLE, respectively) displaying medians, 25th and 75th percentiles as boxes, and 10th and 90th percentiles as whiskers. *P < 0.05 vs. normal cells. B) LC3-II Western blot analysis of T-cell lysates (30 μg/lane) from 6 healthy donors and from 6 patients with SLE. Blots shown are representative of independent experiments performed in T cells from healthy donors (n=34) and from patients with SLE (n=34). Quantification of LC3-II levels relative to β-actin in normal and SLE T cells is also shown (mean with range is presented). C) LC3-II Western blot analysis of cell lysates obtained from purified CD4+ and CD8+ naive and memory T lymphocytes. Blots shown are representative of independent experiments performed in T cells from 10 healthy donors and from 10 patients with SLE, arbitrarily chosen as representative of the whole series. Densitometry analysis of LC3-II levels relative to β-actin is also shown. Values are expressed as means ± sd. *P < 0.05.
Figure 2.
Figure 2.
Apoptosis detection in freshly isolated T cells from patients with SLE and from healthy donors. A) Flow cytometry analysis of lymphocyte apoptosis. Data are referred to AV-positive cells and are presented as means ± sd of independent experiments performed in T lymphocytes from healthy donors (n=34) and from patients with SLE (n=34). *P < 0.05. Representative dot plots of flow cytometry analysis (PI on y axis vs. AV on x axis) are also shown. Numbers reported in bottom and top right quadrants represent percentages of AV single-positive cells and AV/PI double-positive cells, respectively. B) Correlation and linear regression analysis of apoptosis and LC3-II levels in T cells from healthy donors (○) and patients with SLE (●).
Figure 3.
Figure 3.
Effects of sera from patients with SLE on T-lymphocyte autophagy and apoptosis. A) LC3-II Western blot analysis of T-cell lysates (30 μg/lane) from one representative healthy donor (of the 34 analyzed). Densitometry analysis of LC3-II levels relative to β-actin is also shown. Values are expressed as means ± sd. Where indicated, cells were treated with the lysosomal inhibitors E64d and pepstatin A (Pep A). Statistically significant differences are indicated. B) LC3-II Western blot analysis of T-cell lysates from 3 representative patients with SLE (of the 34 analyzed). Densitometry analysis of LC3-II levels relative to β-actin is also shown. Values are expressed as means ± sd. C) Flow cytometry analysis of lymphocyte apoptosis. Data are referred to AV-positive apoptotic cells and are expressed as the mean ± sd of independent experiments performed in T cells from patients with SLE (n=34) and from healthy donors (n=34). Representative dot plots of flow cytometry analysis (PI on y axis vs. AV on x axis) are also shown. Numbers reported in bottom and top right quadrants represent percentages of AV single-positive cells and AV/PI double-positive cells, respectively. D) LC3-II Western blot analysis of T-cell lysates from one representative healthy donor (of 10 analyzed) after treatment with normal serum, IgG from serum of patients with SLE (50 μg/ml), serum of patients with SLE without IgG, and IVIG (50 μg/ml). Densitometry analysis of LC3-II levels relative to β-actin is also shown. Values are expressed as means ± sd. Statistically significant differences are indicated in the figure. E) Reactivity of human IgG purified from healthy donors (dotted line) and from sera of patients with SLE (black line) on lymphocyte surface. A representative histogram plot of flow cytometry analysis is shown.
Figure 4.
Figure 4.
Susceptibility of T lymphocytes to proautophagic stimuli. A) LC3-II Western blot analysis of T-cell lysates (30 μg/lane) from one healthy donor and from one patient with SLE after treatment with 10 or 1% FBS for 4 h. Blots shown are representative of independent experiments performed in T cells from 10 healthy donors and from 10 patients with SLE, arbitrarily chosen as representative of the whole series. Densitometry analysis of LC3-II levels relative to β-actin is also shown. Values are expressed as means ± sd. Statistically significant differences are indicated. B) LC3-II Western blot analysis of T-cell lysates from one healthy donor and from one patient with RA after treatment with normal serum or RA serum for 48 h. Blots shown are representative of independent experiments performed in T cells from 5 healthy donors and from 5 patients with RA. Densitometry analysis of LC3-II levels relative to β-actin is also shown. Values are expressed as means ± sd. Statistically significant differences are indicated in the figure. C) LC3-II Western blot analysis of T-cell lysates from one healthy donor and from one patient with RA after treatment with 10 or 1% FBS for 4 h. Blots shown are representative of independent experiments performed in T cells from 5 healthy donors and from 5 patients with RA. Densitometry analysis of LC3-II levels relative to β-actin is also shown. Values are expressed as means ± sd. Statistically significant differences are indicated.

References

    1. Crispin J. C., Liossis S. N., Kis-Toth K., Lieberman L. A., Kyttaris V. C., Juang Y. T., Tsokos G. C. (2010) Pathogenesis of human systemic lupus erythematosus: recent advances. Trends Mol. Med. 16, 47–57 - PMC - PubMed
    1. Fernandez D., Perl A. (2010) mTOR signaling: a central pathway to pathogenesis in systemic lupus erythematosus? Discov. Med. 9, 173–178 - PMC - PubMed
    1. Moulton V. R., Tsokos G. C. (2011) Abnormalities of T cell signaling in systemic lupus erythematosus. Arthritis Res. Ther. 13, 207. - PMC - PubMed
    1. Krammer P. H., Arnold R., Lavrik I. N. (2007) Life and death in peripheral T cells. Nat. Rev. Immunol. 7, 532–542 - PubMed
    1. Emlen W., Niebur J., Kadera R. (1994) Accelerated in vitro apoptosis of lymphocytes from patients with systemic lupus erythematosus. J. Immunol. 152, 3685–3692 - PubMed

Publication types