

doi: 10.1038/ng.2355.
Leveraging models of cell regulation and GWAS data in integrative network-based association studies
Affiliations
- PMID: 22836096
- PMCID: PMC3593099
- DOI: 10.1038/ng.2355
Item in Clipboard
Leveraging models of cell regulation and GWAS data in integrative network-based association studies
Nat Genet.
.
No abstract available
Conflict of interest statement
The authors declare no competing financial interests.
Figures
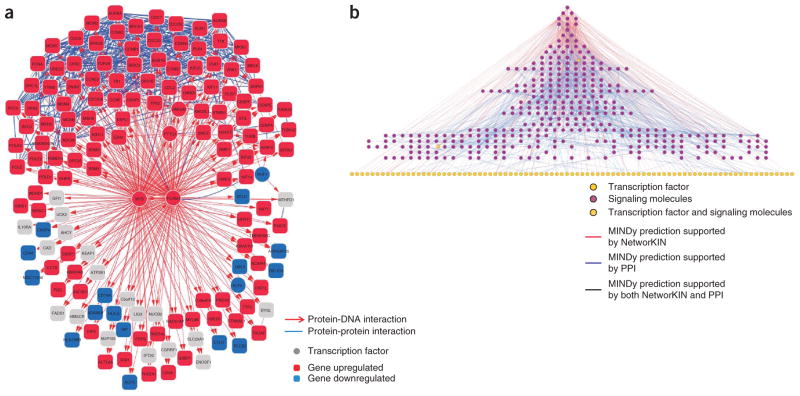
Examples of transcriptional and post-translational regulatory networks in human B cells. (a) FOXM1 and MYB co-regulation network from the Human B Cell Interactome. Red and blue represent over- and underexpression of genes, respectively, in centroblast versus naïve germinal centers (t test, false discovery rate < 0.05). Blue arcs represent protein-protein interactions. Adapted from reference . (b) Visualization of the molecular interaction network of signaling molecules and transcription factors in mature human B cells. Adapted from reference .
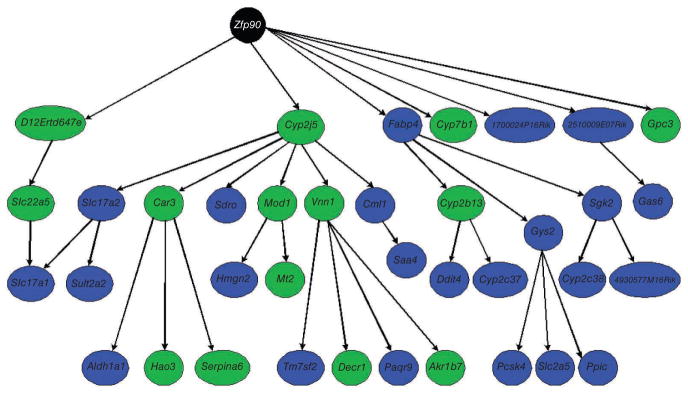
Genetic subnetwork controlled by Zfp90 (black node) as a central node in the liver transcriptional network. This subnetwork was obtained from a full liver expression network by identifying all nodes that were downstream of the Zpf90 node, within a path length of 3. Nodes highlighted in green represent genes that were validated as causal for fat mass. Adapted from ref. .
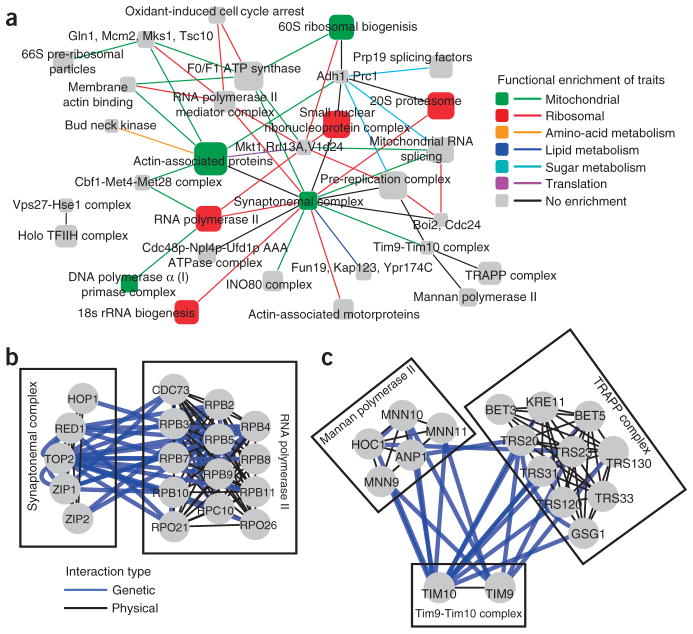
Genetic networks extracted from GWAS elucidate pathway architecture. (a) A global map of the top GWAS genetic interactions between protein interaction complexes. Each node represents a protein complex, and each interaction represents a significant number of genetic interactions. Node sizes are proportional to the number of proteins in the complex. (b,c) Genetic interactions mined from GWAS data are shown in greater detail for the interaction between the synaptonemal complex and the RNA polymerase II complex (b) and the interaction between the mannan polymerase II complex, the TIM9-TIM10 complex and the TRAPP complex (c). Adapted from ref. .
References
Publication types
MeSH terms
Grants and funding
LinkOut - more resources
Full Text Sources
Other Literature Sources
