. 2012 Jul 26;7(8):1534-50.
doi: 10.1038/nprot.2012.086.

The ribosome profiling strategy for monitoring translation in vivo by deep sequencing of ribosome-protected mRNA fragments

Affiliations

The ribosome profiling strategy for monitoring translation in vivo by deep sequencing of ribosome-protected mRNA fragments

Nicholas T Ingolia et al. Nat Protoc. .

Abstract

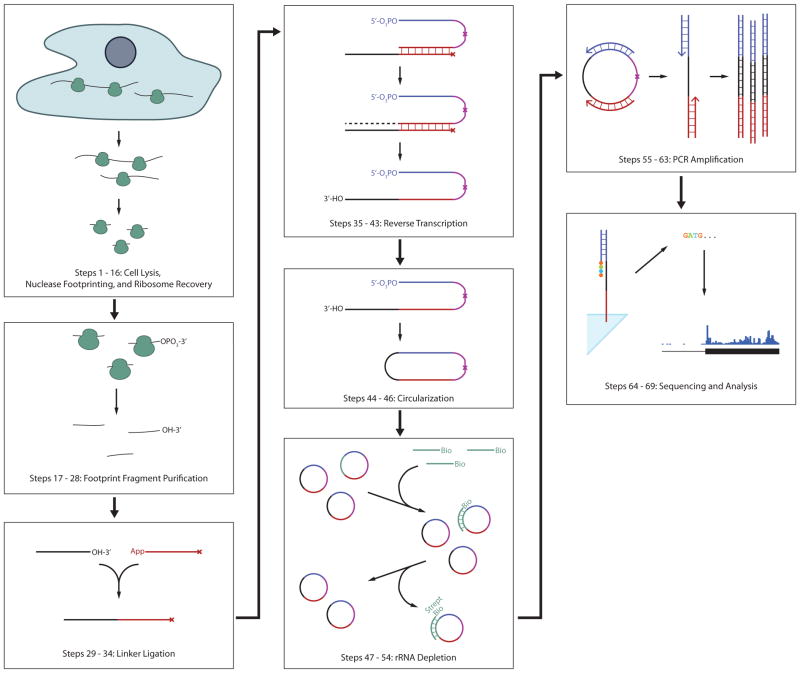
Recent studies highlight the importance of translational control in determining protein abundance, underscoring the value of measuring gene expression at the level of translation. We present a protocol for genome-wide, quantitative analysis of in vivo translation by deep sequencing. This ribosome profiling approach maps the exact positions of ribosomes on transcripts by nuclease footprinting. The nuclease-protected mRNA fragments are converted into a DNA library suitable for deep sequencing using a strategy that minimizes bias. The abundance of different footprint fragments in deep sequencing data reports on the amount of translation of a gene. In addition, footprints reveal the exact regions of the transcriptome that are translated. To better define translated reading frames, we describe an adaptation that reveals the sites of translation initiation by pretreating cells with harringtonine to immobilize initiating ribosomes. The protocol we describe requires 5-7 days to generate a completed ribosome profiling sequencing library. Sequencing and data analysis require a further 4-5 days.


Conflict of interest statement

COMPETING FINANCIAL INTERESTS

The authors declare competing financial interests (see the HTML version of this article for details).

Figures

Figure 1
Figure 1
Overview of the ribosome profiling protocol.
Figure 2
Figure 2
Buffer conditions affect footprint precision but not expression measurements. (a) Length distribution of ribosome footprints obtained from nuclease digestion in different buffer conditions, as indicated. (b) Expression measurements (average footprint density across each message) by ribosome profiling in different buffer conditions. Each point on the scatter plot represents a human gene, and the expression shown on the two axes is the total number of ribosome footprints in each sample that aligned to the canonical isoform of the gene, excluding those mapping to the first 15 or last 5 codons, where drug treatment distorts ribosome occupancy. The histogram shows the distribution of log2 ratios between medium and low salt/magnesium buffer conditions for genes with at least 200 total footprints in the two measurements. This criterion avoids low-expression genes where statistical sampling error dominates inter-replicate differences. (c) Sub-codon position of ribosome footprint 5′ termini, obtained by nuclease digestion in different buffer conditions, as indicated. Reads that aligned with the annotated CDS of canonical transcripts in the UCSC Known Genes dataset were used, and the position of their 5′ terminus was determined relative to codon boundaries in this CDS. (d) Conditional entropy of the ribosome footprint length and reading-frame position distribution in different samples.
Figure 3
Figure 3
Overview of ribosome footpring sequence pre-processing and alignment.
Figure 4
Figure 4
Representative gels from intermediate product purification. (a) Size selection of ribosome footprint fragments. The footprinting samples are derived from HeLa lysates with 5–15 ug input RNA. The blue bracket indicates the gel region that should be excised. (b) Purification of ligation products. Two marker samples are shown, one of which contains only the lower and upper marker oligonucleotides, the other of which was produced by carrying forward the markers from the size selection gel through dephosphorylation and ligation. The blue bracket indicates the gel region that should be excised. The blue arrowhead indicates the unreacted linker. (c) Purification of reverse transcription products. The blue bracket indicates the gel band that should be excised. The blue arrowhead indicates the unextended RT primer, which should be avoided. (d) Purification of PCR products. The blue bracket indicates the ~175 nt product band that should be purified. The blue arrowhead indicates the ~145 nt background band derived from unextended RT primer that should be avoided. The blue asterisk indicates the partial duplexes resulting from re-annealing as the PCR amplification approaches saturation. (e) BioAnalyzer profile of a high-quality sequencing library. A single 176 nt peak is present. (f) BioAnalyzer profile of a sequencing library with significant background from unextended RT primer. The background manifests as smaller DNA fragments that comprise 5–10% of the total DNA present in the sample; completely unextended RT primer yields a 144 bp PCR product. The DNA in this peak will produce sequencing data, but the sequence will consist of the linker sequence with no footprint.

References

    1. Brown PO, Botstein D. Exploring the new world of the genome with DNA microarrays. Nat Genet. 1999;21:33–7. - PubMed
    1. Mortazavi A, Williams BA, McCue K, Schaeffer L, Wold B. Mapping and quantifying mammalian transcriptomes by RNA-Seq. Nat Methods. 2008;5:621–8. - PubMed
    1. Nagalakshmi U, et al. The transcriptional landscape of the yeast genome defined by RNA sequencing. Science. 2008;320:1344–9. - PMC - PubMed
    1. Ghaemmaghami S, et al. Global analysis of protein expression in yeast. Nature. 2003;425:737–41. - PubMed
    1. Lu P, Vogel C, Wang R, Yao X, Marcotte EM. Absolute protein expression profiling estimates the relative contributions of transcriptional and translational regulation. Nat Biotechnol. 2007;25:117–24. - PubMed

Publication types

Associated data