. 2012 Jul 25;32(30):10183-91.
doi: 10.1523/JNEUROSCI.1020-12.2012.

Intrinsic organization of the anesthetized brain

Affiliations

Intrinsic organization of the anesthetized brain

Zhifeng Liang et al. J Neurosci. .

Abstract

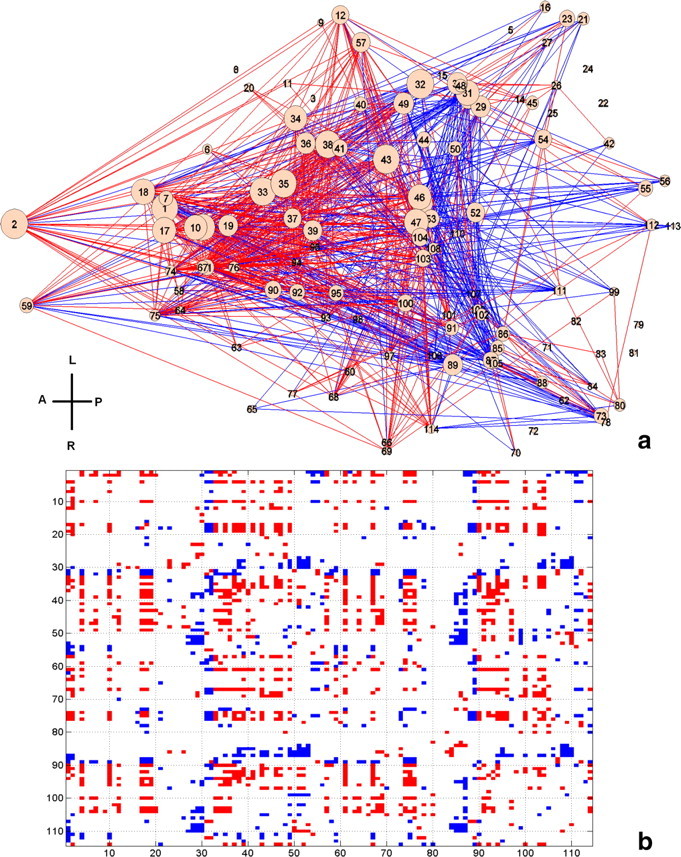
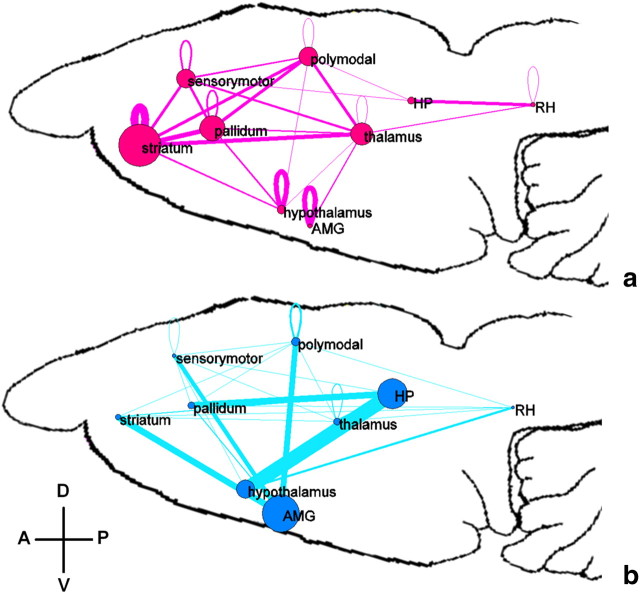
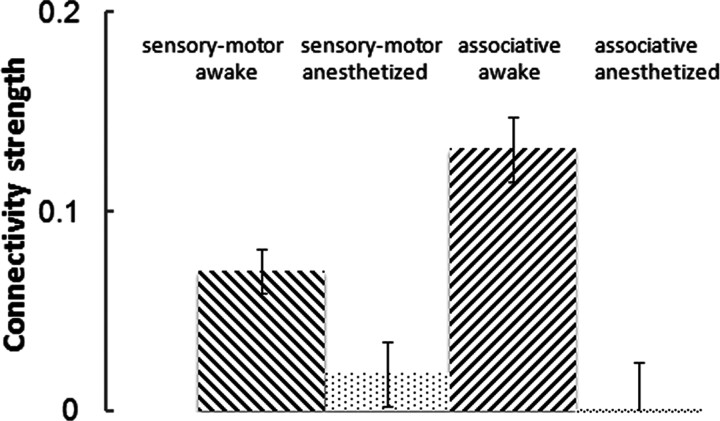
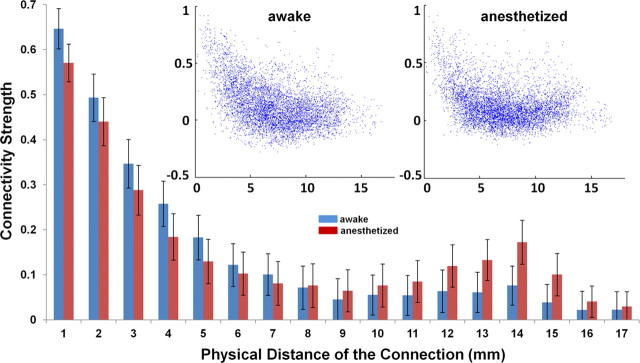
The neural mechanism of unconsciousness has been a major unsolved question in neuroscience despite its vital role in brain states like coma and anesthesia. The existing literature suggests that neural connections, information integration, and conscious states are closely related. Indeed, alterations in several important neural circuitries and networks during unconscious conditions have been reported. However, how the whole-brain network is topologically reorganized to support different patterns of information transfer during unconscious states remains unknown. Here we directly compared whole-brain neural networks in awake and anesthetized states in rodents. Consistent with our previous report, the awake rat brain was organized in a nontrivial manner and conserved fundamental topological properties in a way similar to the human brain. Strikingly, these topological features were well maintained in the anesthetized brain. Local neural networks in the anesthetized brain were reorganized with altered local network properties. The connectional strength between brain regions was also considerably different between the awake and anesthetized conditions. Interestingly, we found that long-distance connections were not preferentially reduced in the anesthetized condition, arguing against the hypothesis that loss of long-distance connections is characteristic to unconsciousness. These findings collectively show that the integrity of the whole-brain network can be conserved between widely dissimilar physiologic states while local neural networks can flexibly adapt to new conditions. They also illustrate that the governing principles of intrinsic brain organization might represent fundamental characteristics of the healthy brain. With the unique spatial and temporal scales of resting-state fMRI, this study has opened a new avenue for understanding the neural mechanism of (un)consciousness.


Figures

Figure 1.
Figure 1.
Parcellation scheme of the rat brain. Colored regions represent anatomically parcellated ROIs overlaid on anatomical images. Distance to bregma (in mm) is labeled at the bottom of each slice.
Figure 2.
Figure 2.
a–d, Consistent global topological features including global clustering coefficients (a; p = 0.18), mean shortest path lengths (b; p = 0.34), small-worldness (c; p = 0.25), and modularity (d; p = 0.32) during the awake and anesthetized states. Error bars indicate SEM. The difference between the awake and anesthetized states was evaluated by using nonparametric permutation test. Statistical significance was thresholded at p < 0.05.
Figure 3.
Figure 3.
a, b, Community structures in the awake (a) and anesthetized (b) conditions. ROIs with the same color are within the same module. ROIs without the annotation of “L” or “R” suggest the modules include bilateral sides. L, Left; R, right; A, anterior; P, posterior; V, ventral; D, dorsal. See Table 1 for the list of abbreviations of brain regions.
Figure 4.
Figure 4.
a, b, Histograms of functional connectivity strength in awake (a) and anesthetized (b) conditions. The connectivity strength was, on average, significantly weaker in the anesthetized condition (two-sample t test, p < 10−10).
Figure 5.
Figure 5.
a, Significantly changed functional connectivity (p < 0.05, FDR corrected) displayed in the dorsal view of the rat brain. Each node represents an anatomical region listed in Table 1. Red (blue) lines indicate connections with significantly stronger (weaker) connectivity in the awake condition. The size of each node is proportional to the number of altered connections for this node. b, Matrix representation of a. Red (blue) elements are connections with significantly stronger (weaker) connectivity strength in the awake condition. A, Anterior; P, posterior; V, ventral; D, dorsal. The numbers on the x- and y-axes are the ROI numbers listed in Table 1.
Figure 6.
Figure 6.
a, b, Significantly decreased (a) and increased (b) functional connectivity during the anesthetized state. ROIs of the whole brain were divided into nine major functional–anatomical groups (Table 3) based on the Swanson Atlas (Swanson, 2004). The weight of edges in both graphs was proportional to the percentage of the total number of significantly changed connections relative to the total number of all possible connections between the two groups. The node size was proportional to the percentage of the total number of significantly changed connections within the group divided by the total number of all possible connections within the group. A, Anterior; P, posterior; V, ventral; D, dorsal. See Table 3 for the list of abbreviations of nine anatomica—functional systems.
Figure 7.
Figure 7.
Connectivity strength changes in thalamocortical connections between the awake and anesthetized conditions. The thalamus was segregated into seven nuclei. Among these nuclei, medial geniculate complex, lateral geniculate complex, and ventral nuclei are related to low-level sensory-motor cortices; anterior nuclei, lateral nuclei, medial nuclei, and midline group are related to high-level associative cortices (Swanson, 2004). Sensory-motor is FC between sensory-motor cortices and thalamic nuclei related to sensory-motor cortices. Associative is FC between associative cortices and thalamic nuclei related to associative cortices. ANOVA analysis with factors thalamic nuclei (sensory-motor/associative) and condition (awake/anesthetized): nuclei: p = 0.2; condition: p < 0.0001; interaction: p = 0.022.
Figure 8.
Figure 8.
Connectivity strength as a function of physical distance. Anesthesia does not preferentially reduce long-distance functional connections. Bars are SEM. Insert, Scatter plots of functional connectivity strength versus physical distance. Left, Awake state. Right, Anesthetized state; x-axis, physical distance of the functional connection (in mm); y-axis, connectivity strength.

References

    1. Alkire MT, Hudetz AG, Tononi G. Consciousness and anesthesia. Science. 2008;322:876–880. - PMC - PubMed
    1. Barash PG, Cullen BF, Stoelting RK, Cahalan M, Stock MC. Clinical anesthesia. 6 edition. Philadelphia: Lippincott Williams and Wilkins; 2009.
    1. Bassett DS, Bullmore ET. Human brain networks in health and disease. Curr Opin Neurol. 2009;22:340–347. - PMC - PubMed
    1. Boly M, Tshibanda L, Vanhaudenhuyse A, Noirhomme Q, Schnakers C, Ledoux D, Boveroux P, Garweg C, Lambermont B, Phillips C, Luxen A, Moonen G, Bassetti C, Maquet P, Laureys S. Functional connectivity in the default network during resting state is preserved in a vegetative but not in a brain dead patient. Hum Brain Mapp. 2009;30:2393–2400. - PMC - PubMed
    1. Boveroux P, Vanhaudenhuyse A, Bruno MA, Noirhomme Q, Lauwick S, Luxen A, Degueldre C, Plenevaux A, Schnakers C, Phillips C, Brichant JF, Bonhomme V, Maquet P, Greicius MD, Laureys S, Boly M. Breakdown of within- and between-network resting state functional magnetic resonance imaging connectivity during propofol-induced loss of consciousness. Anesthesiology. 2010;113:1038–1053. - PubMed

Publication types