. 2012 Jul 25;32(30):10318-30.
doi: 10.1523/JNEUROSCI.1801-12.2012.

Regionally distinct processing of rewards and punishments by the primate ventromedial prefrontal cortex

Affiliations

Regionally distinct processing of rewards and punishments by the primate ventromedial prefrontal cortex

Ilya E Monosov et al. J Neurosci. .

Abstract

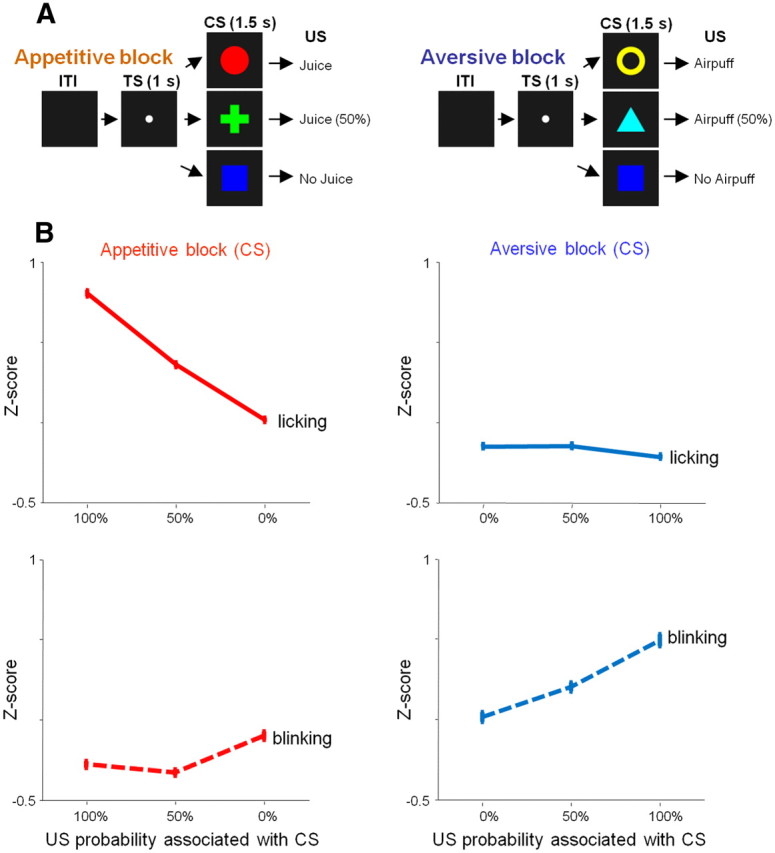
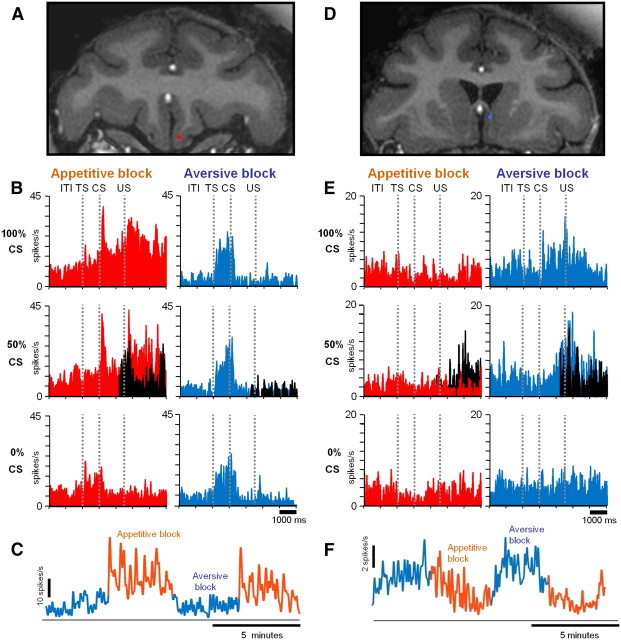
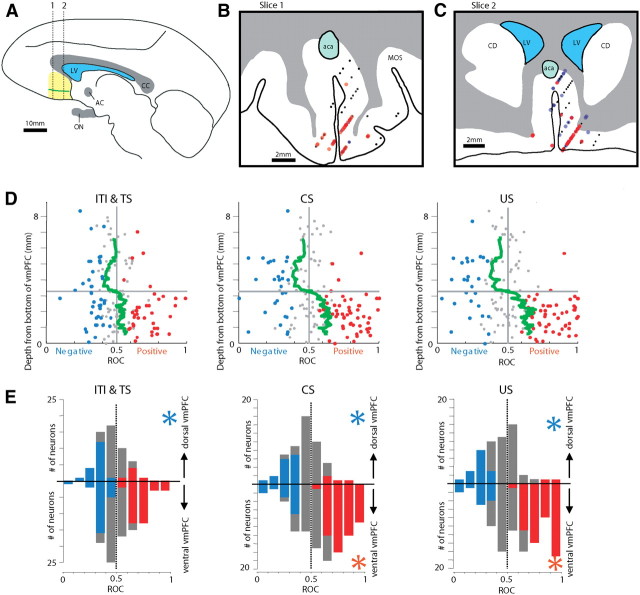
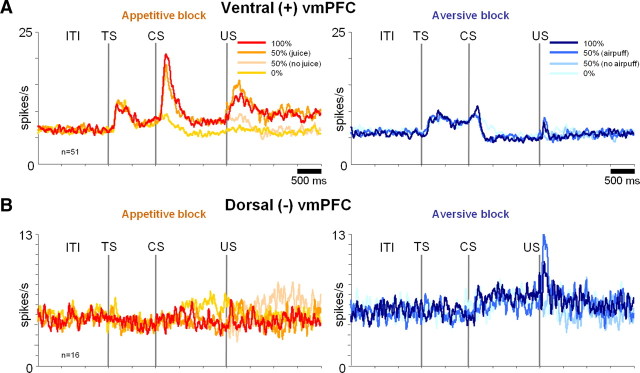
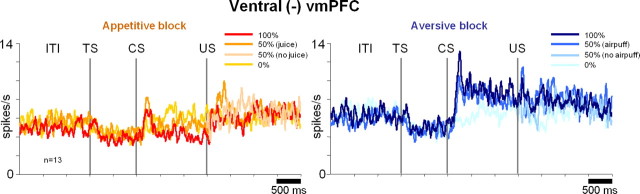
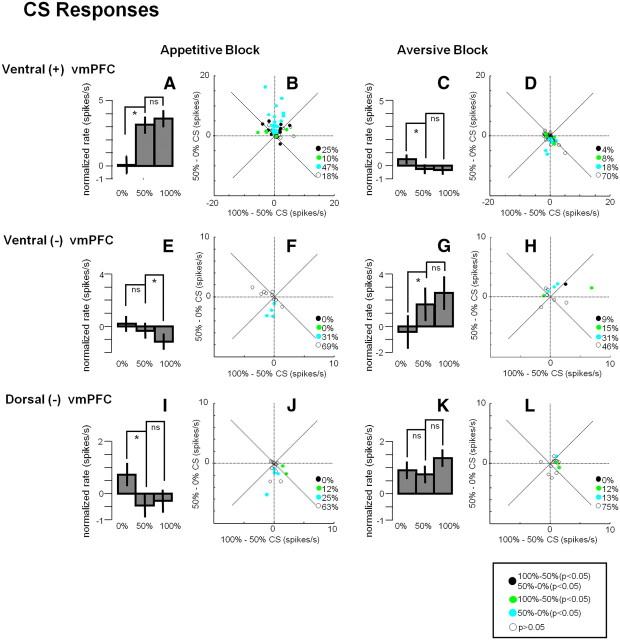
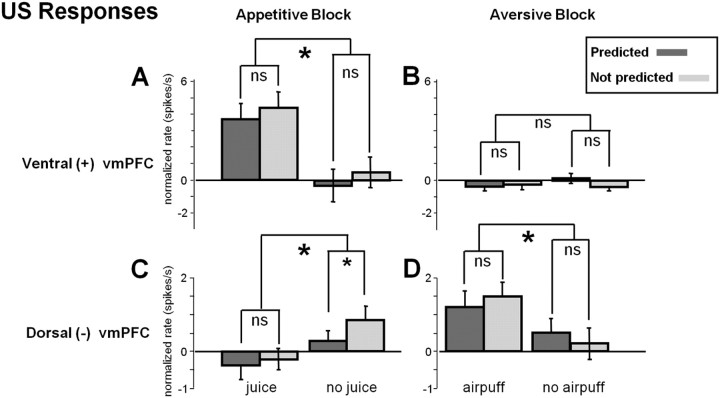
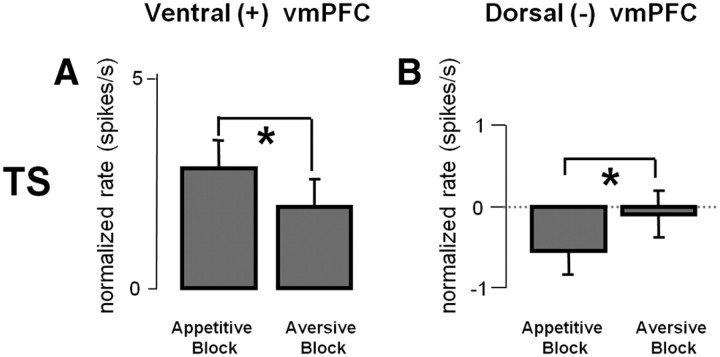
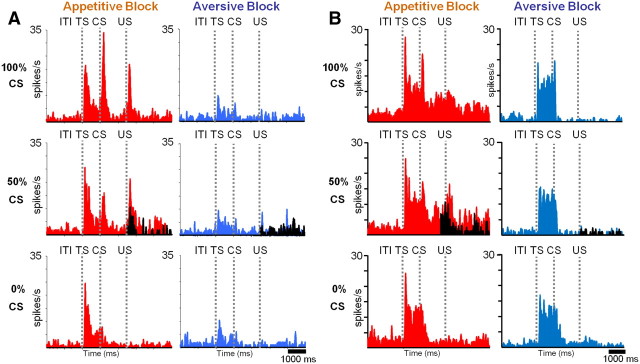
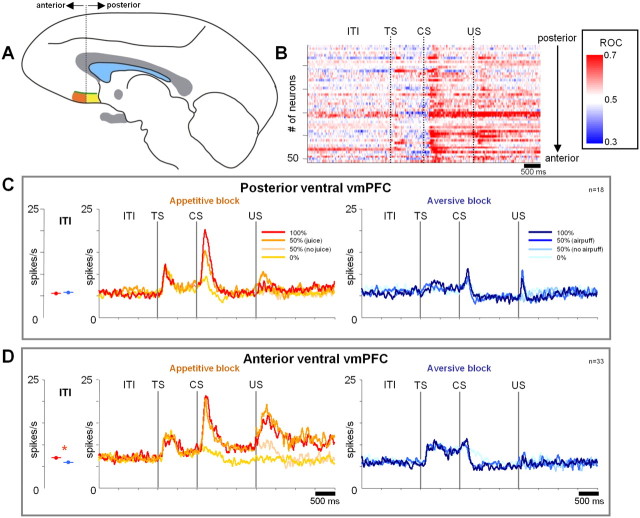
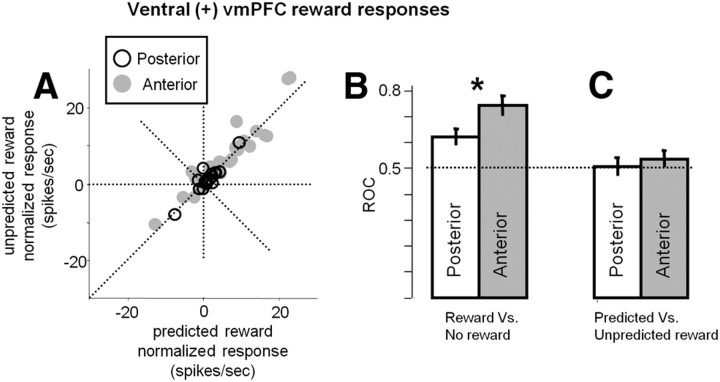
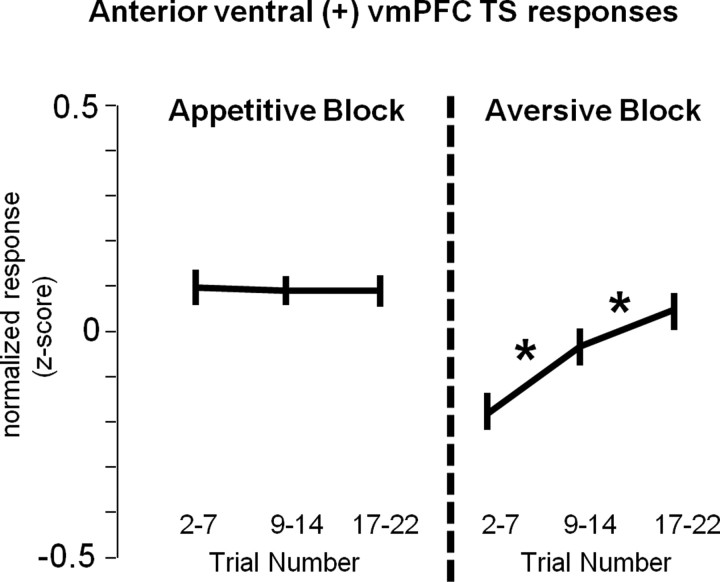
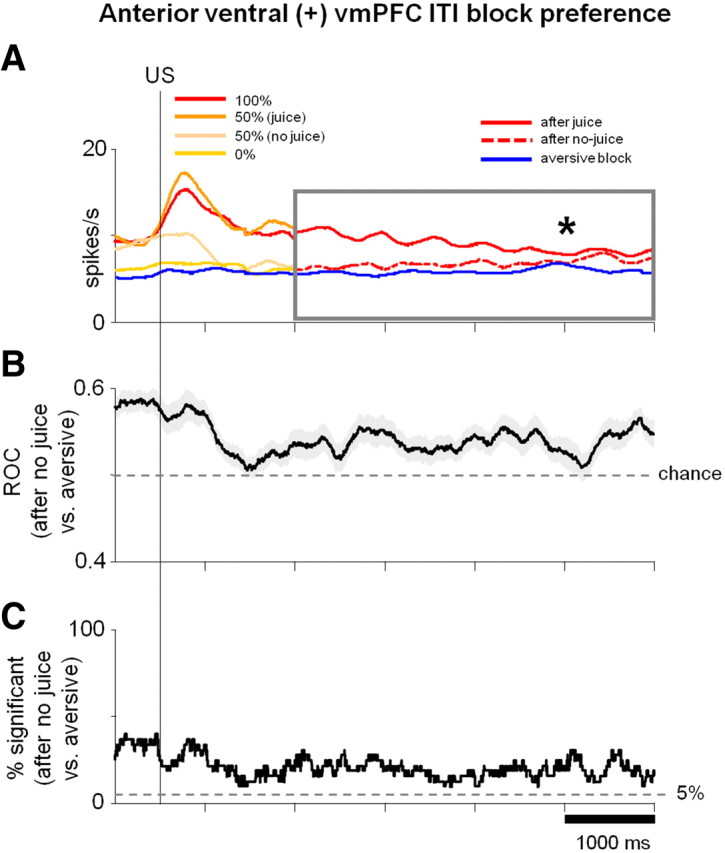
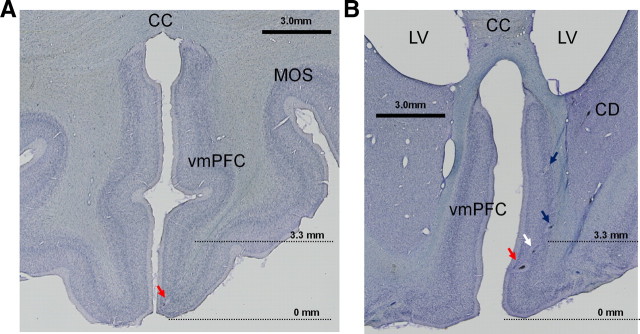
The ventromedial prefrontal cortex (vmPFC) is thought to be related to emotional experience and to the processing of stimulus and action values. However, little is known about how single vmPFC neurons process the prediction and reception of rewards and punishments. We recorded from monkey vmPFC neurons in an experimental situation with alternating blocks, one in which rewards were delivered and one in which punishments were delivered. Many vmPFC neurons changed their activity between blocks. Importantly, neurons in ventral vmPFC were persistently more active in the appetitive "reward" block, whereas neurons in dorsal vmPFC were persistently more active in the aversive "punishment" block. Furthermore, within ventral vmPFC, posterior neurons phasically encoded probability of reward, whereas anterior neurons tonically encoded possibility of reward. We found multiple distinct nonlinear valuation mechanisms within the primate prefrontal cortex. Our findings suggest that different subregions of vmPFC contribute differentially to the processing of valence. By conveying such multidimensional and nonlinear signals, the vmPFC may enable flexible control of decisions and emotions to adapt to complex environments.


Figures

Figure 1.
Figure 1.
Two-block pavlovian task and behavioral responses. A, In the appetitive block (left), juice was delivered as US. In the aversive block (right), airpuff was delivered as US. In each block, three visual stimuli were used as CS, which predicted US with the probabilities of 100, 50, and 0%. B, Normalized (z-scored) magnitude of licking (top) and blinking (bottom) during the CS epoch in the appetitive (left) and aversive (right) blocks. Vertical bars indicate the mean ± SEM (from single trial z-scores across 152 recording sessions). Licking was correlated to the probability of reward during the appetitive block (ρ = 0.33; p < 0.01). Blinking was correlated to the probability of punishment during the aversive block (ρ = 0.25; p < 0.01). The correlations were performed on single trial z-scores across 152 recording sessions.
Figure 2.
Figure 2.
Two example neurons in the vmPFC. A–C, A neuron that preferred the appetitive block (positive neuron). D–F, A neuron that preferred the aversive block (negative neuron). A, D, Recording sites plotted on coronal MR images (red, positive neuron; blue, negative neuron). B, E, Average spike activity shown separately for different CSs in the appetitive and aversive blocks. Shown in black is the activity in trials when US was omitted. The spike activity is shown by SDFs (σ = 50 ms). C, F, Across-block changes in spike activity (σ = 2000 ms).
Figure 3.
Figure 3.
Regionally differential encoding of appetitive and aversive blocks within vmPFC. A, Single neuronal activity was recorded in the vmPFC (yellow area) from 7 to 15 mm anterior to the anterior commissure (AC). The green line demarcates the dorsal and ventral vmPFC defined physiologically (see D). CC, Corpus callosum; ON, optic nerve; LV, lateral ventricle. This drawing is based on a parasagittal MR image through the vmPFC. B, C, Recording sites of positive neurons (red dots) and negative neurons (blue dots) plotted on two coronal sections. The positions of the sections are indicated by dotted lines in A. Small black dots indicate non-modulated neurons. The anterior recording sites (12–15 mm from AC) are included in B; the posterior recording sites (7–11 mm from AC) are included in C. CD, Caudate nucleus; aca, anterior cerebral artery; MOS, medial orbital sulcus. D, The magnitudes of the differential encoding of appetitive and aversive blocks in individual neurons (abscissa) plotted against the depth from the bottom of the vmPFC (ordinate). The magnitudes of the differential block encoding are expressed as ROC areas (see Materials and Methods). They are shown separately for three epochs: ITI and TS (neuronal activity compared in the last 3 s of ITI and first 500 ms of the TS period), after CS (neuronal activity compared during the entire CS epoch; data pooled for 100 and 50% CSs), and after US (neuronal activity compared in the first 1 s after US). The green line indicates the smoothed ROC areas at individual depths. It was obtained by computing a running average of ROC areas of 20 neurons moving one neuron at each step. E, Differential distributions of the state preference magnitudes between the dorsal vmPFC (top) and the ventral vmPFC (bottom) for the individual periods. The dorsal–ventral border was demarcated at the 3.3 mm transition point shown in D. Neurons that displayed significant preference for appetitive or aversive blocks are shown in red or blue, respectively. A blue asterisk indicates that the mean preference magnitude was significantly smaller than 0.5 (p < 0.05; sign test), meaning that the population preferred the aversive block. A red asterisk indicates that the mean preference magnitude was significantly larger than 0.5 (p < 0.05; sign test), meaning a preference for the appetitive block.
Figure 4.
Figure 4.
Dorsal and ventral vmPFC neurons were sensitive to rewards and punishments in different manners. A, Average activity of positive neurons in the ventral vmPFC in the appetitive (left) and aversive (right) block. B, Average activity of negative neurons in the dorsal vmPFC activity in the appetitive (left) and aversive (right) block. The classification of neurons into positive and negative types was based on their responses to CSs (100 and 50% appetitive CSs vs 100 and 50% aversive CSs).
Figure 5.
Figure 5.
Negative neurons in the ventral vmPFC. Same conventions as in Figure 4.
Figure 6.
Figure 6.
AL, CS responses in three groups of vmPFC neurons. Top, Ventral (+); middle, ventral (−); bottom, dorsal (−). Bar graphs show the average ± SEM CS responses in the appetitive block (left) and the aversive block (right). Asterisks indicate significant differences between conditions (paired sign-rank test; p < 0.05); ns indicates not significant. All responses were normalized relative to baseline in each block. Scatter plots show, for individual neurons, the difference between 100–50% CS responses (x-axis) and 50–0% CS responses (y-axis). Filled circles indicate neurons with significant variance (Wilcoxon's rank-sum test; p < 0.05). Black circles, Neurons showing significant differences in CS response in both 100–50% comparison and 50–0% comparison. Green circles, Neurons showing significant differences in only 100–50% comparison. Cyan circles, Neurons showing significant differences in only 50–0% comparison. White circles, neurons showing no significant differences. Percentages of these groups are indicated in each scatter plot.
Figure 7.
Figure 7.
AD, US responses in two groups of vmPFC neurons. Top, Ventral (+); bottom, dorsal (−). The average ± SEM US responses are shown for the appetitive block (left) and the aversive block (right). All responses were normalized relative to baseline in each block. Small asterisks indicate a significant difference between predicted and not predicted outcomes; large asterisks indicate significant difference between outcome delivery and omission (paired sign-rank test; p < 0.05); ns indicates not significant.
Figure 8.
Figure 8.
A, B, TS responses in two groups of vmPFC neurons. Left, Ventral (+); right, dorsal (−). The averaged ± SEM TS responses are shown for the appetitive and aversive blocks. All responses were normalized relative to baseline in each block. Asterisks indicate a significant difference between the aversive and appetitive blocks (paired sign-rank test; p < 0.05). Because dorsal (−) neurons had a slow tonic response to the TS, for this analysis of dorsal (−) TS responses, the entire TS period was used.
Figure 9.
Figure 9.
Examples of phasic (A) and tonic (B) neurons in the ventral vmPFC. Conventions are the same as in Figure 2.
Figure 10.
Figure 10.
Subregional organization within the ventral vmPFC. A, The regions of recording within the posterior (yellow) and anterior (orange) region of the ventral vmPFC. Posterior region, 7–11 mm from AC; anterior region, 12–15 mm from AC. B, Within-trial changes in the appetitive/aversive differential coding shown for individual vmPFC neurons. Each line indicates the data from a single neuron. The magnitudes of the differential encoding are expressed as ROC areas (derived by a running ROC analysis comparing single trial SDFs in the appetitive and aversive blocks at every millisecond) and are color coded. Neurons are sorted according to their locations along the posterior–anterior axis. Only positive neurons are shown. C, D, Average activity of positive neurons in the posterior region (C) and the anterior region (D) of the ventral vmPFC. The same convention as in Figure 4. Average ITI activity in appetitive (red) and aversive (blue) blocks is shown to the left of the SDFs. An asterisk indicates a significant difference (paired sign-rank test; p < 0.05).
Figure 11.
Figure 11.
Comparison of ventral vmPFC responses to predicted and unpredicted reward delivery. A, Each data point indicates the responses of a single ventral vmPFC neuron to the predicted reward US (x-axis) and the unpredicted reward US (y-axis). The data are shown separately for the anterior (gray) and posterior (black) regions in the ventral vmPFC. B, Differential coding of ventral vmPFC neurons between reward delivery (after 100 and 50% reward cues) and reward omission (after 0 or 50% reward cues). The magnitude of the differential encoding was measured by ROC areas. The average ± SEM ROC area is shown separately for the anterior and posterior regions of the ventral vmPFC. Values above 0.5 indicate stronger responses to reward delivery than to reward omission. C, Differential coding of ventral vmPFC neurons between the predicted reward delivery (after 100% reward cues) and the unpredicted reward delivery (after 50% reward cues). Same conventions as in B. Values above 0.5 indicate stronger responses to the unpredicted than predicted reward delivery. Asterisk indicates significant difference in the average ROC area between the posterior and anterior regions of the ventral vmPFC (Wilcoxon's rank-sum test; p < 0.05).
Figure 12.
Figure 12.
Within-block changes in TS response in the anterior region of the ventral vmPFC. One block of trials was separated into the early, middle, and late sub-blocks, and single-trial TS responses were obtained for each sub-block for all 33 anterior ventral (+) vmPFC neurons. For each neuron, single-trial responses were converted to z-scores (normalized relative to the average TS response across both the aversive and appetitive blocks). Asterisks indicate significant differences in activity between adjacent sub-blocks (Wilcoxon's rank-sum test; p < 0.05). Because anterior ventral aversive block TS responses were tonic and continued until the presentation of the aversive CSs, for this analysis, TS responses were measured for the entire TS period.
Figure 13.
Figure 13.
Anterior ventral vmPFC ITI activity is related to valence context. A, SDFs of average activity of positive neurons in the anterior region of ventral vmPFC (σ = 300 ms) aligned on US in the appetitive and aversive blocks. Colors of SDFs in the appetitive block for the first 1.5 s after US are the same as in Figure 10D. Reward delivery and omission responses after 100, 50, and 0% CSs are shown separately. Because these neurons were not strongly modulated by punishment delivery and omission (Fig. 10D; right), all trials in the aversive block are combined (blue SDF). ITI activity after 1.5 s after the US (shown in the gray box) is sorted into three categories: ITI after rewards (solid red line), ITI after no rewards (dotted red line), and ITI during aversive block (blue line). Asterisk indicates significant difference between the level of ITI activity after no-reward trials and aversive block trials (paired sign-rank test; p < 0.01; comparison made for activity in the time window indicated by the gray box). B, Average ± SEM ROC (shaded region). For each neuron, a running ROC analysis (at each millisecond of the SDFs in A) compared ITI activity after no-reward trials in the appetitive block with ITI activity in the aversive block (blue line in A). C, Percentage of neurons in time with significant differences in ITI activity after no-reward trials in the appetitive block versus ITI activity during the aversive block (tested at each millisecond of the SDFs in A; two-tailed rank-sum test; p < 0.05).
Figure 14.
Figure 14.
Histological confirmation of recording sites within the vmPFC. A, A coronal section 14 mm anterior to the anterior commissure (AC) showing an electrolytic mark at which a positive neuron was recorded. B, A coronal section of the vmPFC 10 mm anterior to the AC. Three electrolytic marks (shown by 3 arrows) along a recording track indicate the recording sites of a positive neuron (red arrow), nonsignificant neuron (white arrow), and negative neuron (blue arrow). A fourth mark (blue arrow dorsal to the 3 marks) indicates the recording site of a negative neuron. The positive neurons in A and B were judged to be in the ventral vmPFC (because they were below the 3.3 mm transition point), whereas the negative neurons were judged to be in the dorsal vmPFC. Locations of the two histological slices are shown on a drawing from a parasagittal MR image through the vmPFC in Figure 3A and correspond to coronal MR images shown in Figure 3, B and C. The transition point between the ventral-positive region and the dorsal-negative region (3.3 mm from the bottom; see Fig. 3) is indicated by dotted lines. CD, Caudate nucleus; CC, corpus callosum; LV, lateral ventricle; MOS, medial orbital sulcus.

References

    1. Barbas H, Ghashghaei H, Dombrowski SM, Rempel-Clower NL. Medial prefrontal cortices are unified by common connections with superior temporal cortices and distinguished by input from memory-related areas in the rhesus monkey. J Comp Neurol. 1999;410:343–367. - PubMed
    1. Bechara A, Tranel D, Damasio H, Damasio AR. Failure to respond autonomically to anticipated future outcomes following damage to prefrontal cortex. Cereb Cortex. 1996;6:215–225. - PubMed
    1. Bechara A, Damasio H, Damasio AR. Emotion, decision making and the orbitofrontal cortex. Cereb Cortex. 2000;10:295–307. - PubMed
    1. Belova MA, Paton JJ, Salzman CD. Moment-to-moment tracking of state value in the amygdala. J Neurosci. 2008;28:10023–10030. - PMC - PubMed
    1. Bouret S, Richmond BJ. Ventromedial and orbital prefrontal neurons differentially encode internally and externally driven motivational values in monkeys. J Neurosci. 2010;30:8591–8601. - PMC - PubMed

LinkOut - more resources