. 2012 Sep 15;72(18):4765-76.
doi: 10.1158/0008-5472.CAN-12-0820. Epub 2012 Jul 25.

B-Raf activation cooperates with PTEN loss to drive c-Myc expression in advanced prostate cancer

Affiliations

B-Raf activation cooperates with PTEN loss to drive c-Myc expression in advanced prostate cancer

Jingqiang Wang et al. Cancer Res. .

Abstract

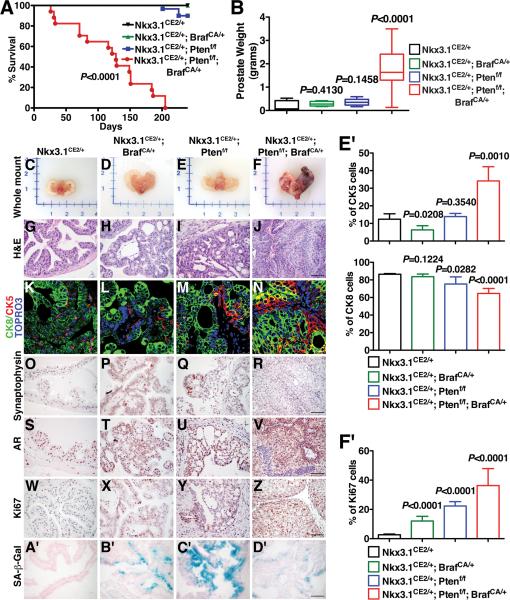
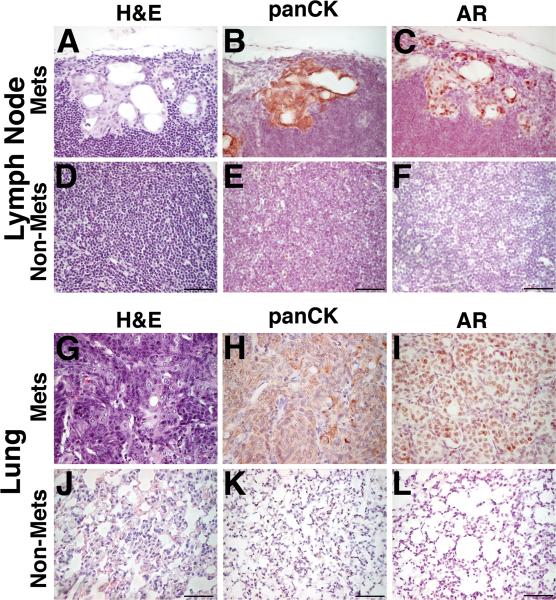
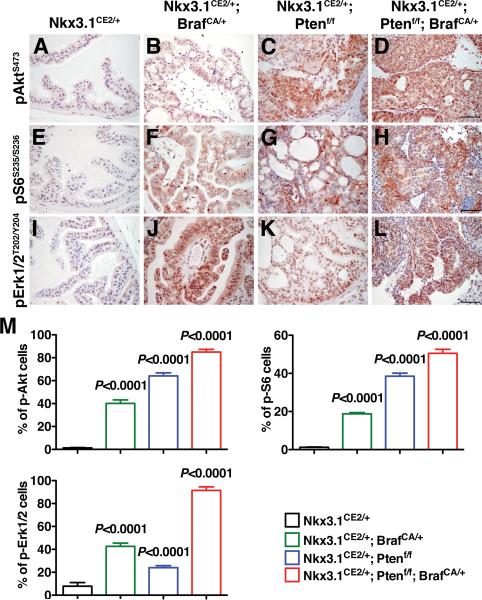
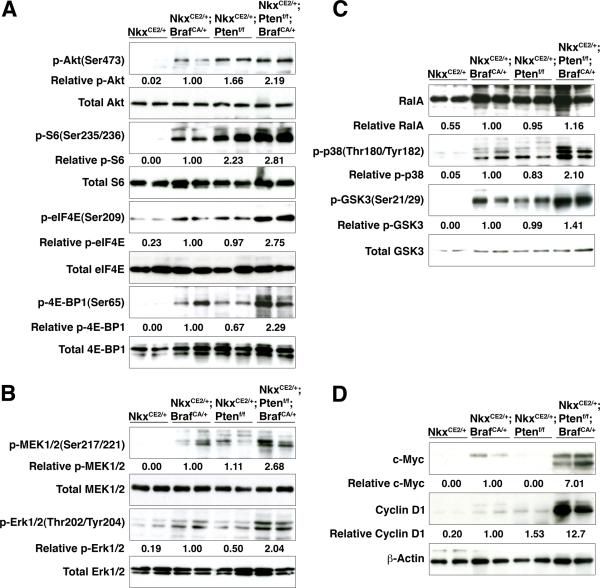
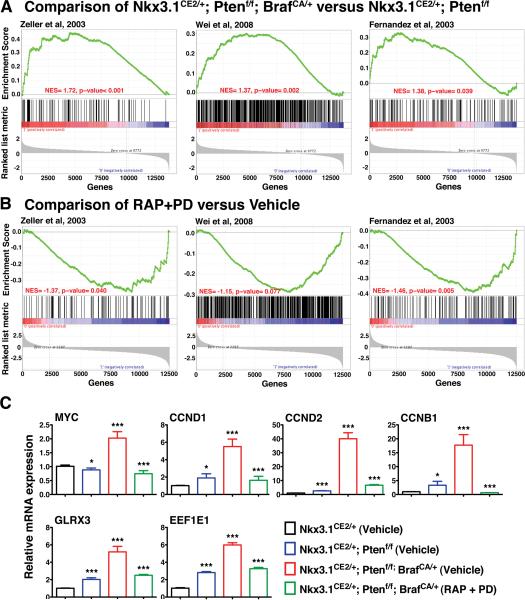
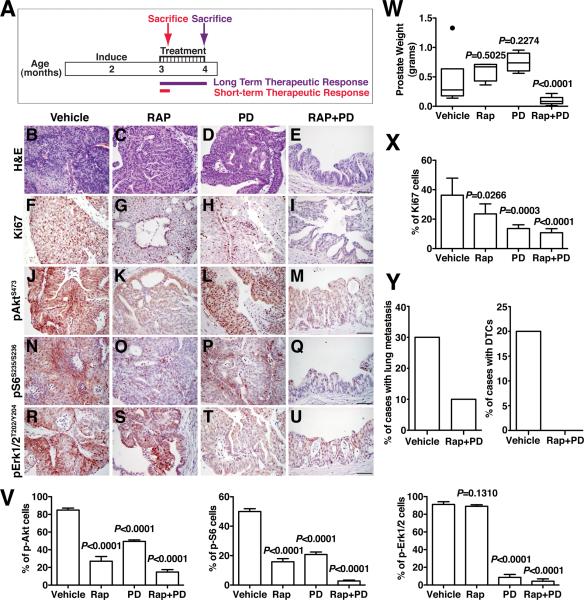
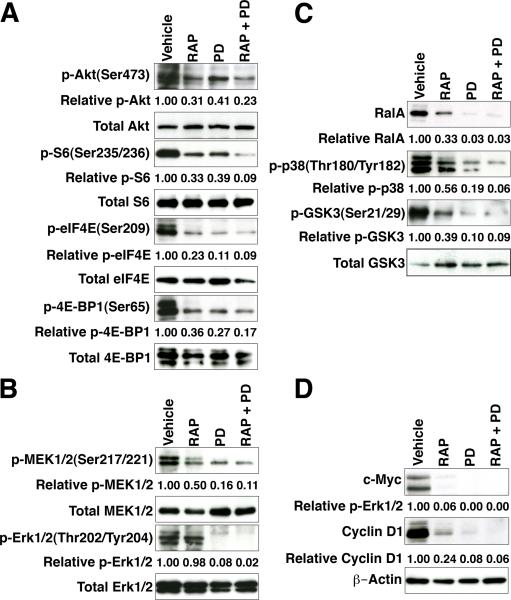
Both the PI3K → Akt → mTOR and mitogen-activated protein kinase (MAPK) signaling pathways are often deregulated in prostate tumors with poor prognosis. Here we describe a new genetically engineered mouse model of prostate cancer in which PI3K-Akt-mTOR signaling is activated by inducible disruption of PTEN, and extracellular signal-regulated kinase 1/2 (ERK1/2) MAPK signaling is activated by inducible expression of a BRAF(V600E) oncogene. These tissue-specific compound mutant mice develop lethal prostate tumors that are inherently resistant to castration. These tumors bypass cellular senescence and disseminate to lymph nodes, bone marrow, and lungs where they form overt metastases in approximately 30% of the cases. Activation of PI3K → Akt → mTOR and MAPK signaling pathways in these prostate tumors cooperate to upregulate c-Myc. Accordingly, therapeutic treatments with rapamycin and PD0325901 to target these pathways, respectively, attenuate c-Myc levels and reduce tumor and metastatic burden. Together, our findings suggest a generalized therapeutic approach to target c-Myc activation in prostate cancer by combinatorial targeting of the PI3K → Akt → mTOR and ERK1/2 MAPK signaling pathways.


Figures

Figure 1
Figure 1
Cooperation of Braf activation and Pten loss in prostate cancer. (A) Survival curve shows the percentage of mice of the indicated genotypes surviving after tumor induction. (B) Average wet weights of prostate tumors. (C-F) Whole mount images. (G-J) Representative H&E images of anterior prostate. (K-N) Immunofluorescence images show staining for cytokeratin 8 (CK8), which stains luminal epithelial cells, and cytokeratin 5 (CK5), which stains basal epithelial cells. Note that the prostate tumors are primarily luminal as evident by the robust staining for CK8, with more limited staining of CK5. (O-R) Immunohistochemical (IHC) staining for Synaptophysin. (S-V) IHC staining for AR in the intact mice. Note that the prostates from each of the models express nuclear AR. (W-Z) IHC staining for Ki67. (A’-D’) SA-β-Gal staining shows prominent senescence in the prostates from the Nkx3.1CE2/+; BrafCA/+ (NB) and Nkx3.1CE2/+; Ptenf/f (NP) mice, but not in the Nkx3.1CE2/+; Ptenf/f; BrafCA/+ (NPB) mice. (E’) Immunofluorescence staining index as measured by the percentage of the indicated CK5 and CK8 positive cells relative to total epithelial cells in the prostates of mice by genotypes as indicated. (F’) Average proliferation assessed by the number of Ki67-positive cells relative to total epithelial cells. Where indicated, p-values compare the experimental to the control (Nkx3.1CE2/+ prostate) and scale bars represent 100 μm, except in (K-N) where they represent 25 μm.
Figure 2
Figure 2
Prostate tumors from Nkx3.1CE2/+; Ptenf/f; BrafCA/+ (NPB) mice form overt metastases to lungs and lymph nodes. (A-F) Representative H&E images show H&E staining and immunostaining with the indicated antibodies of lymph nodes metastasis as well as normal lymph nodes tissue. (G-L) Representative H&E images show H&E staining and immunostaining with the indicated antibodies of lung metastasis as well as normal lung tissue. The scale bars represent 100 μm.
Figure 3
Figure 3
Activation of kinase pathways in mouse prostate tumors. (A-L) Immunohistochemical staining for the indicated phospho-proteins. (M) Immunohistochemical staining index as measured by the percentage of the indicated phospho-proteins positive cells relative to total epithelial cells in the prostates of mice by genotypes as indicated. Note that the Nkx3.1CE2/+; Ptenf/f (NP) and Nkx3.1CE2/+; Ptenf/f; BrafCA/+ (NPB) prostates display activation (phosphorylation) of Akt, while the Nkx3.1CE2/+; BrafCA/+ (NB) and Nkx3.1CE2/+; Ptenf/f; BrafCA/+ (NPB) have activation of Erk. Where indicated, p-values compare the experimental to the control (Nkx3.1CE2/+ prostate) and scale bars represent 100 μm.
Figure 4
Figure 4
Pathway analyses of mouse prostate tumors. Western blot analyses were done to assess activation of the PI3-kinase→Akt→mTOR pathway (A), MAP kinase signaling (B), RAS pathway activation (C), and expression of Myc and Cyclin D1 (D). Western blots were performed using total protein extracts prepared from dorsolateral prostate or prostate tumors from the indicated genotypes. Western Blots were quantified using ImageJ.
Figure 5
Figure 5
Enrichment of Myc pathway activation. (A) Gene Set Enrichment Analysis (GSEA) showing comparison the gene signature from the NPB (Nkx3.1CE2/+; Ptenf/f; BrafCA/+) versus the NP (Nkx3.1CE2/+; Ptenf/f) tumors with three independent human Myc pathway signatures (28, 30, 32). (Three additional Myc pathways signatures are summarized in Supplementary Table S6A.) The positive enrichment scores for the curve indicate an enrichment of the Myc pathway genes in the mouse signature genes. (B) GSEA comparing the drug response signature (i.e., NPB mice treated with RAP+PD versus vehicle) with three independent human Myc pathway signatures (28, 30, 32). The negative enrichment scores indicate enrichment of the under-expressed part of the drug response signature in the mouse prostate. (C) Real-time PCR validation of selected genes. Data are expressed as the fold change of mRNA relative to that of Nkx3.1CE2/+. The values are the means ± SD; ***P < 0.0001, ** P < 0.001, * P < 0.01. The * on Nkx3.1CE2/+; Ptenf/f; BrafCA/+ (RAP + PD) indicates the comparison between Nkx3.1CE2/+; Ptenf/f; BrafCA/+ (RAP + PD) and Nkx3.1CE2/+; Ptenf/f; BrafCA/+ (Vehicle). All other * indicate the comparisons with Nkx3.1CE2/+ (Vehicle).
Figure 6
Figure 6
Combination therapy reduces tumor burden. (A) Design of preclinical studies utilizing combination therapy with Rapamycin (RAP) and PD0325901 (PD). Nkx3.1CE2/+; Ptenf/f; BrafCA/+ (NPB) mice were induced with tamoxifen at 2 months of age and drug treatment was initiated 1 month later and continued for 1 month, during which time mice were treated with vehicle or RAP and/or PD. Following cessation of treatment, mice were sacrificed (Long-term Response). For evaluation of immediate response to drug action, a cohort of mice were treated with vehicle or RAP and/or PD for 4 days and sacrificed within 6 hours after the last treatment (Short-term Response). Unless otherwise indicated the analyses show data for the Long-term Response. (B-E) Representative H&E images of mice treated with vehicle, RAP and/or PD as indicated. (F-I) Representative Ki67 immunostaining of prostate tissues treated as indicated. (J-U) Immunostaining for the indicated phospho-proteins. (V) Immunostaining index as measured by the percentage of the indicated phospho-proteins positive cells relative to total epithelial cells in the prostates of mice treated as indicated. (W) Average prostate weight for mice treated as indicated. (X) Proliferation index as measured by the percentage of Ki67 positive cells relative to total epithelial cells in the prostates of mice treated as indicated. (Y) The penetrance of lung metastasis and DTCs of mice treated as indicated. Where indicated, p-values compare the drug-treated to vehicle-treated groups, and scale bars represent 100 μm.
Figure 7
Figure 7
Combination therapy suppresses Myc activation. Western blot analyses of tissues from Short-term Response mice show expression of PI3-kinase→Akt→mTOR (A), MAP kinase (B), and Ras (C) pathway markers, as well as Myc and Cyclin D1 (D) following drug treatment. Western blots were performed using total protein extracts prepared from dorsolateral prostate or prostate tumors from the indicated drug treatments. Western Blots were quantified using ImageJ.

References

    1. Shen MM, Abate-Shen C. Molecular genetics of prostate cancer: new prospects for old challenges. Genes Dev. 2010;24:1967–2000. - PMC - PubMed
    1. Jenkins RB, Qian J, Lieber MM, Bostwick DG. Detection of c-myc oncogene amplification and chromosomal anomalies in metastatic prostatic carcinoma by fluorescence in situ hybridization. Cancer Res. 1997;57:524–31. - PubMed
    1. Sato K, Qian J, Slezak JM, Lieber MM, Bostwick DG, Bergstralh EJ, et al. Clinical significance of alterations of chromosome 8 in high-grade, advanced, nonmetastatic prostate carcinoma. Journal of the National Cancer Institute. 1999;91:1574–80. - PubMed
    1. Gurel B, Iwata T, Koh CM, Jenkins RB, Lan F, Van Dang C, et al. Nuclear MYC protein overexpression is an early alteration in human prostate carcinogenesis. Modern pathology : an official journal of the United States and Canadian Academy of Pathology, Inc. 2008;21:1156–67. - PMC - PubMed
    1. Kinkade CW, Castillo-Martin M, Puzio-Kuter A, Yan J, Foster TH, Gao H, et al. Targeting AKT/mTOR and ERK MAPK signaling inhibits hormone-refractory prostate cancer in a preclinical mouse model. J Clin Invest. 2008;118:3051–64. - PMC - PubMed

Publication types

Substances