

Wavelength-dependent change of retinal nerve fiber layer reflectance in glaucomatous retinas
- PMID: 22836775
- PMCID: PMC3428115
- DOI: 10.1167/iovs.12-10001
Wavelength-dependent change of retinal nerve fiber layer reflectance in glaucomatous retinas
Abstract
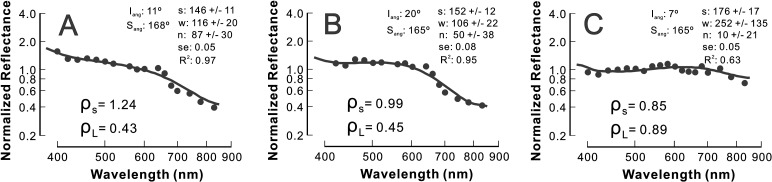
Purpose: Retinal nerve fiber layer (RNFL) reflectance is often used in optical methods for RNFL assessment in clinical diagnosis of glaucoma, yet little is known about the reflectance property of the RNFL under the development of glaucoma. This study measured the changes in RNFL reflectance spectra that occurred in retinal nerve fiber bundles with different degrees of glaucomatous damage.
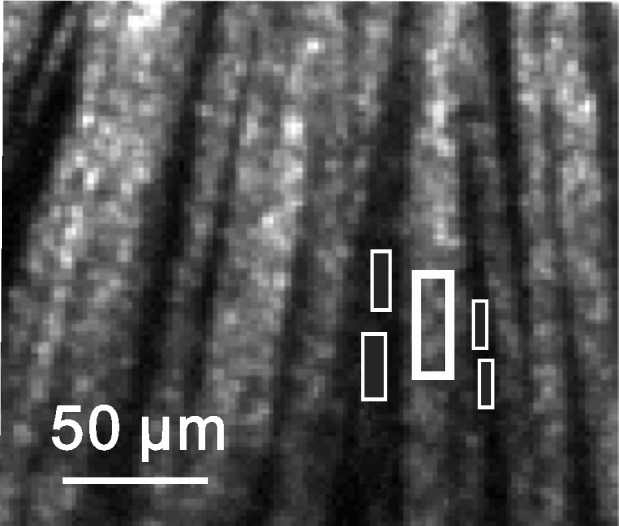
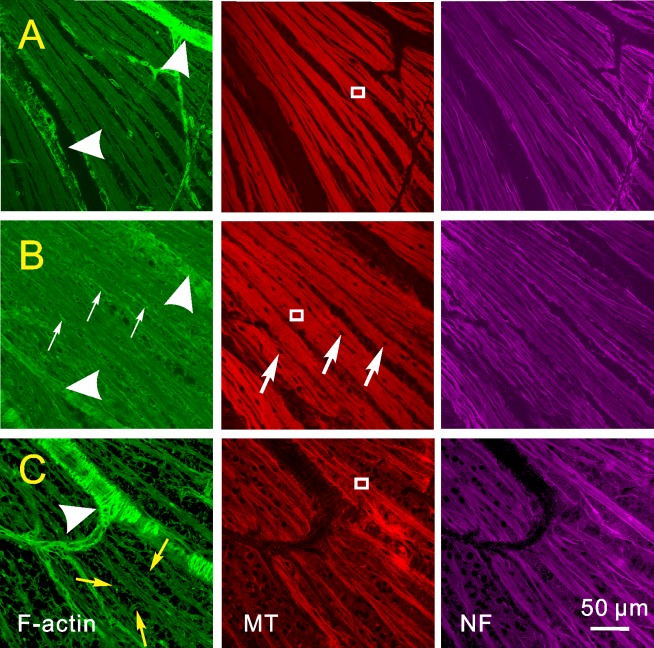
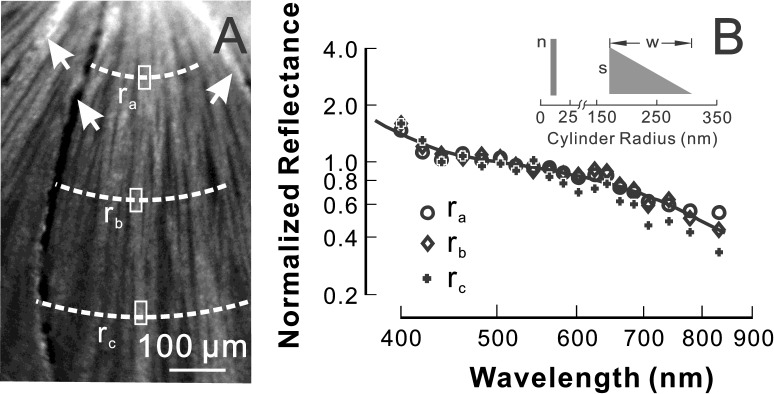
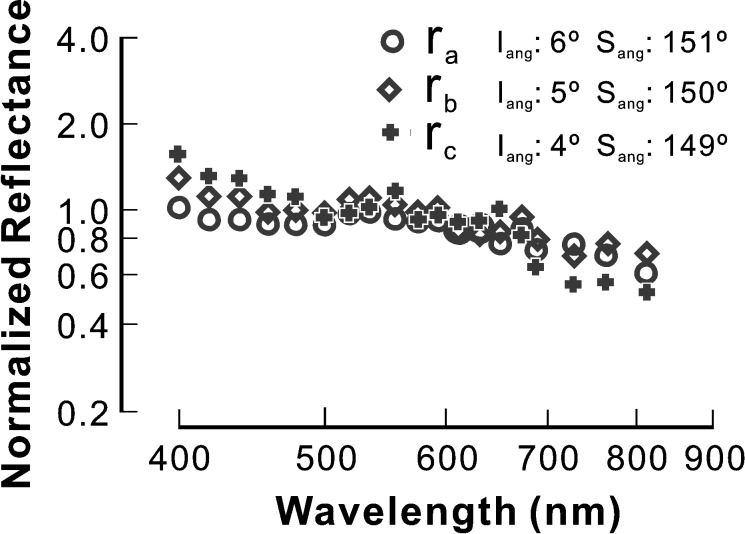
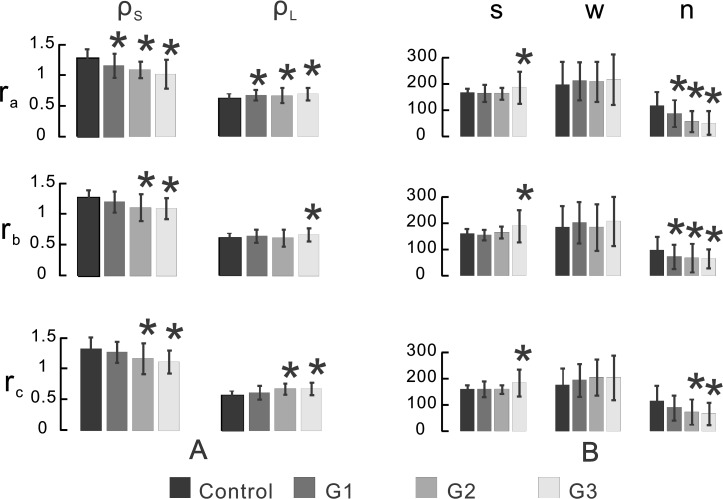
Methods: A rat model of glaucoma with laser photocoagulation of trabecular meshwork was used. Reflectance of the RNFL in an isolated retina was measured at wavelengths of 400-830 nm. Cytostructural distribution of the bundles measured optically was evaluated by confocal imaging of immunohistochemistry staining of cytoskeletal components, F-actin, microtubules, and neurofilaments. RNFL reflectance spectra were studied in bundles with normal-looking appearance, early F-actin distortion, and apparent damage of all cytoskeletal components. Changes of RNFL reflectance spectra were studied at different radii (0.22, 0.33, and 0.44 mm) from the optic nerve head (ONH).
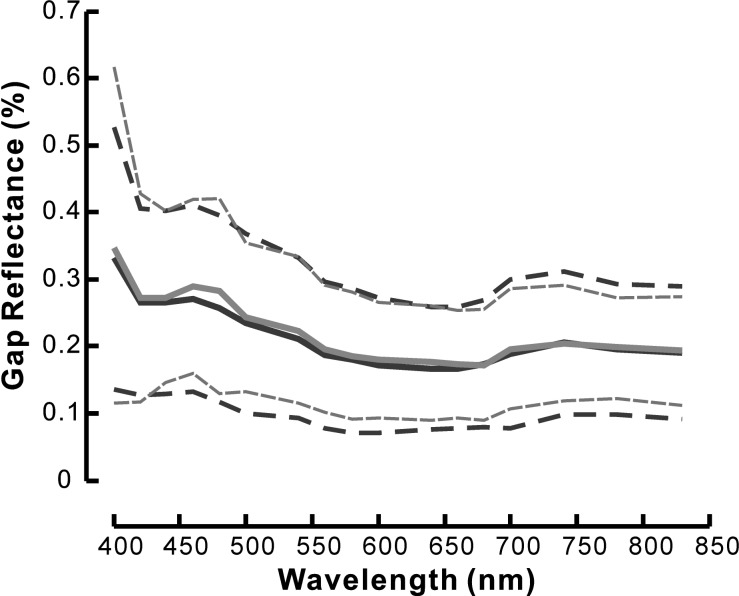
Results: Bundles in 30 control retinas and 41 glaucomatous retinas were examined. In normal retinas, reflectance spectra were similar along the same bundles. In glaucomatous retinas, reflectance spectra changed along bundles with the spectra becoming flatter as bundle areas approached the ONH.
Conclusions: Elevation of intraocular pressure (IOP) causes nonuniform changes in RNFL reflectance across wavelengths. Changes of reflectance spectra occur early in bundles near the ONH and prior to apparent cytoskeletal distortion. Using the ratio of RNFL reflectance measured at different wavelengths can provide early and sensitive detection of glaucomatous damage.
Conflict of interest statement
Disclosure:
Figures
Similar articles
-
Distortion of axonal cytoskeleton: an early sign of glaucomatous damage.Invest Ophthalmol Vis Sci. 2011 May 2;52(6):2879-88. doi: 10.1167/iovs.10-5929. Invest Ophthalmol Vis Sci. 2011. PMID: 21245391 Free PMC article.
-
Reflectance decreases before thickness changes in the retinal nerve fiber layer in glaucomatous retinas.Invest Ophthalmol Vis Sci. 2011 Aug 24;52(9):6737-42. doi: 10.1167/iovs.11-7665. Invest Ophthalmol Vis Sci. 2011. PMID: 21730345 Free PMC article.
-
Cytoskeletal Alteration and Change of Retinal Nerve Fiber Layer Birefringence in Hypertensive Retina.Curr Eye Res. 2017 Jun;42(6):936-947. doi: 10.1080/02713683.2016.1262043. Epub 2017 Jan 17. Curr Eye Res. 2017. PMID: 28094584 Free PMC article.
-
Integrins in trabecular meshwork and optic nerve head: possible association with the pathogenesis of glaucoma.Biomed Res Int. 2013;2013:202905. doi: 10.1155/2013/202905. Epub 2013 Mar 18. Biomed Res Int. 2013. PMID: 23586020 Free PMC article. Review.
-
Aging Effects on Optic Nerve Neurodegeneration.Int J Mol Sci. 2023 Jan 29;24(3):2573. doi: 10.3390/ijms24032573. Int J Mol Sci. 2023. PMID: 36768896 Free PMC article. Review.
Cited by
-
Reflectance evaluation of eye fundus structures with a visible and near-infrared multispectral camera.Biomed Opt Express. 2022 May 19;13(6):3504-3519. doi: 10.1364/BOE.457412. eCollection 2022 Jun 1. Biomed Opt Express. 2022. PMID: 35781951 Free PMC article.
-
Reflectance Spectrum and Birefringence of the Retinal Nerve Fiber Layer With Hypertensive Damage of Axonal Cytoskeleton.Invest Ophthalmol Vis Sci. 2017 Apr 1;58(4):2118-2129. doi: 10.1167/iovs.16-20553. Invest Ophthalmol Vis Sci. 2017. PMID: 28395028 Free PMC article.
-
Visible Light Optical Coherence Tomography of Peripapillary Retinal Nerve Fiber Layer Reflectivity in Glaucoma.Transl Vis Sci Technol. 2022 Sep 1;11(9):28. doi: 10.1167/tvst.11.9.28. Transl Vis Sci Technol. 2022. PMID: 36166221 Free PMC article.
-
Investigating Tissue Optical Properties and Texture Descriptors of the Retina in Patients with Multiple Sclerosis.PLoS One. 2015 Nov 30;10(11):e0143711. doi: 10.1371/journal.pone.0143711. eCollection 2015. PLoS One. 2015. PMID: 26619298 Free PMC article.
-
Response of the Retinal Nerve Fiber Layer Reflectance and Thickness to Optic Nerve Crush.Invest Ophthalmol Vis Sci. 2018 Apr 1;59(5):2094-2103. doi: 10.1167/iovs.17-23148. Invest Ophthalmol Vis Sci. 2018. PMID: 29677373 Free PMC article.
References
-
- Hoyt WH, Frisen L, Newman NM. Fundoscopy of nerve fiber layer defects in glaucoma. Invest Ophthalmol. 1973;12:814–829 - PubMed
-
- Quigley H, Miller NR, George T. Clinical evaluation of nerve fiber layer atrophy as an indicator of glaucomatous optic nerve damage. Arch Ophthalmol. 1980;98:1564–1571 - PubMed
-
- Sommer A, Katz J, Quigley H, et al. Clinically detectable nerve fiber atrophy precedes the onset of glaucomatous field loss. Arch Ophthalmol. 1991;109:77–83 - PubMed
-
- Schuman JS, Hee MR, Arya AV, et al. Optical coherence tomography: a new tool for glaucoma diagnosis. Curr Opin Ophthalmol. 1995;6:89–95 - PubMed
-
- Schuman JS, Hee MR, Puliafito CA, et al. Quantification of nerve fiber layer thickness in normal and glaucomatous eyes using optical coherence tomography. Arch Ophthalmol. 1995;113:586–596 - PubMed
Publication types
MeSH terms
Substances
Grants and funding
LinkOut - more resources
Full Text Sources
Other Literature Sources
Medical
