. 2012 Sep;81(9):776-84.
doi: 10.1002/cyto.a.22101. Epub 2012 Jul 26.

Image cytometry-based detection of aneuploidy by fluorescence in situ hybridization in suspension

Affiliations

Image cytometry-based detection of aneuploidy by fluorescence in situ hybridization in suspension

Hans Minderman et al. Cytometry A. 2012 Sep.

Abstract

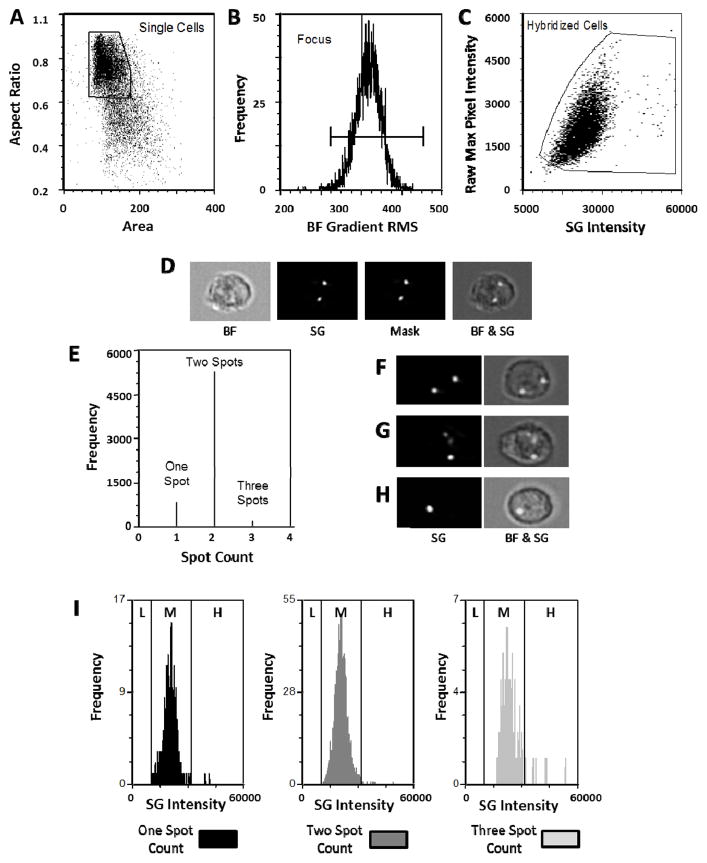
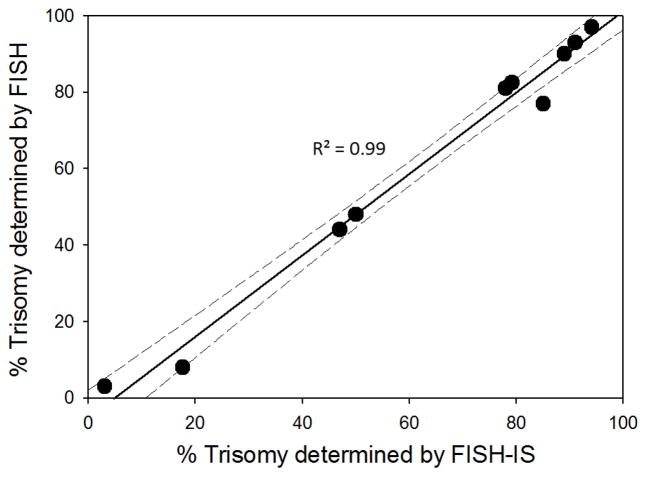
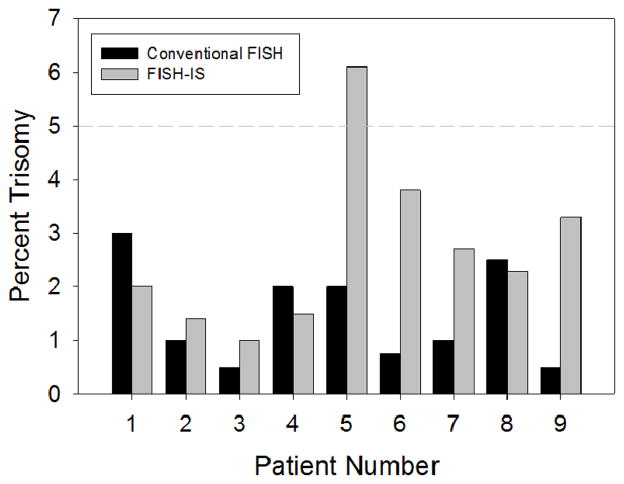
Cytogenetic abnormalities are important diagnostic and prognostic criteria for hematologic malignancies. Karyotyping and fluorescence in situ hybridization (FISH) are the conventional methods by which these abnormalities are detected. The sensitivity of these microscopy-based methods is limited by the abundance of the abnormal cells in the samples and therefore these analyses are commonly not applicable to minimal residual disease (MRD) stages. A flow cytometry-based imaging approach was developed to detect chromosomal abnormalities following FISH in suspension (FISH-IS), which enables the automated analysis of several log-magnitude higher number of cells compared with the microscopy-based approaches. This study demonstrates the applicability of FISH-IS for detecting numerical chromosome aberrations, establishes accuracy, and sensitivity of detection compared with conventional FISH, and feasibility to study procured clinical samples of acute myeloid leukemia (AML). Male and female healthy donor peripheral blood mononuclear cells hybridized with combinations of chromosome enumeration probes (CEP) 8, X, and Y served as models for disomy, monosomy, and trisomy. The sensitivity of detection of monosomies and trisomies amongst 20,000 analyzed cells was determined to be 1% with a high level of precision. A high correlation (R(2) = 0.99) with conventional FISH analysis was found based on the parallel analysis of diagnostic samples procured from 10 AML patients with trisomy 8 (+8). Additionally, FISH-IS analysis of samples procured at the time of clinical remission demonstrated the presence of residual +8 cells indicating that this approach may be used to detect MRD and associated chromosomal defects.


Figures

Figure 1
Figure 1. Hierarchical gating and analysis strategy to identify ploidy in a healthy female donor sample hybridized with a CEP8 probe
Single cells are discriminated from debris and cell aggregates based on area and aspect ratio of the brightfield image (A). Of those cells, events which are in focus are selected on the basis of a high value of a contrast parameter (gradient RMS of the brightfield image) (B). Single, in focus cells that have a hybridization signal are then selected based on raw maximum pixel intensity of the SpectrumGreen image and the total cellular SpectrumGreen intensity (C). The SpectrumGreen images are segmented (masked) to identify hybridization spots by applying an algorithm that takes into account the signal to background ratio and the diameter of the spots. The corresponding brightfield (BF) and SpectrumGreen (SG) image of a representative cell, together with the associated spot-mask (Mask) and a collective overlay (BF & SG) of these images are shown in (D). A spot count feature is then applied (E) indicating that 12.4% cells contain 1 spot, 84.9% cells contain two spots, and 2.75% cells contain 3 spots. Panels F, G and H are examples of how a disomy can be associated with a 2 spot, 3 spot, and 1 spot count, respectively. Total fluorescence intensity distribution of each spot count category (1, 2, or 3) is also assessed (I) showing that most events fall within the medium (M) intensity range established for diploid (2n) cells. L=low intensity range (<2n); H=high intensity range (>2n). Note that the y-axes scales in fig 1I are normalized to better visualize the intensity distributions.
Figure 2
Figure 2. Visual verification of trisomies from model 0.1% Trisomy sample
The population identified as trisomies by FISH-IS analysis was manually examined and true trisomy events were identified. Cells in focus, shown by Brightfield image (BF, Left column); Spot images (2nd column); and nuclear staining shown (DAPI, 3rd column); with overlay on the right showing spots in the nucleus. DAPI signal was pseudo-colored red in analysis software to better display the presence of spots in the overlay.
Figure 3
Figure 3. Correlation between spot count, ploidy and fluorescence intensity
The analysis of male PBMCs mixed with female PBMCs at a 10:90 ratio following hybridization with CEPX (A) or CEPY+CEP8 (B) is shown. Low intensity (L) = <2n, Medium intensity (M) = 2n, and High intensity (H) = >2n; ranges are assigned according to the intensity distribution of diploid cells. In the 10% monosomy model (A) the fluorescence intensity of the male cells (1 X-chr) is 50% of that detected for the female cells (2 X-chr). In the artificial trisomy model (B) the intensity of the cells is greater than 150% of that of the disomies due to the larger hybridization signal of the CEPY probe compared to a single hybridization signal of a CEP8 probe. Figure 3C demonstrates that in a true trisomy sample (AML +8 sample) for which a single CEP8 probe is used, the intensity of the trisomy population is 150% of that of the disomy population. Fluorescence intensity distributions of A, B and C were normalized to position the disomy peaks at the same intensity level. Note that the y-axes scales are normalized to better visualize the intensity distributions.
Figure 4
Figure 4. Correlation of conventional FISH and FISH-IS
Ten cryopreserved diagnostic samples from patients previously established to be positive for (+8) were evaluated by both conventional FISH and FISH-IS. Graph shows percentage of trisomies in each sample by FISH-IS along the x axis, and conventional FISH along the y axis. Comparison of the two methods yields a correlation value of R2=0.99. First order linear regression of the data is shown by a solid black line and the corresponding 95% confidence interval is shown by the dashed lines.
Figure 5
Figure 5. Reproducibility of trisomy identification
Reproducibility was demonstrated by repeating the procedure on fixed patient samples from hybridization to final analysis on three separate days. On days one, four, and eight post-fixation, aliquots of each cell suspension were processed, hybridized, and run immediately on the ImageStreamX.
Figure 6
Figure 6. FISH-IS analysis of nine (+8) samples at clinical remission
Samples procured at time of clinical remission from nine patients diagnosed with (+8), were analyzed in parallel by conventional FISH (black bars) and FISH-IS (grey bars). The 5% lower detection limit that has been established for conventional FISH is shown as a dashed line

References

    1. Mrozek K, Heerema NA, Bloomfield CD. Cytogenetics in acute leukemia. Blood Rev. 2004;18(2):115–36. - PubMed
    1. Grimwade D, Walker H, Oliver F, Wheatley K, Harrison C, Harrison G, Rees J, Hann I, Stevens R, Burnett A, et al. The importance of diagnostic cytogenetics on outcome in AML: analysis of 1,612 patients entered into the MRC AML 10 trial. The Medical Research Council Adult and Children’s Leukaemia Working Parties. Blood. 1998;92(7):2322–33. - PubMed
    1. Slovak ML, Kopecky KJ, Cassileth PA, Harrington DH, Theil KS, Mohamed A, Paietta E, Willman CL, Head DR, Rowe JM, et al. Karyotypic analysis predicts outcome of preremission and postremission therapy in adult acute myeloid leukemia: a Southwest Oncology Group/Eastern Cooperative Oncology Group Study. Blood. 2000;96(13):4075–83. - PubMed
    1. Byrd JC, Mrozek K, Dodge RK, Carroll AJ, Edwards CG, Arthur DC, Pettenati MJ, Patil SR, Rao KW, Watson MS, et al. Pretreatment cytogenetic abnormalities are predictive of induction success, cumulative incidence of relapse, and overall survival in adult patients with de novo acute myeloid leukemia: results from Cancer and Leukemia Group B (CALGB 8461) Blood. 2002;100(13):4325–36. - PubMed
    1. Grimwade D, Walker H, Harrison G, Oliver F, Chatters S, Harrison CJ, Wheatley K, Burnett AK, Goldstone AH. The predictive value of hierarchical cytogenetic classification in older adults with acute myeloid leukemia (AML): analysis of 1065 patients entered into the United Kingdom Medical Research Council AML11 trial. Blood. 2001;98(5):1312–20. - PubMed

Publication types