. 2012 Aug 31;337(6098):1115-9.
doi: 10.1126/science.1225152. Epub 2012 Jul 26.

Compartmentalized control of skin immunity by resident commensals

Affiliations

Compartmentalized control of skin immunity by resident commensals

Shruti Naik et al. Science. .

Abstract

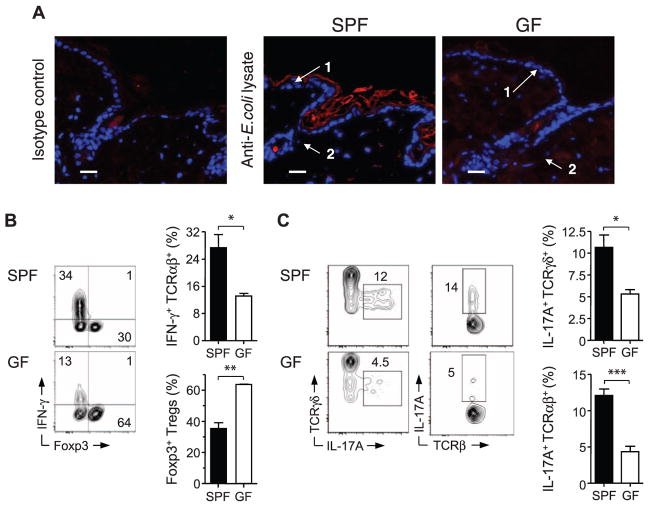
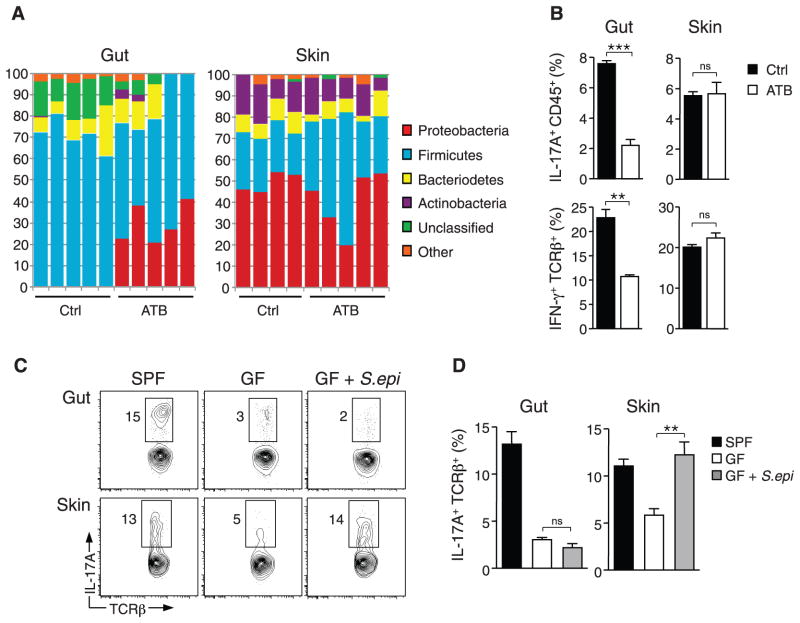
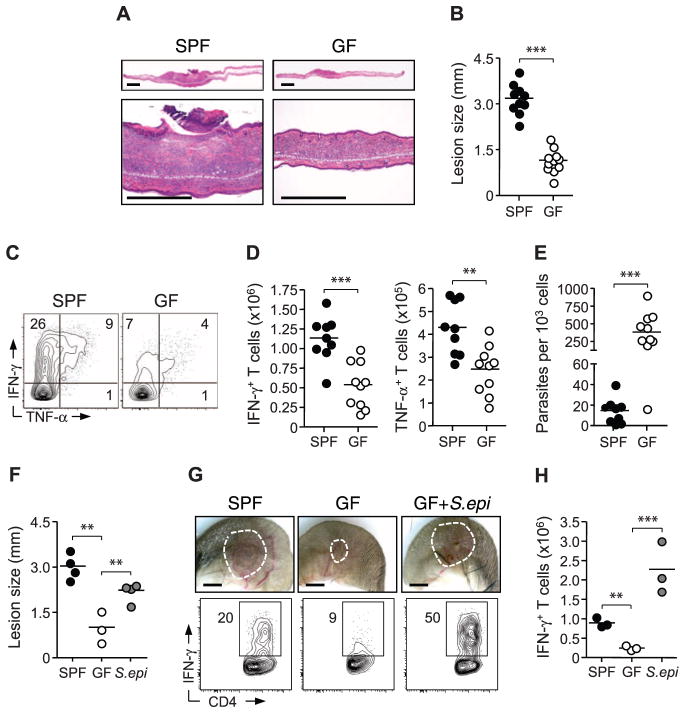
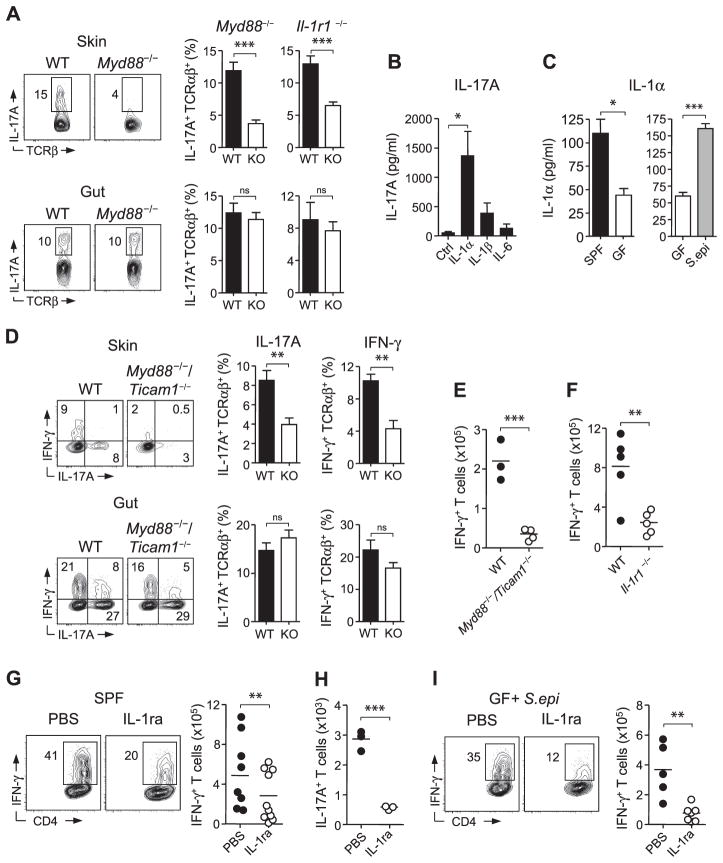
Intestinal commensal bacteria induce protective and regulatory responses that maintain host-microbial mutualism. However, the contribution of tissue-resident commensals to immunity and inflammation at other barrier sites has not been addressed. We found that in mice, the skin microbiota have an autonomous role in controlling the local inflammatory milieu and tuning resident T lymphocyte function. Protective immunity to a cutaneous pathogen was found to be critically dependent on the skin microbiota but not the gut microbiota. Furthermore, skin commensals tuned the function of local T cells in a manner dependent on signaling downstream of the interleukin-1 receptor. These findings underscore the importance of the microbiota as a distinctive feature of tissue compartmentalization, and provide insight into mechanisms of immune system regulation by resident commensal niches in health and disease.


Figures

Fig. 1
Fig. 1
Commensal microbiota control the balance of effector and regulatory T cells in the skin tissue. (A) Immunofluorescence labeling of bacterial products in interfollicular keratinocytes (1) and hair follicles (2) from skin tissue of SPF and GF mice. Representative images show naïve skin stained with anti–E. coli lysate antibody (red) or isotype control and Hoechst (blue); scale bars, 25 μm. (B) Representative flow cytometric plots and summarized bar graphs of IFN-γ and Foxp3 expression by live CD45+ TCRβ+ cells extracted from skin tissue of SPF and GF mice after stimulation with phorbol myristate acetate (PMA) and ionomycin. Graphs show means ± SEM of three or four mice (*P < 0.05, **P < 0.005). Results are representative of three experiments. (C) Representative flow cytometric plots and summarized bar graphs of IL-17A expression in live CD45+ TCRγδ+ or CD45+ TCRαβ+ cells from skin tissue of SPF and GF mice after stimulation with PMA and ionomycin. Graphs show means ± SEM of three or four mice (*P < 0.05, ***P < 0.0005). Results are representative of three experiments.
Fig. 2
Fig. 2
Distinct commensal niches control T cell cytokine production in the gut and skin. (A) Taxonomic classifications at the phylum level for 16S ribosomal RNA gene sequence data clustered at 97% identity from skin tissue and fecal pellet of control mice and mice treated with oral antibiotic cocktail (ATB) for 4 weeks. Each column represents an individual mouse. (B) Assessment of IFN-γ production in live CD45+ TCRβ+ cells and IL-17A production in live CD45+ cells from skin and intestine of mice treated with oral antibiotic cocktail or water (Ctrl) for 4 weeks. Graphs show means ± SEM of four mice (**P < 0.005, ***P < 0.0005; ns, not significant). Results are representative of two or three experiments. (C and D) Flow cytometric analysis of IL-17A production in live CD45+ TCRβ+ cells from the gut and skin of SPF mice, GF mice, and GF mice monoassociated with S. epidermidis (GF + S.epi) for 2 to 3 weeks. Graphs show means ± SEM of three to five mice (**P < 0.005). Results are representative of two experiments.
Fig. 3
Fig. 3
Cutaneous commensals drive immunity and promote pathology in L. major infection. (A) Histopathological comparison of ear pinnae skin lesions from L. major–infected SPF and GF mice. Scale bars, 500 μm. (B) Assessment of lesion size in SPF and GF mice. Each data point represents an individual mouse (***P < 0.0005). (C and D) Flow cytometric analysis of Leishmania antigen-specific IFN-γ and TNF-α production by TCRβ+ CD4+ dermal cells from L. major–infected SPF and GF mice. Each data point represents an individual mouse (**P < 0.005, ***P < 0.0005). Results are representative of three experiments. (E) Number of L. major parasites per 1000 nucleated cells from dermal lesions of infected SPF and GF mice. Each data point represents an individual mouse (***P < 0.0005). (F) Assessment of lesion size in SPF mice, GF mice, and GF mice monoassociated with S. epidermidis (S.epi). Each data point represents an individual mouse (**P < 0.005). Results are representative of two experiments. (G and H) Representative images of L. major skin lesions and analysis of IFN-γ production by live TCRβ+ CD4+ cells from SPF mice, GF mice, and GF mice mono-associated with S. epidermidis. Each data point represents an individual mouse (***P < 0.0005). Results are representative of two experiments.
Fig. 4
Fig. 4
Skin-resident commensals modulate dermal T cells in a manner dependent on IL-1 and MyD88. (A) Flow cytometric analysis of IL-17A production by live CD45+ TCRβ+ cells in skin and intestine of age-matched Myd88−/− and Il1r1−/− mice. WT, wild type; graphs show means ± SEM of three or four mice (***P < 0.0005). Results are representative of two or three experiments. (B) IL-17A production from purified skin CD45+ TCRβ+ T cells cultured in vitro in the presence of anti-CD3 and either IL-1α, IL-1β, or IL-6. Graphs represent the mean of three experimental groups ± SEM (*P < 0.05). Results are representative of three experiments. (C) Spontaneous release (± SEM) of IL-1α from skin-derived cells of SPF mice, GF mice, and GF mice monoassociated with S. epidermidis (S.epi) as measured by enzyme-linked immunosorbent assay (*P < 0.05, ***P < 0.0005). (D) Comparative assessment of IFN-γ and IL-17A production from WT and Myd88−/−/Ticam1−/− TCRβ+ cells from mixed bone marrow chimeric mice. Bar graphs show frequency (± SEM) of cytokine production by WT and knockout TCRβ+ cells. Results are representative of two experiments in the skin and one experiment in the gut (**P < 0.005). (E and F) Analysis of L. major–specific IFN-γ production by TCRB+ CD4+ T cells from WT and Myd88−/−/Ticam1−/− or Il1r1−/− mice. Results are representative of two experiments. (G) Flow cytometric assessment of L. major–specific IFN-γ production from TCRβ+ CD4+ T cells from the skin of SPF animals treated with either IL-1ra or phosphate-buffered saline (PBS). Results are a compilation of two experiments. (H) Number of CD45+ TCRβ+ IL-17A+ T cells from the skin of GF mice monoassociated with S. epidermidis treated with either IL-1ra or PBS. Results are representative of one experiment. (I) L. major–specific IFN-γ produced by TCRβ+ CD4+ T cells from the skin of GF mice monoassociated with S. epidermidis and treated with either IL-1ra or PBS. Results are representative of two experiments. For (E) to (I), each data point represents an individual mouse (**P < 0.005, ***P < 0.0005).

Comment in

References

    1. Lee YK, Mazmanian SK. Science. 2010;330:1768. - PMC - PubMed
    1. Huttenhower C, et al. Human Microbiome Project Consortium. Nature. 2012;486:207. - PubMed
    1. Methé BA, et al. Human Microbiome Project Consortium. Nature. 2012;486:215. - PMC - PubMed
    1. Ichinohe T, et al. Proc Natl Acad Sci USA. 2011;108:5354. - PMC - PubMed
    1. Cebra JJ. Am J Clin Nutr. 1999;69:1046S. - PubMed

Publication types