. 2012 Sep 7;337(6099):1231-5.
doi: 10.1126/science.1220834. Epub 2012 Jul 26.

Transforming fusions of FGFR and TACC genes in human glioblastoma

Affiliations

Transforming fusions of FGFR and TACC genes in human glioblastoma

Devendra Singh et al. Science. .

Abstract

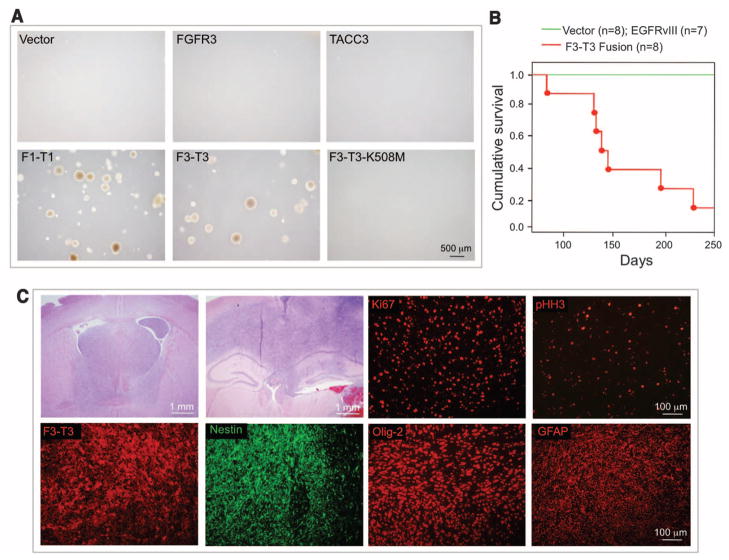
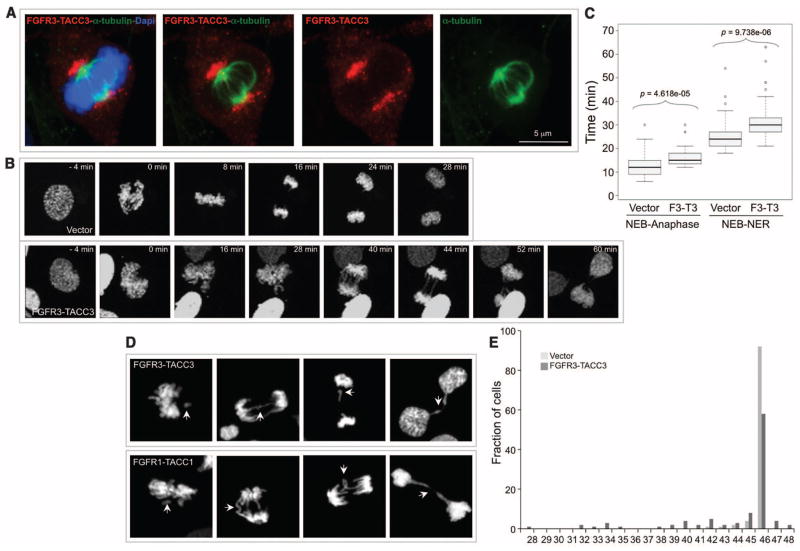
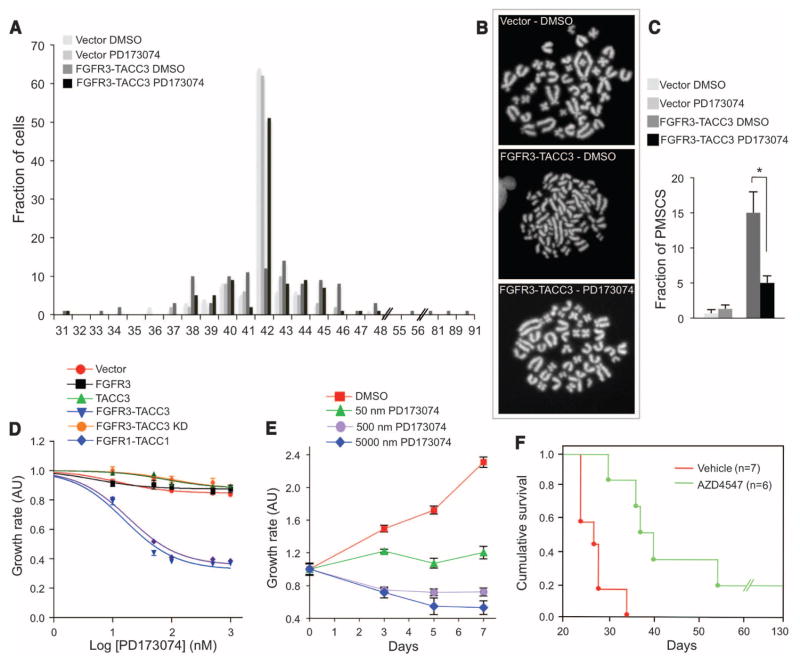
The brain tumor glioblastoma multiforme (GBM) is among the most lethal forms of human cancer. Here, we report that a small subset of GBMs (3.1%; 3 of 97 tumors examined) harbors oncogenic chromosomal translocations that fuse in-frame the tyrosine kinase coding domains of fibroblast growth factor receptor (FGFR) genes (FGFR1 or FGFR3) to the transforming acidic coiled-coil (TACC) coding domains of TACC1 or TACC3, respectively. The FGFR-TACC fusion protein displays oncogenic activity when introduced into astrocytes or stereotactically transduced in the mouse brain. The fusion protein, which localizes to mitotic spindle poles, has constitutive kinase activity and induces mitotic and chromosomal segregation defects and triggers aneuploidy. Inhibition of FGFR kinase corrects the aneuploidy, and oral administration of an FGFR inhibitor prolongs survival of mice harboring intracranial FGFR3-TACC3-initiated glioma. FGFR-TACC fusions could potentially identify a subset of GBM patients who would benefit from targeted FGFR kinase inhibition.


Figures

Fig. 1
Fig. 1
FGFR3-TACC3 gene fusion identified by whole-transcriptome sequencing of GSCs. (A) Here, 76 split-reads are shown aligning on the breakpoint. The predicted reading frame at the breakpoint is shown at the top with FGFR3 sequences in red and TACC3 in blue. (B) (Left) FGFR3-TACC3–specific PCR from cDNA derived from GSCs and GBMs. M, 1-kb DNA ladder. (Right) Sanger sequencing chromatogram showing the reading frame at the breakpoint and putative translation of the fusion protein in the positive samples. T, threonine; S, serine; D, aspartic acid; F, phenylalanine; E, glutamic acid. (C) Schematics of the FGFR3-TACC3 protein. Regions corresponding to FGFR3 or TACC3 are shown in red or blue, respectively. The fusion protein joins the tyrosine kinase domain of FGFR3 to the TACC domain of TACC3. (D) Genomic fusion of FGFR3 exon 17 with intron 7 of TACC3. In the fused mRNA, exon 16 of FGFR3 is spliced 5′ to exon 8 of TACC3. Solid black arrows indicate the position of the fusion-genome primers, which generate fusion-specific PCR products in GSC-1123 and GBM-1123.
Fig. 2
Fig. 2
Transforming activity of FGFR-TACC fusion proteins. (A) FGFR1-TACC1 and FGFR3-TACC3 induce anchorage-independent growth in Rat1A fibroblasts. F1-T1, FGFR1-TACC1; F3-T3, FGFR3-TACC3. (B) Kaplan-Meier survival curves of mice injected intracranially with pTomo-shp53 (n = 8 animals) or pTomo-EGFRvIII-shp53 (n = 7) (green line) and pTomo-FGFR3-TACC3-shp53 (n = 8) (red line). Points on the curves indicate deaths (log-rank test, P = 0.00001, pTomo-shp53 versus pTomo-FGFR3-TACC3-shp53). (C) Representative microphotographs of hematoxylin and eosin staining of advanced FGFR3-TACC3-shp53–generated tumors showing histological features of high-grade glioma. Note the high degree of infiltration of the normal brain by the tumor cells. Immunofluorescence staining shows that glioma and stem cell markers (Nestin, Olig2, and GFAP), proliferation markers (Ki67 and pHH3), and the FGFR3-TACC3 protein are widely expressed in the FGFR3-TACC3-shp53 brain tumors.
Fig. 3
Fig. 3
FGFR3-TACC3 localizes to spindle poles, delays mitotic progression, and induces chromosome segregation defects and aneuploidy. (A) Confocal microscopy analysis of FGFR3-TACC3 (red) covering the spindle poles of a representative mitotic cell. α-tubulin, green; DNA [stained with 4′,6-diamidino-2-phenylindole (DAPI)], blue. (B) Representative fluorescence video microscopy for cells transduced with vector or FGFR3-TACC3. (C) Box-and-whisker plot representing the analysis of the time from nuclear envelope breakdown (NEB) to anaphase onset and from NEB to nuclear envelope reconstitution (NER). The duration of mitosis was measured by following 50 mitoses for each condition by time-lapse microscopy. (D) Representative images of cells with chromosome missegregation. Arrows point to chromosome misalignments, lagging chromosomes, and chromosome bridges. (E) Distribution of chromosome counts of human astrocytes transduced with control or FGFR3-TACC3–expressing lentivirus. Chromosomes were counted in 100 metaphase cells for each condition to determine the ploidy and diversity of chromosome counts within the cell population.
Fig. 4
Fig. 4
Inhibition of FGFR-TK activity corrects the aneuploidy and suppresses tumor growth initiated by FGFR3-TACC3. (A) Karyotype analysis of Rat1A cells transduced with control or FGFR3-TACC3 lentivirus and treated with vehicle [dimethyl sulfoxide (DMSO)] or PD173470 (100 nM) for 5 days. (B) Correction of premature sister chromatid separation (PMSCS) by PD173470 in cells expressing FGFR3-TACC3. Panels show representative metaphase spreads. (C) Quantitative analysis of metaphases with loss of sister chromatid cohesion (FGFR3-TACC3 treated with DMSO versus FGFR3-TACC3 treated with PD173470). P = 0.001; error bars indicate SD. (D and E) Growth-inhibition assays of Rat1A cells transduced with the indicated lentivirus (D) and GSC-1123 (E) treated with PD173470 at the indicated concentrations. Cells were treated for 3 days (D) or for the indicated time (E). Cell viability was determined by the MTT assay. Error bars show means ± SE (n = 4 culture wells). AU, arbitrary units. (F) Survival of glioma-bearing mice was tracked after intracranial implantation of Ink4A;Arf−/− astrocytes transduced with FGFR3-TACC3. After tumor engraftment, mice were treated with vehicle or AZD4547 (50 mg/kg) for 20 days (vehicle, n = 7 animals; AZD4547, n = 6; P = 0.001).

Comment in

References

    1. Ablain J, Nasr R, Bazarbachi A, de Thé H. Cancer Discov. 2011;1:117. - PubMed
    1. Charest A, et al. Genes Chromosomes Cancer. 2003;37:58. - PubMed
    1. Mitelman F, Johansson B, Mertens F. Nat Rev Cancer. 2007;7:233. - PubMed
    1. Turner N, Grose R. Nat Rev Cancer. 2010;10:116. - PubMed
    1. Hood FE, Royle SJ. Bio Architecture. 2011;1:105. - PMC - PubMed

Publication types

MeSH terms