. 2012 Aug 14;109(33):E2230-9.
doi: 10.1073/pnas.1204386109. Epub 2012 Jul 25.

A role for ephrin-A5 in axonal sprouting, recovery, and activity-dependent plasticity after stroke

Affiliations

A role for ephrin-A5 in axonal sprouting, recovery, and activity-dependent plasticity after stroke

Justine J Overman et al. Proc Natl Acad Sci U S A. .

Abstract

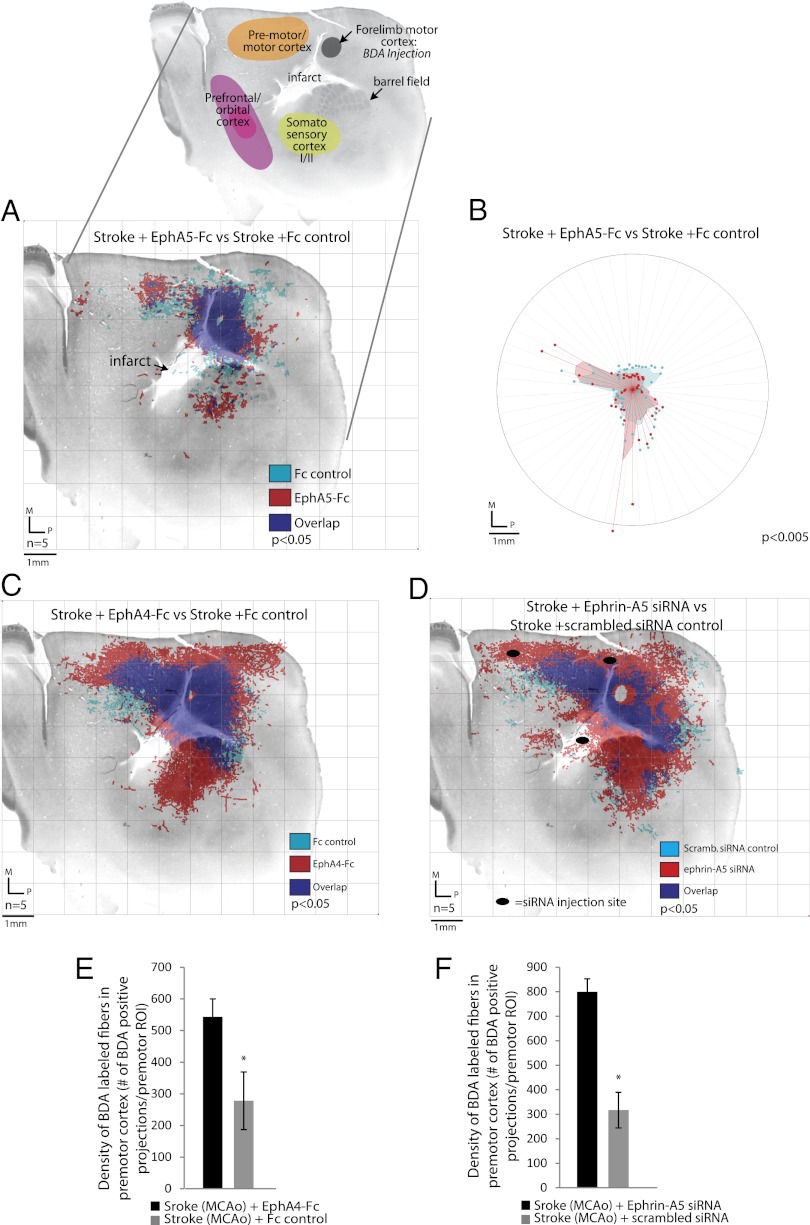
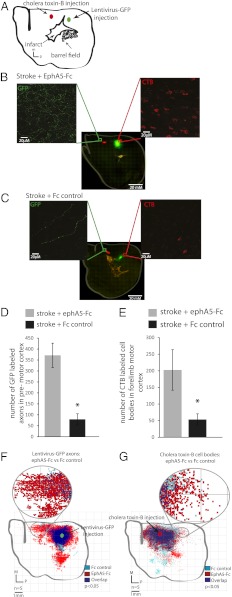
Stroke causes loss of neurological function. Recovery after stroke is facilitated by forced use of the affected limb and is associated with sprouting of new connections, a process that is sharply confined in the adult brain. We show that ephrin-A5 is induced in reactive astrocytes in periinfarct cortex and is an inhibitor of axonal sprouting and motor recovery in stroke. Blockade of ephrin-A5 signaling using a unique tissue delivery system induces the formation of a new pattern of axonal projections in motor, premotor, and prefrontal circuits and mediates recovery after stroke in the mouse through these new projections. Combined blockade of ephrin-A5 and forced use of the affected limb promote new and surprisingly widespread axonal projections within the entire cortical hemisphere ipsilateral to the stroke. These data indicate that stroke activates a newly described membrane-bound astrocyte growth inhibitor to limit neuroplasticity, activity-dependent axonal sprouting, and recovery in the adult.


Conflict of interest statement

Conflict of interest statement: The authors received research funding from BioTime Inc. for a portion of these studies.

Figures

Fig. 1.
Fig. 1.
Ephrin-A5 is up-regulated in astrocytes in periinfarct cortex. Ephrin-A5 signaling blockade results in improved neurite outgrowth on stretch-reactive astrocytes. (A) Laser capture microdissection of astrocytes in periinfarct cortex shows that ephrin-A5 is significantly up-regulated in astrocytes 7 d after stroke (*P < 0.01 by factorial ANOVA and Newman–Keuls’ multiple pairwise comparisons for post hoc comparisons; α= 0.05; n = 3). ipsi, ipsilateral; contra, contralateral. (B) Values are expressed as the fold change in the concentration ratio of gene expression after stroke normalized to GAPDH. In situ analysis of ephrin-A5 mRNA expression 14 d after stroke or sham operation shows increased ephrin-A5 expression in periinfarct cortex (C) compared with sham (D) (n = 3). (E) Western blot analysis shows that ephrin-A5 protein is increased in stretch-reactive astrocytes at 2 and 3 d poststretch compared with nonstretch control astrocytes in vitro. (FH) Cortical neurons (β3 tubulin, white) from 9-d-old mice were seeded onto in vitro matured control (control) or stretch-reactive astrocytes (stretch) (GFAP, blue). Neuronal process regeneration is inhibited over stretched astrocytes (G) compared with controls (F). (H) Neurite outgrowth is more vigorous in the presence of EphA5-Fc on reactive astrocytes compared with reactive astrocytes alone. (I) Mean process number per neuron is reduced in neurons regenerating on stretched vs. control astrocytes (P < 0.01). Process number is increased in neurons on stretched astrocytes with EphA5-Fc (*P < 0.05; n = 3). Neurons on stretch-reactive astrocytes (stretch) alone have decreased outgrowth length to one-third of control lengths (control, *P < 0.001; n = 3). (J) EphA5-Fc improves neuron outgrowth on stretched astrocytes, reaching similar lengths as those on control astrocytes. Plotted are means (±SEM). P values in I and J were calculated using multiple comparison ANOVA with Tukey–Kramer post hoc analysis.
Fig. 2.
Fig. 2.
Injection volume and quantity of labeled projections are uniform within groups, and EphA5-Fc blocks EphA phosphorylation. The techniques of stroke, hydrogel delivery of drug or vehicle, BDA (tracer) injection, and cortical flattening and tangential sectioning are illustrated. (A) Stroke is produced at day 0 (D0), hydrogel + drug is delivered to the infarct core at day 7 after stroke (D7), BDA is injected into the forelimb motor cortex at day 21 after stroke (D21), and tangential sections are cut through the flattened cortex. (B) Western blot analysis of phosphorylated EphA2/A3/A4/A5, normalized to actin, shows that levels of phosphorylated EphA (pEphA2/3/4/5) are lower in EphA5-Fc–treated animals at days 3 and 7 at 1.5, 2.5, and 3.5 mm from the infarct core compared with Fc control-treated animals and do not differ significantly from sham. phospho Tyr, phosphorylated tyrosine. (C) Projection map of sensorimotor cortex from labeled projections in sham-operated animals (pink), barrel field stroke + Fc control (turquoise), overlaid onto cytochrome oxidase-stained somatosensory body map. The BDA injection site is located at coordinates x,y: 0,0. (D) BDA injection volume is uniform within groups. (E) Total quantities of BDA-labeled 20-μm projection segments in the superficial layers of the cortex for each experimental group are plotted. For B, *P < 0.05 compared with EphA5-Fc and sham; **P < 0.05 compared with EphA5-Fc. For E, *P < 0.001 compared with sham; ^P < 0.001 compared with Fc (MCAo); #P < 0.001 compared with EphA5-Fc (PT); **P < 0.001 compared with EphA5-Fc + Botox (MCAo). Plotted in B, D, and E are means + SEM. P values were calculated by post hoc multiple pairwise comparison ANOVA, corrected for multiple comparisons using Tukey–Kramer post hoc analysis. M, medial; MCAo, barrel field stroke; P, posterior; PT, photothrombosis stroke.
Fig. 3.
Fig. 3.
Blockade of ephrin-A5 signaling leads to axonal sprouting in motor, premotor, and sensorimotor cortex. (A) Projection map of EphA5-Fc–treated animals (red) is significantly different from that of Fc control-treated animals (turquoise) (Hotelling’s t2 test; P < 0.05) following barrel field stroke. (Inset) Anatomical atlas of underlying cortical tissue, BDA injection, and barrel field stroke location. (B) Polar distribution map in register with connectional plot in A shows unique localization of sprouting in EphA5-Fc–treated animals compared with Fc control in regions of motor, premotor, and somatosensory cortex (Watson’s U2 test; P < 0.005). Shaded polygons represent the 70th percentile of the distances of labeled projections from the injection site in each segment of the graph; weighted polar vectors represent the normalized distribution of the quantity of points in a given segment of the graph for EphA5-Fc–treated (red) or Fc control (turquoise). (C) Projection map of EphA4-Fc–treated animals (red) is significantly different from that of Fc control-treated animals (turquoise) (Hotelling’s t2 test; P < 0.05). (D) Projection map of ephrin-A5 siRNA-treated animals (red) is significantly different from that of scrambled RNA control-treated animals (turquoise) (Hotelling’s t2 test; P < 0.05). Black ellipses in D indicate siRNA injection sites. (E) Density of BDA-labeled projections in premotor cortex is significantly greater in EphA4-Fc–treated animals compared with Fc control-treated animals (*P < 0.05, Student t test). (F) Density of BDA labeled projections in premotor cortex is significantly greater in ephrin-A5 siRNA-treated animals compared with scrambled siRNA control-treated animals (*P < 0.05, Student t test). n = 5 in all groups. M, medial; P, posterior.
Fig. 4.
Fig. 4.
Reciprocal labeling in motor and premotor cortex demonstrates new circuitry after stroke and ephrin blockade. (A) Animals received MCAo stroke, hydrogel + EphA5-Fc, or Fc control, followed by lentivirus-GFP injection into the forelimb motor cortex and CTb injection into the premotor cortex. High-magnification photomicrographs show representative images of GFP-positive axons (green) in premotor cortex and CTb-positive cell bodies (red) in motor cortex from EphA5-Fc–treated animals (B) and Fc control-treated animals (C). (D) There is a significantly greater density of GFP-positive axons in the premotor cortex in EphA5-Fc–treated animals compared with Fc control. (E) There is a significantly greater density of CTb-positive cell bodies in the motor cortex in EphA5-Fc–treated animals compared with Fc control. (D and E, *P < 0.05, Student's t test.) (F) Projection profile of anterogradely labeled GFP-positive axons is significantly different in EphA5-Fc–treated animals (red) compared with Fc control-treated animals (light blue) (Hotelling’s t2 test, P < 0.05). (G) Projection profile of retrogradely labeled CTb-positive cell bodies is significantly different in EphA5-Fc–treated animals (red) compared with Fc control-treated animals (light blue) (Hotelling’s t2 test, P < 0.05). n = 5 in all groups for AH. M, medial; P, posterior.
Fig. 5.
Fig. 5.
Ephrin-A5 signaling regulates axonal sprouting and functional recovery after stroke. (A) Maps of projections from forelimb motor cortex in photothrombosis stroke for EphA5-Fc–treated animals (red) are significantly different from those for Fc control-treated animals (turquoise) (Hotelling’s t2 test, P < 0.05), with unique projections in motor, premotor, and somatosensory cortical areas. (Inset) Anatomical atlas of underlying cortical tissue, BDA injection, and photothrombotic stroke location. (B) Polar distribution maps indicate significantly different direction and magnitude of projections in EphA5-Fc–treated animals compared with control (Watson’s U2 test, P < 0.005). Clustered (Clust) ephrin-A5-Fc significantly blocks this axonal sprouting, producing a projection profile (Hotelling’s t2 test, P < 0.01) (C) and polar distribution (Watson’s U2 test, P < 0.005) (D), with an absence of axonal sprouting in motor and premotor cortex but not in somatosensory cortex compared with Fc control. A projection map (Hotelling’s t2 test, P < 0.05) (E) and polar distribution (Watson’s U2 test, P < 0.005) (F) of clustered ephrin-A5-Fc–treated animals are significantly different from those of EphA5-Fc–treated animals. There is an absence of axonal sprouting in premotor and prefrontal cortex and a reduction in somatosensory sprouting in clustered eprhin-A5-Fc–treated animals compared with EphA5-Fc–treated animals (n = 7). Units of axes are microns in A–F. EphA5-Fc–treated animals perform significantly better than control animals (#P < 0.01) on forelimb grid walking (G) and cylinder behavioral tasks (H). Behavioral recovery in animals following delivery of clustered ephrin-A5-Fc is significantly reduced compared with EphA5-Fc–treated (^P < 0.01) and Fc control-treated (#P < 0.01) animals in grid-walking (G) and cylinder tasks (H). Plotted are means ± SEM. n = 7 in all groups. P values in G and H were calculated by post hoc multiple pairwise comparison repeated measures ANOVA, corrected for multiple comparisons using Tukey–Kramer post hoc analysis. clust, clustered; M, medial; P, posterior; PT, photothrombosis.
Fig. 6.
Fig. 6.
Forced limb use combined with ephrin-A5 signaling blockade results in widespread reorganization of the ipsilateral cortex. (A) Composite map of forelimb motor cortex projections in Botox + EphA5-Fc stroke (red) and Botox + Fc stroke (blue) shows increase in motor cortex projections with Botox + EphA5-Fc (Hotelling’s t2 test, P < 0.01). (B) Polar distribution plot indicates that long-distance sprouting occurs in Botox + stroke/EphA5-Fc–treated animals (red) and is absent in Botox + stroke/Fc-treated animals (turquoise) (Watson’s U2 test, P < 0.005). (C) Density of BDA-labeled projections in premotor cortex in EphA5-Fc/Botox–treated animals is significantly greater than that of Fc control/Botox-treated animals (*P < 0.05, Student t test). (D) Composite map of Botox + Fc stroke (blue) compared with Fc stroke (no Botox, purple) indicates that there is a modest but significant difference in projections in Botox-treated stroke animals compared with non–Botox-treated stroke animals (Hotelling’s t2 test, P < 0.02). (E) Botox-induced restraint of the ipsilateral forelimb of sham-operated animals results in a significantly different projection profile compared with sham + no forced use (Hotelling’s t2 test, P < 0.05). n = 5 for all groups in AE. (F) Student t tests and their corresponding P value maps were computed for each pixel of the projection map. Functionally relevant anatomical brain regions were defined as ROIs for statistical comparison across groups, and linear models were only fit over pixels covered by the ROI masks in premotor (blue), somatosensory I/II (yellow), prefrontal/orbital (pink), or temporal/occipital (green) cortical areas. The Student t2 test, followed by an FDR post hoc (a = 0.05) analysis to correct for multiple comparisons, was applied at each pixel in the image domain to generate P values. Arrows and lines represent distinct functional networks induced by stroke, ephrin manipulation, and/or activity. Reported are significant differences (P < 0.05) between groups within the specified ROI. In F, ***P < 0.05 for MCAo EphA5-Fc vs. MCAo Fc control, PT EphA5-Fc vs. PT Fc control, and PT EphA5-Fc vs. PT clustered ephrin-A5-Fc; **P < 0.05 for MCAo EphA5-Fc + Botox vs. MCAo Fc control + Botox; *P < 0.05 for PT EphA5-Fc vs. PT Fc control.
Fig. P1.
Fig. P1.
Summary of new circuitry formed after stroke and ephrin-A5 signaling blockade, recovery of function, and patterned behavioral activity combined with ephrin blockade. Axonal sprouting was analyzed using quantitative connectional mapping after middle cerebral artery occlusion stroke or photothrombosis stroke and manipulation of ephrin-A5 signaling. Arrows and lines represent distinct functional networks induced by stroke, ephrin manipulation, and/or activity. Reported are significant differences (P < 0.05) between groups within the specified cortical area. ***P < 0.05 for stroke + ephrin blockade vs. control stroke, photothrombosis stroke + ephrin blockade vs. photothrombosis control stroke, and photothrombosis + ephrin blockade vs. photothrombosis stroke + ephrin induction; **P < 0.05 for stroke + ephrin blockade + forced overuse vs. control stroke + forced overuse; *P < 0.05 for photothrombosis + ephrin blockade vs. photothrombosis control stroke.

Similar articles

Cited by

References

    1. Lee JK, Kim JE, Sivula M, Strittmatter SM. Nogo receptor antagonism promotes stroke recovery by enhancing axonal plasticity. J Neurosci. 2004;24:6209–6217. - PMC - PubMed
    1. Brown CE, Aminoltejari K, Erb H, Winship IR, Murphy TH. In vivo voltage-sensitive dye imaging in adult mice reveals that somatosensory maps lost to stroke are replaced over weeks by new structural and functional circuits with prolonged modes of activation within both the peri-infarct zone and distant sites. J Neurosci. 2009;29:1719–1734. - PMC - PubMed
    1. Li S, et al. An age-related sprouting transcriptome provides molecular control of axonal sprouting after stroke. Nat Neurosci. 2010;13:1496–1504. - PMC - PubMed
    1. Li S, Carmichael ST. Growth-associated gene and protein expression in the region of axonal sprouting in the aged brain after stroke. Neurobiol Dis. 2006;23:362–373. - PubMed
    1. Carmichael ST, et al. Growth-associated gene expression after stroke: Evidence for a growth-promoting region in peri-infarct cortex. Exp Neurol. 2005;193:291–311. - PubMed

Publication types

MeSH terms