. 2012 Sep 27;120(13):2639-49.
doi: 10.1182/blood-2012-03-416461. Epub 2012 Jul 26.

Subnetwork-based analysis of chronic lymphocytic leukemia identifies pathways that associate with disease progression

Affiliations

Subnetwork-based analysis of chronic lymphocytic leukemia identifies pathways that associate with disease progression

Han-Yu Chuang et al. Blood. .

Abstract

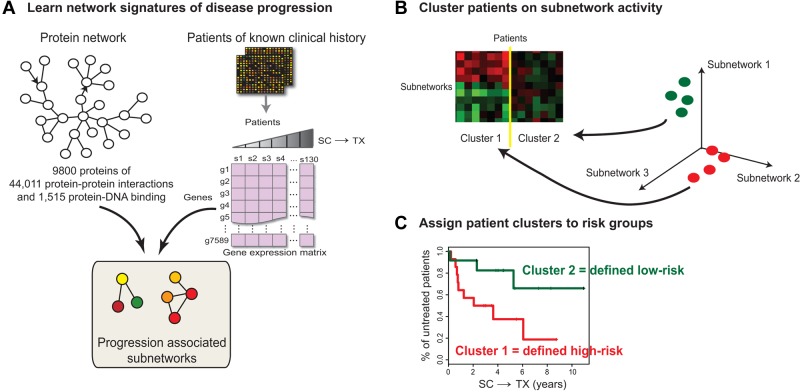
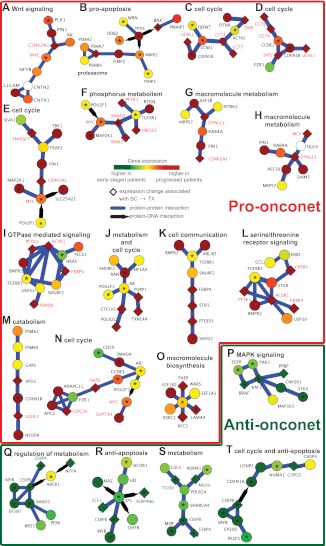
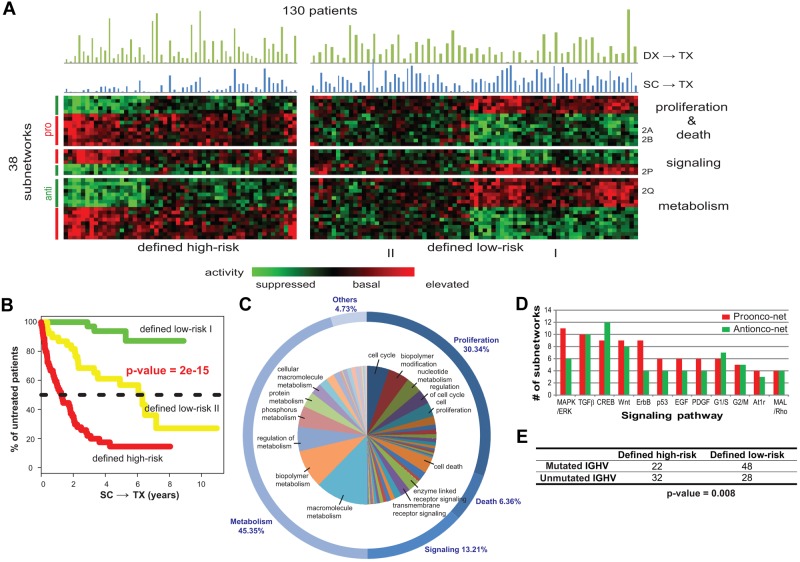
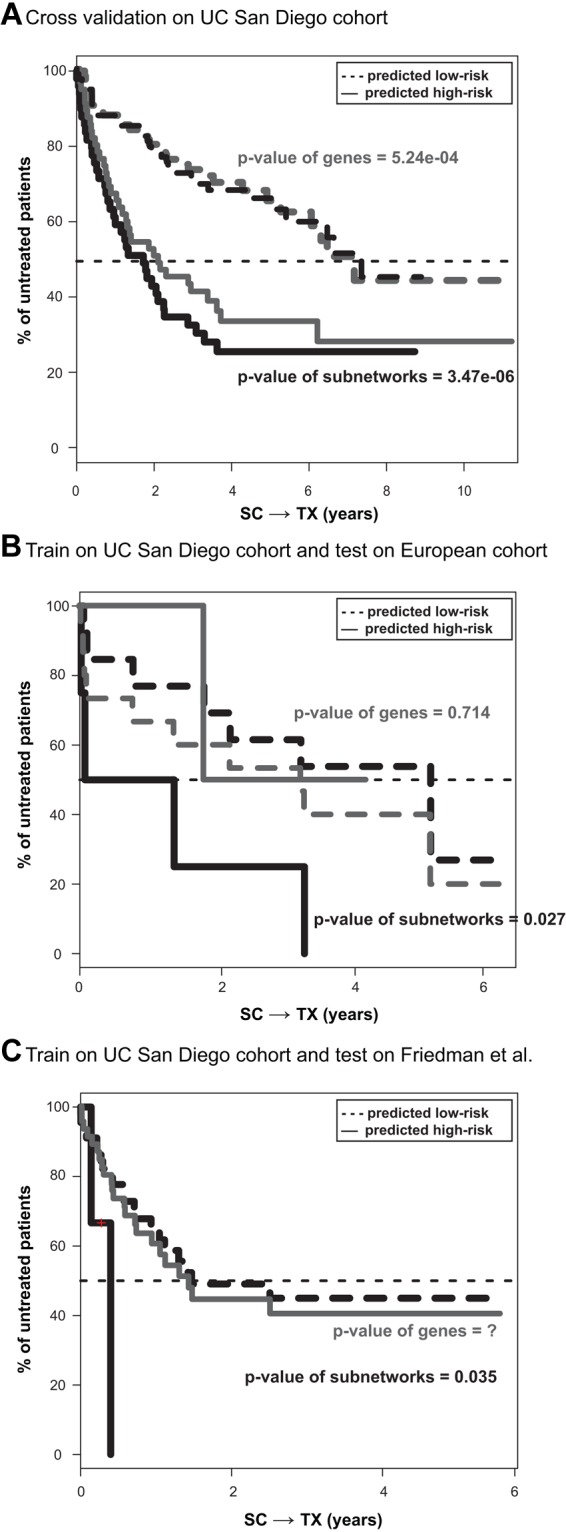
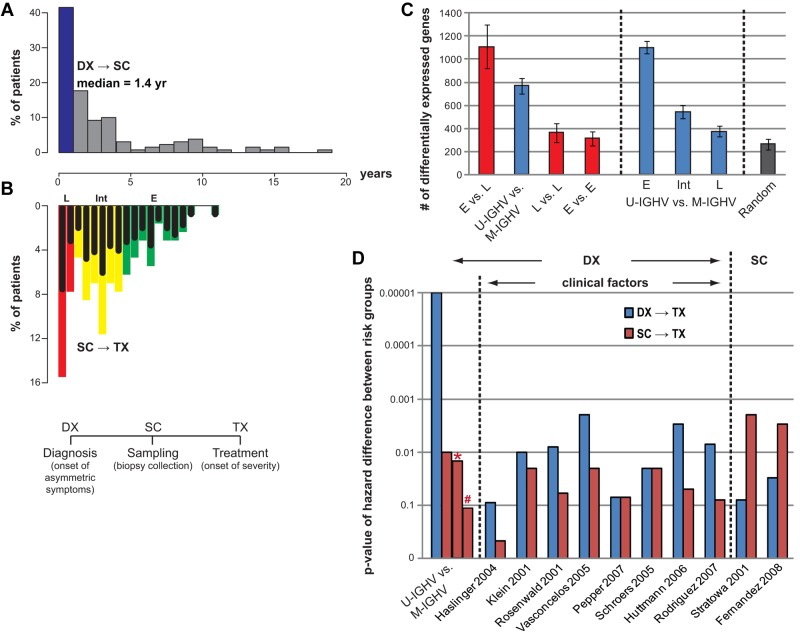
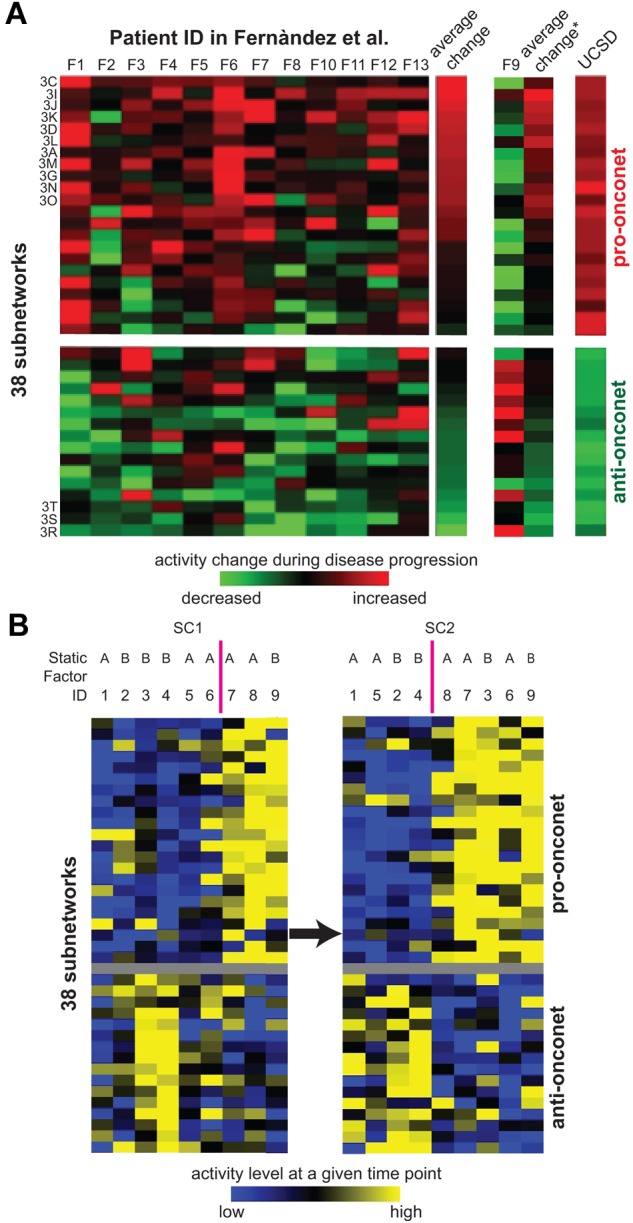
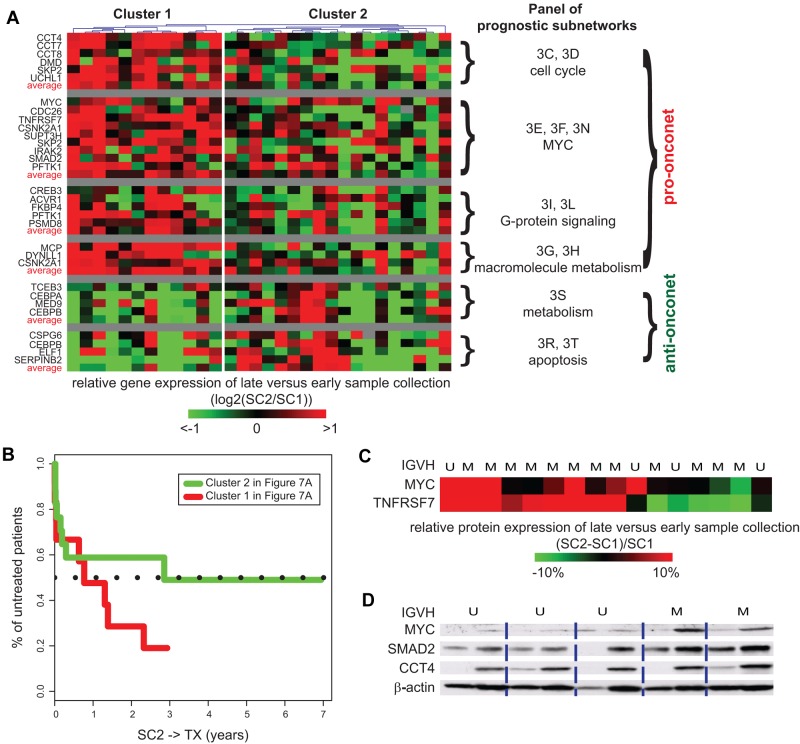
The clinical course of patients with chronic lymphocytic leukemia (CLL) is heterogeneous. Several prognostic factors have been identified that can stratify patients into groups that differ in their relative tendency for disease progression and/or survival. Here, we pursued a subnetwork-based analysis of gene expression profiles to discriminate between groups of patients with disparate risks for CLL progression. From an initial cohort of 130 patients, we identified 38 prognostic subnetworks that could predict the relative risk for disease progression requiring therapy from the time of sample collection, more accurately than established markers. The prognostic power of these subnetworks then was validated on 2 other cohorts of patients. We noted reduced divergence in gene expression between leukemia cells of CLL patients classified at diagnosis with aggressive versus indolent disease over time. The predictive subnetworks vary in levels of expression over time but exhibit increased similarity at later time points before therapy, suggesting that degenerate pathways apparently converge into common pathways that are associated with disease progression. As such, these results have implications for understanding cancer evolution and for the development of novel treatment strategies for patients with CLL.


Figures

Figure 1
Figure 1
Schematic overview of subnetwork identification and definition of risk groups. (A) The expression profile of each gene is projected onto its corresponding protein in a protein-protein interaction subnetwork. A greedy search is performed to find subnetworks for which the activities are associated with the time from sample collection to treatment (SC→TX). Significant subnetworks are selected based on null distributions estimated from permuted data. Subnetworks are used to identify disease genes, and the subnetwork activity is used to characterize the signatures of different risk groups. (B) K-means clustering segregates patients by their distinct subnetwork activity patterns. (C) Patient clusters are assigned high versus low risk based on median treatment-free probabilities in a Kaplan-Meier analysis.
Figure 2
Figure 2
Example subnetworks of CLL disease progression enriched for the hallmarks of cancer. (A-O) Pro-onconets. (P-T) Anti-onconets. Nodes and links represent human proteins and protein physical interactions, respectively. Blue links indicate protein-protein interactions; black arrows indicate protein-DNA binding. The color of each node scales with the change in gene expression in patients of shorter treatment-free survival intervals versus longer: red represents up-regulation in patients of shorter intervals whereas green represents down-regulation. The predominant cellular functions are indicated next to each subnetwork. Known cancer susceptibility genes are highlighted by a black asterisk. Names of genes marked in red/green are further probed for serial expression in an additional patient cohort (red indicates genes expressed in pro-onconets and green indicates those expressed in anti-onconets).
Figure 3
Figure 3
Subnetwork signatures of CLL disease progression. (A) Activity of the 38 significant subnetworks (rows) across the 130 patients (columns). The color of each block scales with the activity level of a subnetwork in a particular patient. Patients are clustered into high/low-risk groups, and subnetworks are clustered into 3 functional categories (proliferation and death, signaling, and metabolism). Blue bars above the heatmap show the intervals of SC→TX for each sample while green bars chart the intervals of DX→TX. (B) Kaplan-Meier analysis yields treatment-free probabilities with regard to the 3 risk groups defined by subnetwork activity patterns. (C) Distribution of the predominant cellular functions associated with the 38 subnetworks. Related functions are clustered into categories named on the outer circle. The marked functions in the inner circle are associated with at least 2% of the subnetworks. See supplemental Figure 4 for all enriched functions. (D) Top enriched signaling cascades. Bars show numbers of the 38 subnetworks, which have member genes involved in each pathway. (E) Comparison of patient stratification by subnetwork prognosis versus IGHV mutation status.
Figure 4
Figure 4
Use of expression levels of genes versus subnetworks to stratify patient samples. (A) Five-fold cross-validation on the 130 patients evaluated at UC San Diego. Survival analyses on SC→TX are shown for both the low- (dashed lines) and high- (solid lines) risk groups predicted by subnetwork signatures (black lines) or by gene signatures (gray lines). (B-C) Survival curves on SC→TX for (B) the 17 European patients or for (C) the patient cohort in Friedman et al. The 2 risk groups are predicted by 2 sets of markers developed on the UC San Diego cohort, including the 38 subnetworks (black lines) and the top 230 genes (gray lines).
Figure 5
Figure 5
Disparity in gene expression between pretreatment samples collected at various times after diagnosis. (A) Histograms depicting the proportion of patients in the UC San Diego cohort who had sample collection (SC) at various years after diagnosis (DX), as indicated below the graph. The blue bar indicates the proportion of patients who had SC less than 1 year after DX. (B) Inverse histograms depicting the proportion of patients in the UC San Diego cohort who had SC at 1 or more years before therapy, as indicated in the scale above the graph. The samples are considered representative of patients with early-phase disease (“E”) if they were collected more than 4 years before therapy (green bars), intermediate phase (“I”) if collected 4 or less, but 1 or more, years before therapy (yellow bars), or late phase (“L”) if collected less than 1 year before therapy (red bars). The black bars in each colored bar depict the proportion of samples collected in that respective year before therapy that had CLL cells with mutated IGHV. (C) Gene expression differences between different phases of the disease (leftmost panel) and between IGHV subgroups at different phases (middle panel). Bars chart the mean number of differentially expressed genes from 5 trials of 2-tail t tests on 12 versus 12 samples with P value cutoffs at .05. Permutation tests on the same sample sets were performed to assess the numbers of false positives (rightmost panel). (D) Treatment-free survival analyses of all 130 UC San Diego patients using published marker sets. Bars chart the P value of the difference between the low- and high-risk groups, defined by each marker set reported previously. Each marker set is evaluated on both DX→TX (blue bars) and SC→TX (red bars). Bars with * or # denote P value of the difference between SC→TX for samples segregated via IGHV mutation status when the time from DX→SC was less than 1 year (*) or more than year (#), respectively.
Figure 6
Figure 6
Serial expression of example subnetwork genes and the subnetwork signature along disease progression. (A) Subnetwork activities in serial samples of 9 additional patients registered at UC San Diego. Rows and columns represent subnetworks and patients, respectively. SC1 marks the earlier sample while SC2 represents the later sample of the same patient. Both SC1 and SC2 are before TX. The color of each block scales with the activity level of a subnetwork in a particular patient at either SC1 or SC2 relative to the average activity of all the studied samples. The static factor status of patients is listed above the columns: “A” indicates unmated IGHV and ZAP70 positive; and “B”, mutated IGHV and ZAP70 negative. (B) Subnetwork activity changes in serial samples of 13 patients from Fernandez and colleagues. Rows and columns represent subnetworks and patients, respectively. The color of each block scales with the activity change in a subnetwork from the initial versus subsequent sample of each particular patient. The heatmap of patient F9 is separately displayed because of its contrasting pattern versus the other 12 patients. The average change column illustrates the averaged activity change in a subnetwork across patients: the column with an asterik (*) represents the average of all the 13 patients, whereas the column labeled “average change” without the asterisk excludes the data from patient 9. The rightmost column denotes the prognosis power of the 38 subnetworks on UC San Diego samples (the coefficient of each subnetwork as the predictor in a univariate Cox hazard model on SC→TX). The subnetworks that have significant differences between initial and subsequent samples from each patient in Fernandez and colleagues (P < .05 from a 1-tailed t test) are indicated by the figure panels in which they are displayed (“3C”, “3I”, etc).
Figure 7
Figure 7
Serial gene and protein expression of example subnetwork genes during disease progression. (A) Gene expression changes in serial samples of 30 additional patients registered at UC San Diego. Rows and columns represent genes and patients, respectively. The color of each block scales with the log2-transformed ratio of a gene in the earlier sample (SC1) compared with the later sample (SC2) of a particular patient. Both SC1 and SC2 are before TX. The “average” rows illustrate the averaged expression change of genes in similar subnetworks across patients. Genes participating in similar subnetworks are clustered together and the figures of the corresponding subnetworks are indexed next to each cluster. Patients are clustered based on their changes on gene expression by a hierarchical clustering dendrogram. (B) Survival analyses on SC2→TX are shown for both cluster 1 (red line) and cluster 2 (green line) segregated by gene expression changes in panel A. (C) Heatmap of protein expression changes of MYC and TNFRSF7 measured by flow cytometry in serial samples of 16 patients registered at UC San Diego. Colors represent the percentage of change in median florescence intensity of a protein in the later sample compared with the earlier sample of a particular patient. (D) Immunoblotting of MYC, SMAD2, and CCT4 in serial samples of 5 patients.

Similar articles

Cited by

References

    1. Hallek M, Cheson BD, Catovsky D, et al. Guidelines for the diagnosis and treatment of chronic lymphocytic leukemia: a report from the International Workshop on Chronic Lymphocytic Leukemia updating the National Cancer Institute-Working Group 1996 guidelines. Blood. 2008;111(12):5446–5456. - PMC - PubMed
    1. Fais F, Ghiotto F, Hashimoto S, et al. Chronic lymphocytic leukemia B cells express restricted sets of mutated and unmutated antigen receptors. J Clin Invest. 1998;102(8):1515–1525. - PMC - PubMed
    1. Hamblin TJ, Davis Z, Gardiner A, Oscier DG, Stevenson FK. Unmutated Ig V(H) genes are associated with a more aggressive form of chronic lymphocytic leukemia. Blood. 1999;94(6):1848–1854. - PubMed
    1. Damle RN, Wasil T, Fais F, et al. Ig V gene mutation status and CD38 expression as novel prognostic indicators in chronic lymphocytic leukemia. Blood. 1999;94(6):1840–1847. - PubMed
    1. Rassenti LZ, Huynh L, Toy TL, et al. ZAP-70 compared with immunoglobulin heavy-chain gene mutation status as a predictor of disease progression in chronic lymphocytic leukemia. N Engl J Med. 2004;351(9):893–901. - PubMed

Publication types

MeSH terms